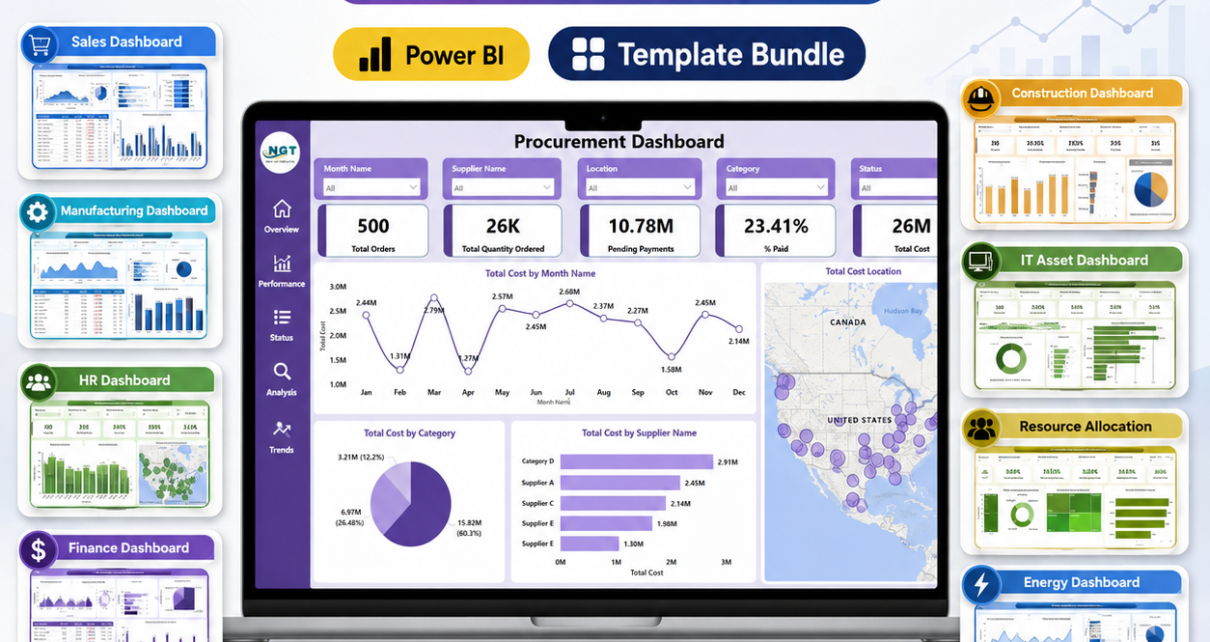
If you have ever wished you could roll out professional business intelligence across every department without spending weeks building reports, the Power BI Industry Dashboards Vol.2 is exactly what you have been waiting for. This mega-bundle from NextGenTemplates packs 15 premium, ready-to-use Power BI dashboard templates into a single download — covering procurement, manufacturing, expense tracking, construction, HR, energy, IT, facilities, logistics, healthcare, inventory and contractPower BI Industry Dashboards Vol.2 management. Purchased individually these templates would cost $269.85, but the bundle is available for just $139.99 — a straight 48% saving of $129.86. Explore more Power BI dashboards and dashboard templates on the store.Power BI Industry Dashboards Vol.2
📦 Power BI Industry Dashboards Vol.2 — 15 Templates for $139.99
Was $269.85 → Now $139.99 | Save 48%
Why a Power BI Dashboard Bundle Makes Sense
Building a single production-grade Power BI report takes days: designing the data model, writing DAX measures, laying out KPI cards, wiring slicers and testing drill-downs. Multiply that by twelve or fifteen business functions and you are looking at months of effort. The Power BI Industry Dashboards Vol.2 eliminates that work. Every template in this collection is a complete .pbix file with a pre-built data model, tested DAX measures, interactive slicers and a consistent corporate design. You simply open the file in the free Power BI Desktop, replace the sample data with your own through Power Query, and every visual refreshes automatically.Power BI Industry Dashboards Vol.2
Because the bundle spans procurement, operations, HR, finance, healthcare and logistics, it works equally well for a single company that wants organization-wide reporting and for consultants or BI developers who serve clients across many industries. One purchase, fifteen deployable analytics solutions.
Key Features of the Power BI Industry Dashboards Vol.2
Complete .pbix files, not just layouts. Each of the 15 dashboards ships as a fully working Power BI file with data model, relationships and measures already configured — you are never starting from a blank canvas.Power BI Industry Dashboards Vol.2
Pre-built DAX measures and KPIs. Totals, percentages, period trends, on-time rates and utilization metrics are calculated out of the box, so the numbers your stakeholders care about appear the moment your data loads.Power BI Industry Dashboards Vol.2
Interactive multi-page reports. Every template includes multiple analysis pages — overview summaries, category breakdowns, performance views and detail pages — connected by slicers for month, department, supplier, location and more.Power BI Industry Dashboards Vol.2
Consistent, boardroom-ready design. All 15 dashboards follow a professional corporate style with KPI cards, clean chart layouts and readable color themes, which makes cross-department reporting look cohesive.Power BI Industry Dashboards Vol.2
Plug-and-play data replacement. Swap the sample dataset with your own via Transform Data and refresh — no rebuild required. Most users are presenting live insights on day one.Power BI Industry Dashboards Vol.2
What’s Included — All 15 Dashboards
1. Procurement Dashboard in Power BI
Track total orders, quantities, procurement cost, pending payments and supplier performance with dedicated pages for order status, payment analysis and category spend. Ideal for procurement managers who need real-time control over purchasing.Power BI Industry Dashboards Vol.2
2. Manufacturing Efficiency Dashboard in Power BI
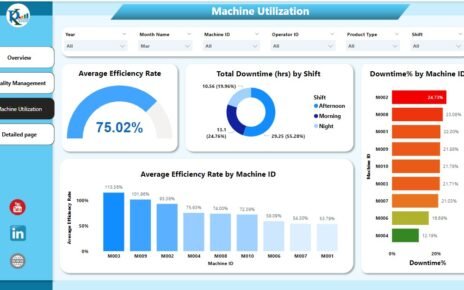
Monitor production output, downtime, defect rates and overall equipment effectiveness across plants and lines, so operations leaders can pinpoint bottlenecks and lift throughput.
3. Expense Tracking Dashboard in Power BI
Analyze company spending by category, department, vendor and month to keep budgets under control and spot cost creep before it becomes a problem.Power BI Industry Dashboards Vol.2
4. Construction Dashboard in Power BI
Oversee project progress, budget vs actual, safety incidents and contractor performance across sites — a single control tower for construction firms and project managers.Power BI Industry Dashboards Vol.2
5. Training and Development Dashboard in Power BI
Measure training hours, completion rates, program costs and skill development so HR and L&D teams can prove the ROI of their programs.
6. Recruitment Pipeline Dashboard in Power BI
Visualize candidates by hiring stage, source, time-to-hire and recruiter performance to keep the talent pipeline moving and hiring managers informed.Power BI Industry Dashboards Vol.2
7. Resource Allocation Dashboard in Power BI
Balance workloads, utilization and capacity across teams and projects, making over- and under-allocation instantly visible to project and delivery leads.Power BI Industry Dashboards Vol.2
8. Energy Consumptions Dashboard in Power BI
Track energy usage, cost and efficiency across sites and equipment — essential for facilities and sustainability teams working on consumption reduction targets.
9. Employee Turnover Dashboard in Power BI
Understand attrition by department, tenure, reason and demographics so HR leaders can act on retention risks with evidence instead of anecdotes.Power BI Industry Dashboards Vol.2
10. IT Asset Management Dashboard in Power BI
Manage hardware, software licenses, warranties and lifecycle costs from one view — a must-have for IT managers juggling hundreds of assets.Power BI Industry Dashboards Vol.2
11. Facilities Management Dashboard in Power BI
Track maintenance requests, occupancy, operating costs and vendor SLAs across buildings to keep facilities running smoothly and within budget.Power BI Industry Dashboards Vol.2
12. Transportation & Logistics Dashboard in Power BI
Monitor shipments, on-time delivery, fleet costs and route analytics — built for logistics coordinators and supply-chain managers who live and die by delivery performance.Power BI Industry Dashboards Vol.2
13. Healthcare Dashboard in Power BI
Analyze patient volumes, bed occupancy, revenue and clinical KPIs, giving hospital administrators a clear operational picture without custom development.
14. Inventory Management Dashboard in Power BI
Control stock levels, reorder points, turnover and warehouse value so you never over-order or run out of critical items again.
15. Contract Management Dashboard in Power BI
Stay ahead of contract renewals, values, vendors and compliance status — no more surprise auto-renewals or lapsed agreements.
Smart Comparison — Individual Purchase vs Bundle
| # | Dashboard Template | Platform | Individual Price |
|---|---|---|---|
| 1 | Procurement Dashboard | Power BI | $17.99 |
| 2 | Manufacturing Efficiency Dashboard | Power BI | $17.99 |
| 3 | Expense Tracking Dashboard | Power BI | $17.99 |
| 4 | Construction Dashboard | Power BI | $17.99 |
| 5 | Training and Development Dashboard | Power BI | $17.99 |
| 6 | Recruitment Pipeline Dashboard | Power BI | $17.99 |
| 7 | Resource Allocation Dashboard | Power BI | $17.99 |
| 8 | Energy Consumptions Dashboard | Power BI | $17.99 |
| 9 | Employee Turnover Dashboard | Power BI | $17.99 |
| 10 | IT Asset Management Dashboard | Power BI | $17.99 |
| 11 | Facilities Management Dashboard | Power BI | $17.99 |
| 12 | Transportation & Logistics Dashboard | Power BI | $17.99 |
| 13 | Healthcare Dashboard | Power BI | $17.99 |
| 14 | Inventory Management Dashboard | Power BI | $17.99 |
| 15 | Contract Management Dashboard | Power BI | $17.99 |
| Individual Total | $269.85 | ||
| Bundle Price | $139.99 | ||
| You Save | $129.86 (48%) | ||
Advantages of Buying the Bundle
Cost efficiency: at $139.99 the effective price per dashboard drops to about $9.33 — nearly half the individual price of $17.99 each.
Organization-wide consistency: because every template shares the same design language, executives get a uniform reporting experience across procurement, HR, finance, IT and operations instead of a patchwork of styles.
Future flexibility: even if you only need three or four dashboards today, the remaining templates are ready the moment a new department asks for analytics — no new purchase, no waiting.
Learning accelerator: BI developers and students get 15 professionally built data models and DAX pattern libraries to study, reuse and adapt in client work.
Best Practices for Deploying the Bundle
Start with the one or two dashboards tied to your most urgent reporting pain — typically procurement or expense tracking — and get real data flowing into them first. Standardize your source data column names to match the sample structure before importing; this makes the Power Query replacement step nearly effortless. Once the first dashboards are live, publish them to the Power BI Service and set scheduled refresh so stakeholders always see current numbers. Roll out the remaining templates department by department, reusing the same date and dimension tables where possible to keep your models lean.
Explore More Templates
Browse the full collection of Power BI Dashboards, Dashboard Templates and all templates on NextGenTemplates.com to find bundles and single templates for every business function.
FAQs
Q1. What file format do the dashboards come in?
Each dashboard is a native Power BI .pbix file. All 15 files are delivered together in a single ZIP immediately after purchase.
Q2. Do I need a paid Power BI license to use them?
No. Every template opens and works fully in Power BI Desktop, which is free from Microsoft. A Pro license is only needed if you want to publish and share via the Power BI Service.
Q3. Can I replace the sample data with my own?
Yes — that is the core design. Use Transform Data (Power Query) to point the model at your own file or database, refresh, and every KPI, chart and slicer updates automatically.
Q4. Are the dashboards customizable?
Completely. You can change colors, logos, visuals, add pages or extend the DAX measures. The files are unlocked and fully editable.
Q5. Is this a one-time payment or a subscription?
One-time payment of $139.99 with lifetime access to the files. No recurring fees.
Q6. Who is this bundle best suited for?
BI developers, data analysts, consultants, and operations, HR, finance, IT, facilities and logistics managers who want professional analytics without building reports from scratch.
Conclusion
The Power BI Industry Dashboards Vol.2 is one of the fastest ways to bring enterprise-grade business intelligence to every corner of your organization. Fifteen professional dashboards, one download, one payment of $139.99 — and $129.86 kept in your pocket compared to buying individually. Whether you are a BI developer serving clients or a manager who needs answers today, this bundle pays for itself with the very first dashboard you deploy.
🚀 Ready to Upgrade Your Reporting?
Get all 15 Power BI dashboards for $139.99 — Save 48% ($129.86)
Visit our YouTube channel for step-by-step Power BI video tutorials: Youtube.com/@PKAnExcelExpert