Managing resources efficiently is essential for successful project management. The Project Management Resource Allocation KPI Dashboard in Excel provides a robust, ready-to-use tool designed specifically to streamline and optimize resource management. This article explores all essential details, advantages, best practices, and frequently asked questions to help you utilize this dashboard effectively.
Introduction to Project Management Resource Allocation KPI Dashboard
Every successful project depends heavily on how effectively resources are allocated. Mismanagement of resources leads to delays, increased costs, and failed objectives. To avoid these common pitfalls, project managers rely on Key Performance Indicators (KPIs) to track and measure resource utilization.
The Project Management Resource Allocation KPI Dashboard in Excel is crafted precisely to address these challenges. It allows project managers to monitor critical metrics, optimize resource usage, and enhance overall project outcomes.
Click to Purchases Project Management Resource Allocation KPI Dashboard in Excel
Key Features of the Project Management Resource Allocation KPI Dashboard
This Excel-based dashboard includes seven interactive worksheets designed to cover all aspects of resource allocation:
Home Sheet
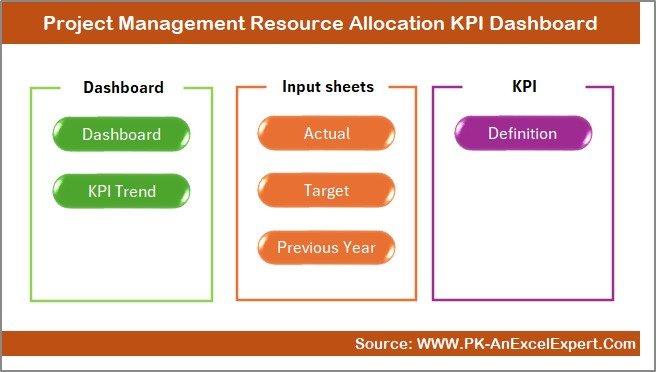
This is your starting point, serving as an index sheet with intuitive navigation buttons. It allows quick access to other worksheets with a single click, improving user experience and accessibility.
Dashboard Sheet Tab
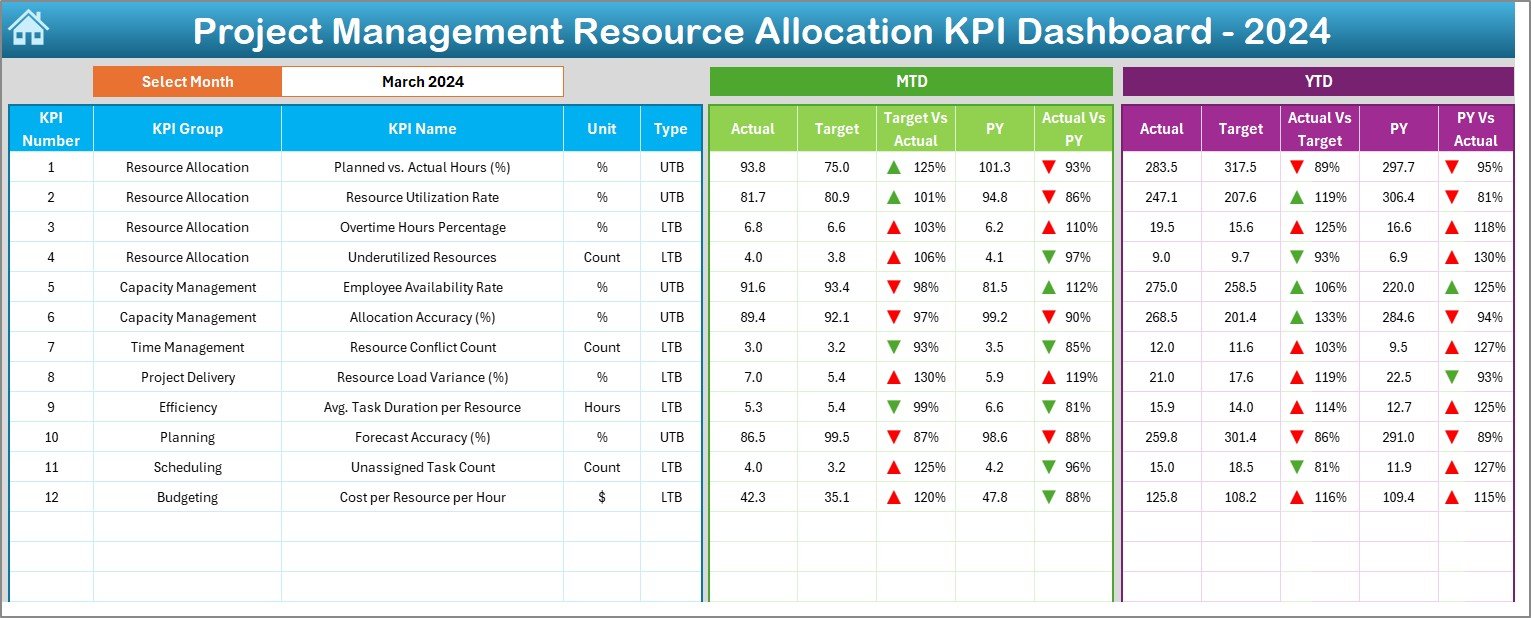
The heart of the KPI Dashboard, this worksheet provides a comprehensive view of all KPIs. Key features include:
- A drop-down (Cell D3) to select a month, updating all KPIs automatically.
- Clear visibility of Month-to-Date (MTD) and Year-to-Date (YTD) actual figures, targets, and previous year’s data.
- Conditional formatting with intuitive up and down arrows highlighting performance against targets and past performance.
KPI Trend Sheet Tab
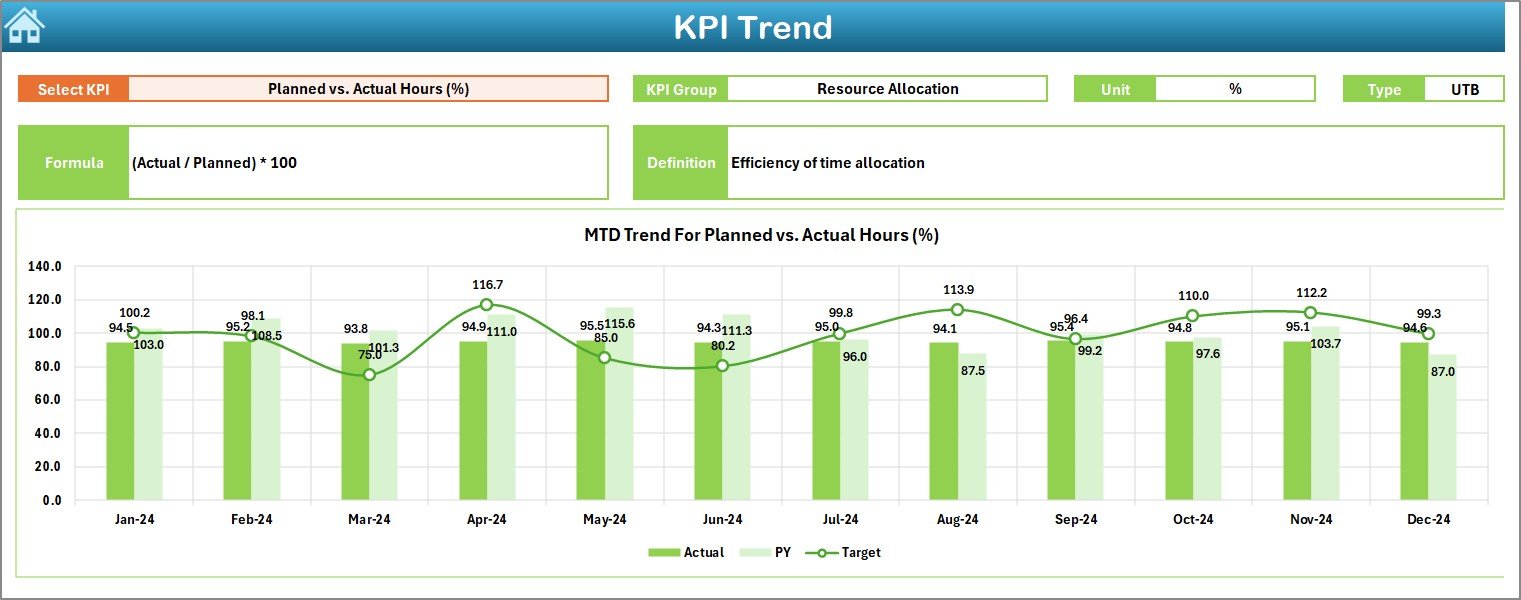
This sheet provides a deeper analysis of individual KPIs:
- Selection of KPIs through a user-friendly drop-down (Cell C3).
- Display of KPI Group, Unit, KPI type (Lower the Better or Upper the Better), KPI Formula, and Definition.
- Trend charts showing MTD and YTD trends comparing actual, target, and previous year numbers.
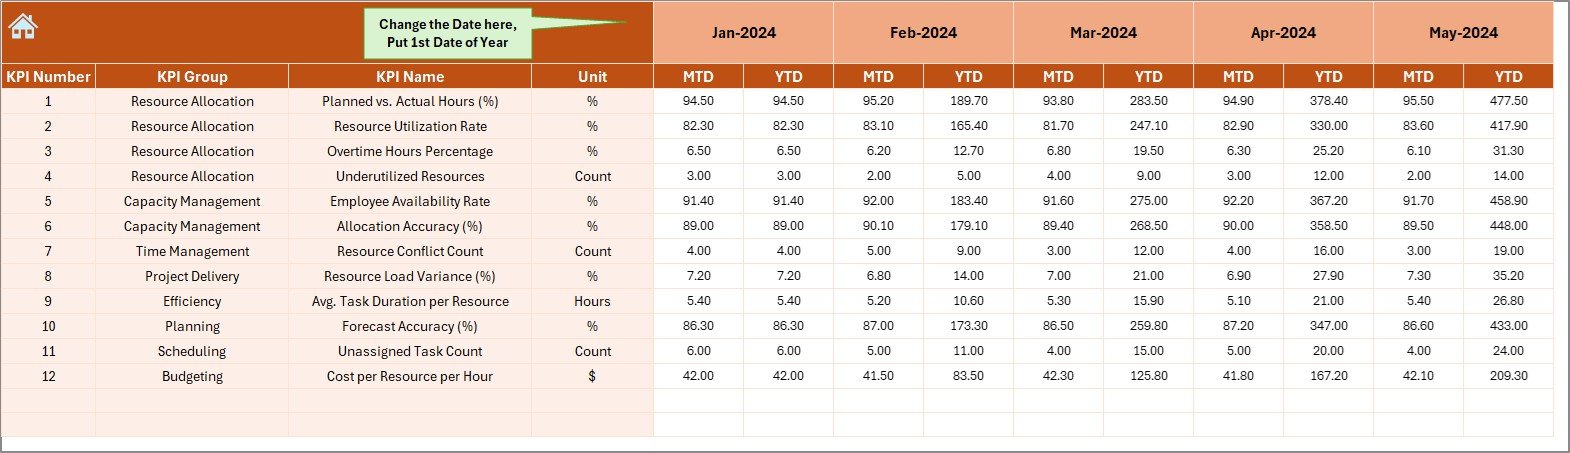
Actual Numbers Input Sheet
Click to Purchases Project Management Resource Allocation KPI Dashboard in Excel
Efficiently track resource allocation by:
- Entering actual data for each KPI on a monthly (MTD) and cumulative (YTD) basis.
- Adjusting months effortlessly by changing the initial month on cell E1.
Target Sheet Tab
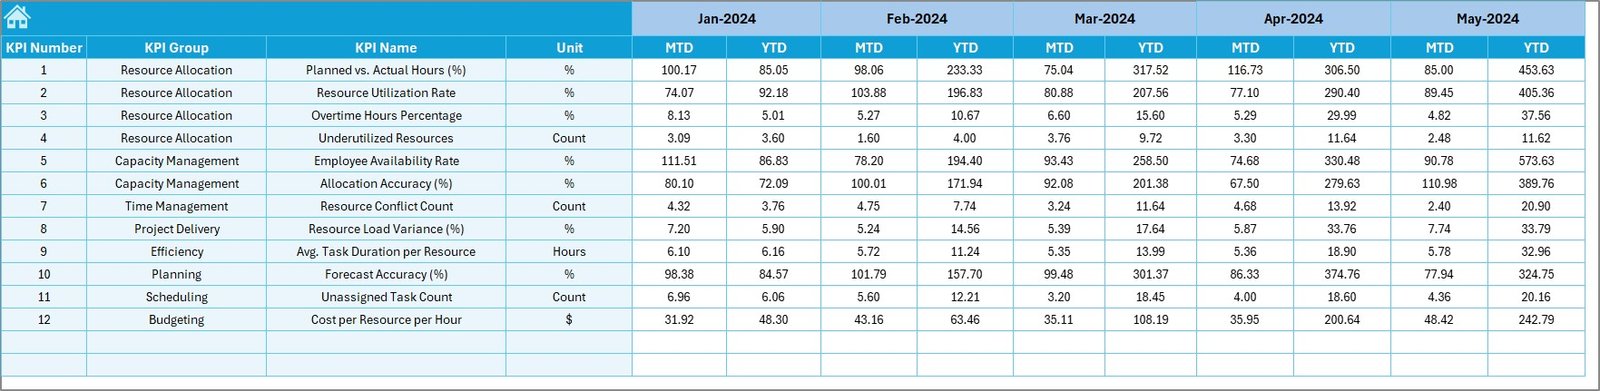
Setting clear targets is crucial for KPI measurement. Here, you can:
- Input monthly (MTD) and cumulative (YTD) targets for each KPI.
- Easily track your progress against predefined goals.
Previous Year Numbers Sheet Tab
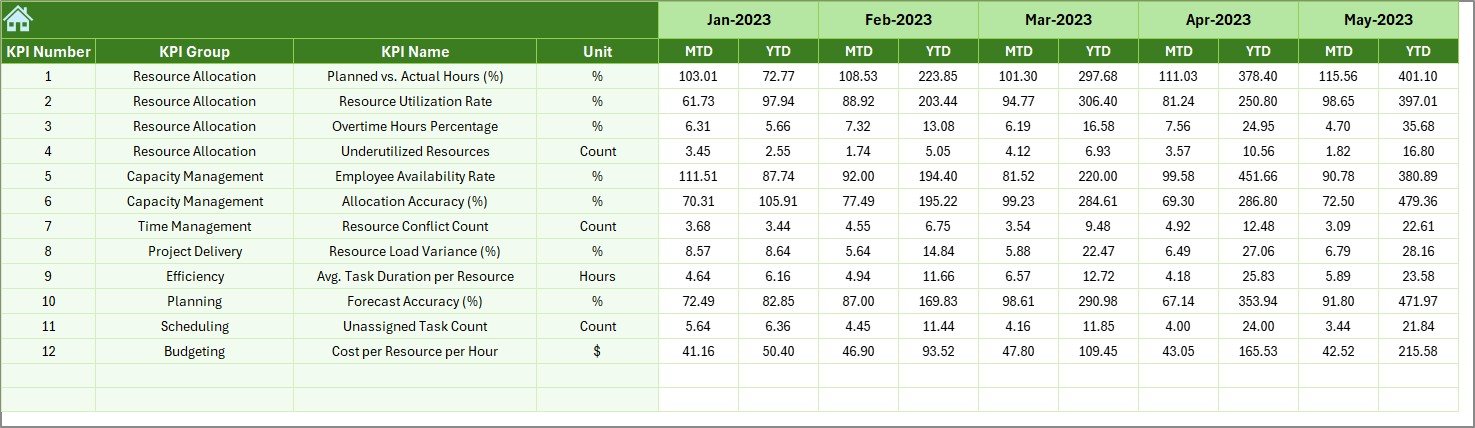
This worksheet ensures historical context for better decision-making:
- Enter previous year data aligning with current year structure.
- Facilitates accurate year-over-year comparisons.
KPI Definition Sheet Tab
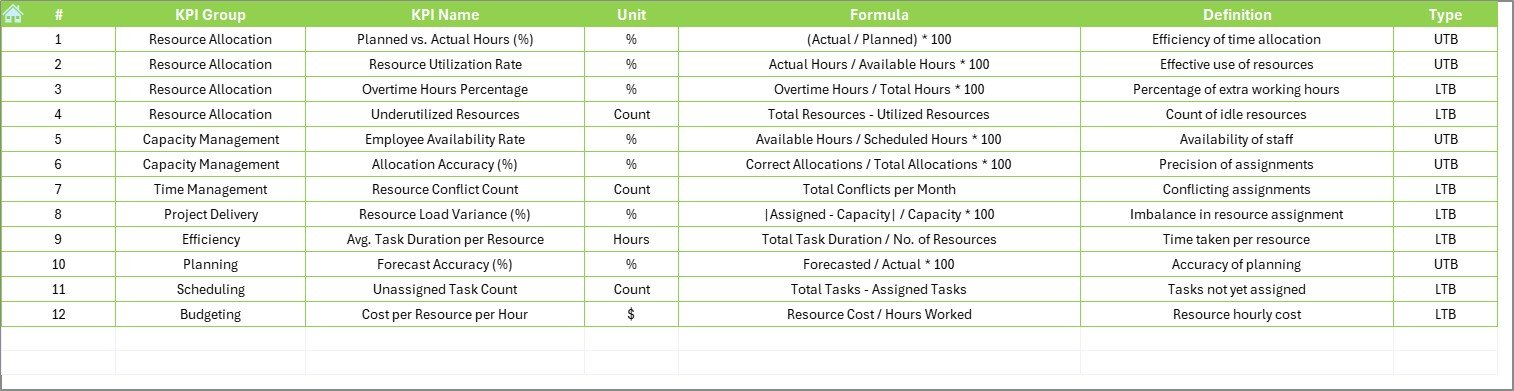
Maintain clarity and consistency across your project team by:
- Clearly defining each KPI with its name, group, unit, formula, and explanation.
- Serving as a reference guide for consistent data entry and interpretation.
Advantages of Using Project Management Resource Allocation KPI Dashboard
Implementing this dashboard offers several key advantages:
- Improved Resource Visibility: Real-time insights into resource allocation enhance decision-making and prevent bottlenecks.
- Enhanced Efficiency: Quickly identify underutilized or overburdened resources, optimizing productivity.
- Simplified Reporting: Streamlined dashboards make complex data easy to interpret and share with stakeholders.
- Proactive Management: Early detection of issues through clear KPI trends facilitates proactive problem-solving.
- Better Strategic Alignment: Ensures resources are aligned strategically with project objectives and organizational goals.
Best Practices for Project Management Resource Allocation KPI Dashboard
To fully benefit from this dashboard, adopt these best practices:
Regularly Update Data
- Keep actuals and targets current to reflect accurate real-time insights.
Define Clear KPIs
- Use the KPI Definition Sheet consistently to maintain clarity across your team.
Monthly Reviews
- Conduct regular monthly reviews of KPI performance to identify trends and adjust resource allocations accordingly.
Training and Familiarization
- Ensure your team is well-trained on how to use and interpret the dashboard effectively.
Leverage Historical Data
- Always refer to previous year numbers to provide context and inform decision-making processes.
How to Use Project Management Resource Allocation KPI Dashboard Effectively?
Follow these straightforward steps to maximize your dashboard usage:
- Enter KPI definitions clearly in the KPI Definition sheet.
- Input your monthly and cumulative targets into the Target sheet.
- Regularly update the Actual Numbers Input sheet with the latest figures.
- Review the Dashboard sheet monthly to track performance.
- Analyze trends from the KPI Trend sheet to guide resource reallocation decisions.
Conclusion
The Project Management Resource Allocation KPI Dashboard in Excel provides a comprehensive, user-friendly solution for managing resources effectively. By leveraging its clear visualizations, intuitive navigation, and detailed analysis capabilities, project managers can significantly enhance project outcomes and strategic alignment.
Frequently Asked Questions with Answers
Q1: What is a Resource Allocation KPI?
A resource allocation KPI measures how effectively project resources such as staff, tools, and budgets are being utilized against predefined goals.
Q2: Can I customize this dashboard?
Yes, this Excel-based dashboard is fully customizable to meet the specific needs of your projects or organization.
Q3: How frequently should the dashboard be updated?
Ideally, update the dashboard monthly or more frequently if your project demands real-time data monitoring.
Q4: Who should use the Project Management Resource Allocation KPI Dashboard?
Project managers, team leaders, and anyone responsible for managing project resources will find this dashboard invaluable.
Q5: Is training required to use the KPI dashboard effectively?
Minimal training might be beneficial for users unfamiliar with Excel dashboards. However, the dashboard is designed for intuitive use and requires minimal training for most users.
Click to Purchases Project Management Resource Allocation KPI Dashboard in Excel
Visit our YouTube channel to learn step-by-step video tutorials
Watch the step-by-step video Demo: