In the fast-paced construction industry, managing projects, budgets, safety, and progress is crucial for ensuring smooth operations and timely delivery. A Construction Dashboard in Excel is a powerful tool designed to provide real-time insights into key project metrics, helping construction managers, project leads, and contractors stay on top of project progress and costs.
This article explains the features, benefits, and functionalities of the Construction Dashboard in Excel, showcasing how this ready-to-use tool can optimize your construction operations and improve decision-making.
What is a Construction Dashboard in Excel?
A Construction Dashboard in Excel is an interactive tool that aggregates and visualizes critical data related to construction projects. It helps project managers and stakeholders track the performance of multiple projects, monitor budget vs. cost, evaluate safety incidents, and assess progress across different project phases, regions, and departments.
The dashboard is built using various sheets, each focused on a specific aspect of project management. With built-in charts, slicers, and cards, users can quickly gain insights into their projects’ performance and take informed actions. Excel’s dynamic features such as pivot tables and slicers make this dashboard a flexible and easy-to-update tool.
Key Features of the Construction Dashboard
Click to buy Construction Dashboard in Excel
The Construction Dashboard in Excel is divided into multiple sheets, each dedicated to a particular aspect of project monitoring and management. Here’s a breakdown of the dashboard’s components:
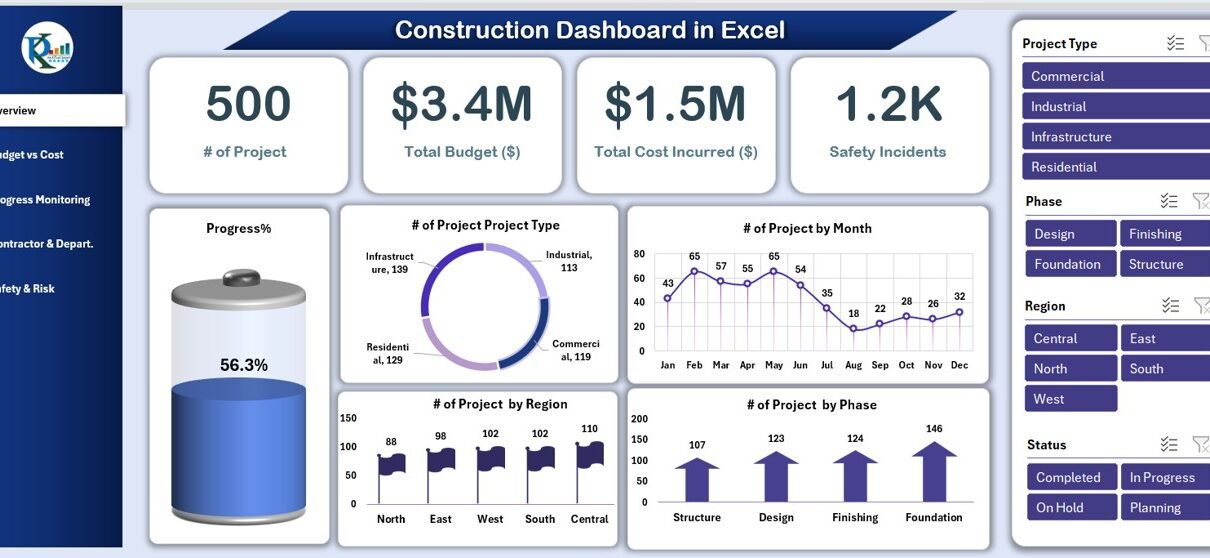
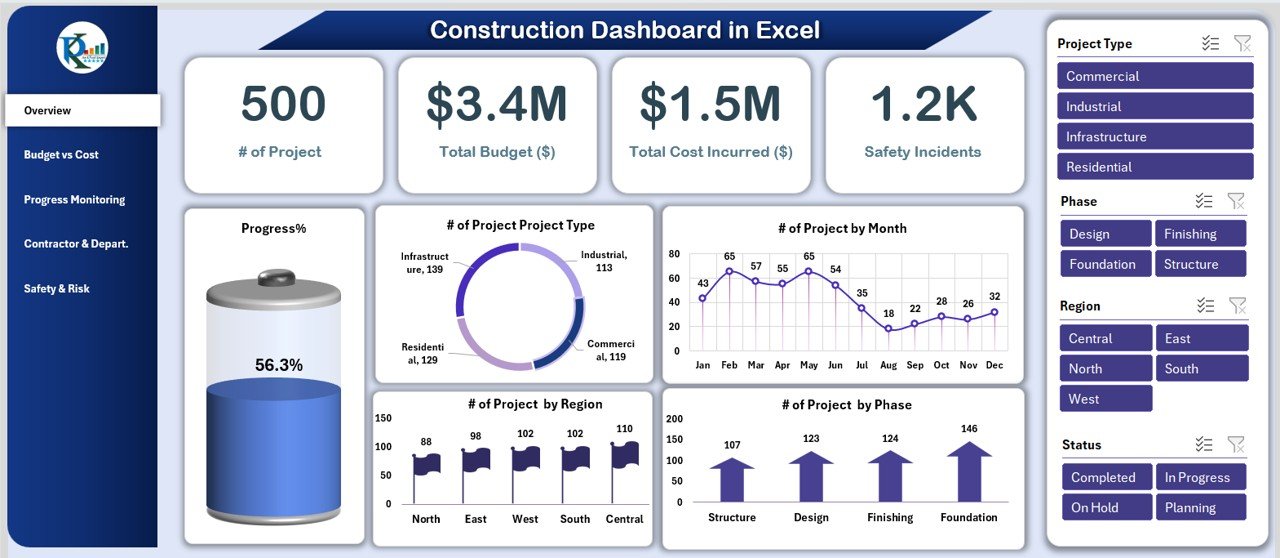
1. Overview Sheet Tab
The Overview Sheet provides a snapshot of all the ongoing projects. It includes key metrics and visualizations that allow users to track the overall status and progress of the construction projects.
Cards:
- # of Projects – Displays the total number of ongoing construction projects.
- Total Budget ($) – Shows the total allocated budget for all projects.
- Total Cost Incurred ($) – Displays the total costs incurred so far across all projects.
- Safety Incidents – Provides the number of safety incidents reported.
Charts:
- Progress % – A visual representation of the overall progress across all projects.
- # of Projects by Project Type – A chart showing the distribution of projects by their type (e.g., residential, commercial, etc.).
- # of Projects by Month – Tracks the number of projects initiated over the months.
- # of Projects by Region – Displays the distribution of projects across different regions.
- # of Projects by Phase – Visualizes the number of projects in each phase (e.g., planning, construction, completion).
Click to buy Construction Dashboard in Excel
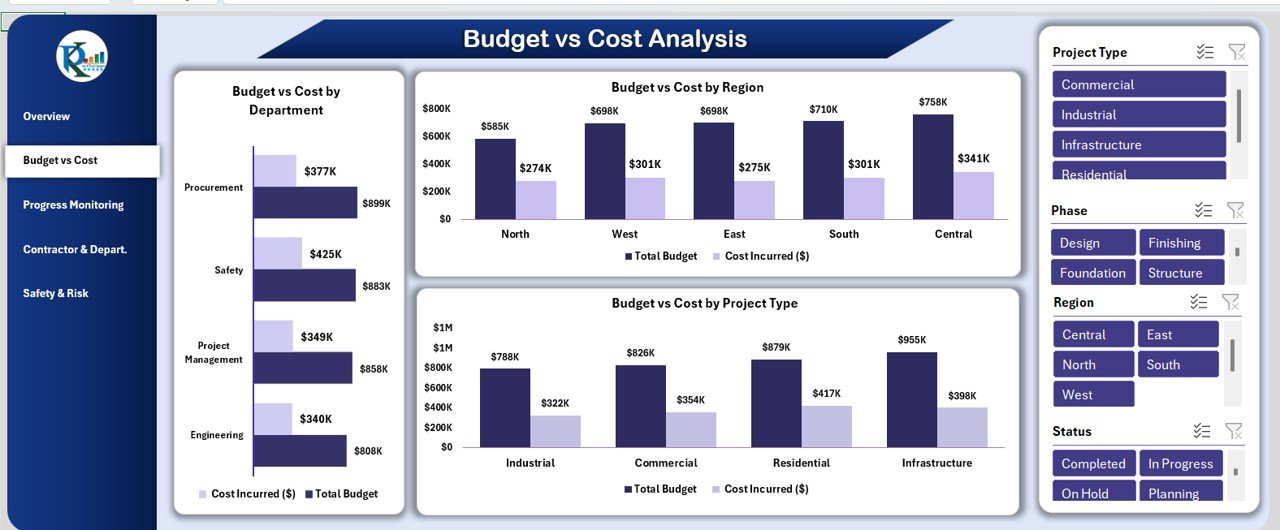
2. Budget vs Cost Sheet Tab
The Budget vs Cost Sheet compares the allocated budget with the actual costs incurred, helping to identify budget overruns or savings.
Charts:
- Budget vs Cost by Department – Compares the budget and costs for different departments involved in the construction projects.
- Budget vs Cost by Region – Displays the budget and costs by geographical region.
- Budget vs Cost by Project Type – Compares the budget and costs based on the project types.
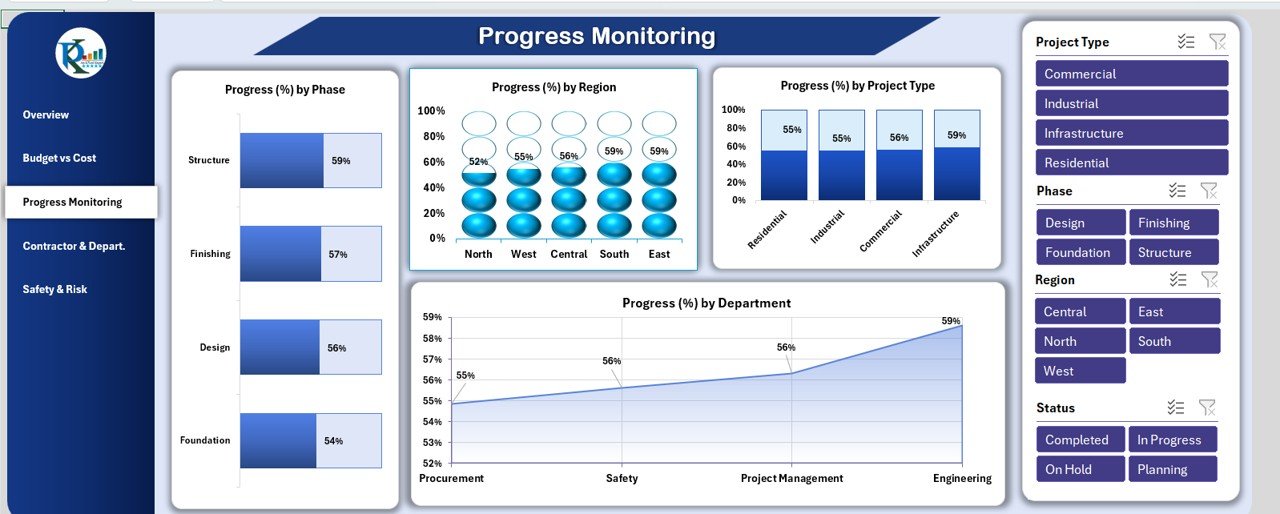
3. Progress Monitoring Sheet Tab
This tab is focused on monitoring the progress of projects across various categories, helping ensure that each project stays on track.
Charts:
- Progress (%) by Phase – Shows the progress percentage of projects based on their phases.
- Progress (%) by Region – Displays the progress of projects in different regions.
- Progress (%) by Project Type – Tracks the progress of various types of construction projects.
- Progress (%) by Department – Displays progress across different departments involved in the projects.
Click to buy Construction Dashboard in Excel
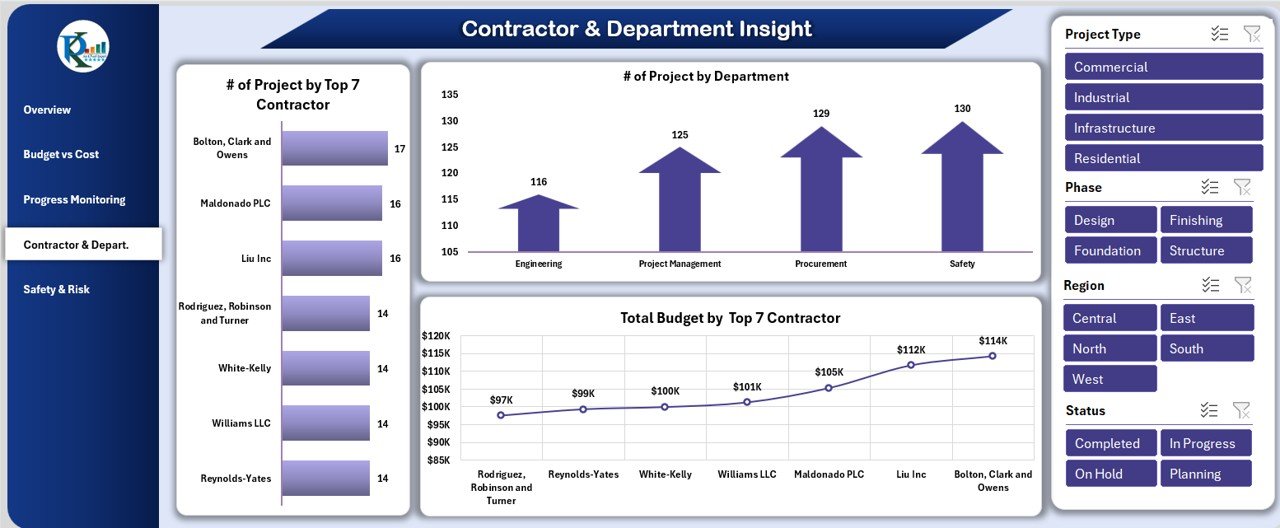
4. Contractor & Department Sheet Tab
This section tracks contractor performance and departmental involvement in the projects.
Charts:
- # of Projects by Top 7 Contractors – Displays the number of projects handled by the top seven contractors.
- # of Projects by Department – Shows the number of projects managed by each department.
- Total Budget by Top 7 Contractors – Displays the total budget allocated to the top seven contractors.
5. Safety & Risk Sheet Tab
The Safety & Risk Sheet tracks the safety performance and incidents across projects, which is crucial in the construction industry.
Charts:
- Total Safety Incidents by Department – Displays the total number of safety incidents by department.
- Total Safety Incidents by Region – Shows the total safety incidents across different regions.
- Total Safety Incidents by Project Type – Tracks safety incidents categorized by the type of projects.

Click to buy Construction Dashboard in Excel
6. Data Sheet Tab
The Data Sheet serves as the input sheet where all project data is entered. This data is then used to generate all the charts and reports in the dashboard.

Click to buy Construction Dashboard in Excel
Advantages of the Construction Dashboard in Excel
The Construction Dashboard in Excel offers several advantages for construction project management:
- Real-Time Monitoring: The dashboard allows real-time tracking of key metrics like project progress, budget vs. cost, and safety incidents, helping project managers take timely corrective actions.
- Data-Driven Decision Making: With all project-related data centralized in one place, decision-makers can make informed decisions based on accurate and up-to-date information.
- Improved Project Management: By providing a comprehensive overview of project statuses, budgets, safety incidents, and progress, the dashboard helps project managers oversee multiple projects effectively.
- Better Resource Allocation: By analyzing the progress and budget performance of each project, the dashboard helps in optimizing the allocation of resources to maximize efficiency.
Opportunity for Improvement in the Construction Dashboard
While the Construction Dashboard in Excel is highly effective, there are always opportunities for improvement:
- Real-Time Data Integration: Integrating the dashboard with project management software or real-time data sources like APIs could further enhance its accuracy and responsiveness.
- Advanced Predictive Analytics: Adding predictive analytics could help forecast potential delays, cost overruns, or safety incidents, allowing for proactive management.
- Customization for Specific Needs: Users could benefit from additional customization options, such as creating more specific charts or adding more KPIs to cater to unique construction project requirements.
Best Practices for Using the Construction Dashboard in Excel
Click to buy Construction Dashboard in Excel
To get the most out of the Construction Dashboard, follow these best practices:
- Ensure Data Accuracy: Keep the data entered in the Data Sheet tab accurate and up-to-date. This ensures that the charts and metrics reflect the real-time status of the projects.
- Monitor Key Metrics Regularly: Use the dashboard frequently to track metrics like budget vs. cost, project progress, and safety incidents. Regular monitoring helps identify potential issues early on.
- Optimize for Performance: As the number of projects grows, ensure the dashboard remains responsive by optimizing Excel for large datasets, such as using pivot tables and minimizing resource-heavy formulas.
- Collaborate and Share; Share the dashboard with stakeholders, contractors, and department heads to foster collaboration and ensure everyone is aligned on project progress and challenges.
Frequently Asked Questions (FAQs)
1. What is a Construction Dashboard in Excel?
A Construction Dashboard in Excel is a tool used to track and visualize important construction project metrics like progress, budget vs. cost, safety incidents, and resource allocation.
2. How can I update the dashboard with new project data?
Simply update the Data Sheet tab with the latest project information. Once updated, the charts and metrics will automatically refresh to reflect the new data.
3. Can I customize the Construction Dashboard for my specific needs?
Yes, you can customize the dashboard by adding new charts, modifying existing ones, or including additional KPIs specific to your construction projects.
4. Is the Construction Dashboard compatible with all Excel versions?
The dashboard is compatible with Excel 2016 and later versions. Make sure you have a version that supports slicers, pivot tables, and other advanced features.
Conclusion
Click to buy Construction Dashboard in Excel
The Construction Dashboard in Excel is an invaluable tool for managing construction projects. By providing real-time insights into project progress, budgets, safety, and resource allocation, this dashboard enables better decision-making and ensures that construction projects stay on track. By following best practices and exploring opportunities for improvement, the dashboard can continue to evolve and offer even greater value to construction professionals.
Visit our YouTube channel to learn step-by-step video tutorials
Click to buy Construction Dashboard in Excel