In today’s global economy, supply chains are becoming more complex, integrated, and regulated. Meeting regulatory standards across regions is not only essential for operational success but also for avoiding costly penalties and delays. That’s why a Supply Chain and Logistics Regulatory Adherence KPI Dashboard in Excel can be a game-changer for your operations.
This article will guide you through everything you need to know about this powerful dashboard tool—how it works, what makes it essential, best practices to follow, and how to make the most of it. Whether you’re a supply chain manager, analyst, or consultant, this Excel-based dashboard offers a reliable and practical way to monitor compliance KPIs in real-time.
Click to Purchases Supply Chain and Logistics Regulatory Adherence KPI Dashboard in Excel
What is a Supply Chain and Logistics Regulatory Adherence KPI Dashboard in Excel?
This dashboard is a ready-to-use Excel template designed to track regulatory adherence KPIs across your supply chain and logistics operations. From customs clearance time to audit pass rates, this tool brings all your critical compliance metrics into one centralized location.
It includes automated charts, slicers, conditional formatting, drop-down filters, and navigation buttons, making it both intuitive and efficient. With just a few clicks, you can monitor performance, compare with past records, and identify areas that need immediate attention.
Key Features of the Dashboard
This KPI dashboard is structured across 7 well-organized worksheets, each with a specific purpose:
Home Sheet

- Acts as the central index for the dashboard.
- Includes 6 navigation buttons to quickly access other sheets.
Dashboard Sheet

- The core of the template.
- Offers a drop-down (cell D3) to select any month.
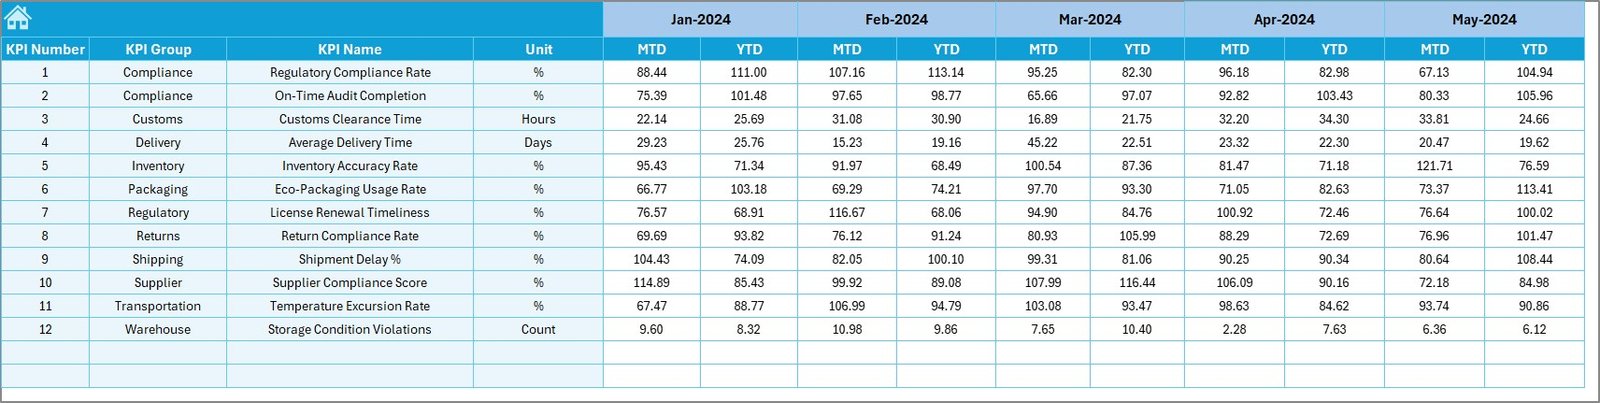
Displays:
- MTD (Month-To-Date) Actual vs Target vs Previous Year
- YTD (Year-To-Date) Actual vs Target vs Previous Year
- Visual indicators (up/down arrows) using conditional formatting for performance tracking.
Click to Purchases Supply Chain and Logistics Regulatory Adherence KPI Dashboard in Excel
KPI Trend Sheet

- Choose a KPI name from the drop-down list (cell C3).
- View the KPI Group, Unit, Type (LTB/UTB), Formula, and Definition.
- MTD and YTD charts show trends for Actual, Target, and PY data.
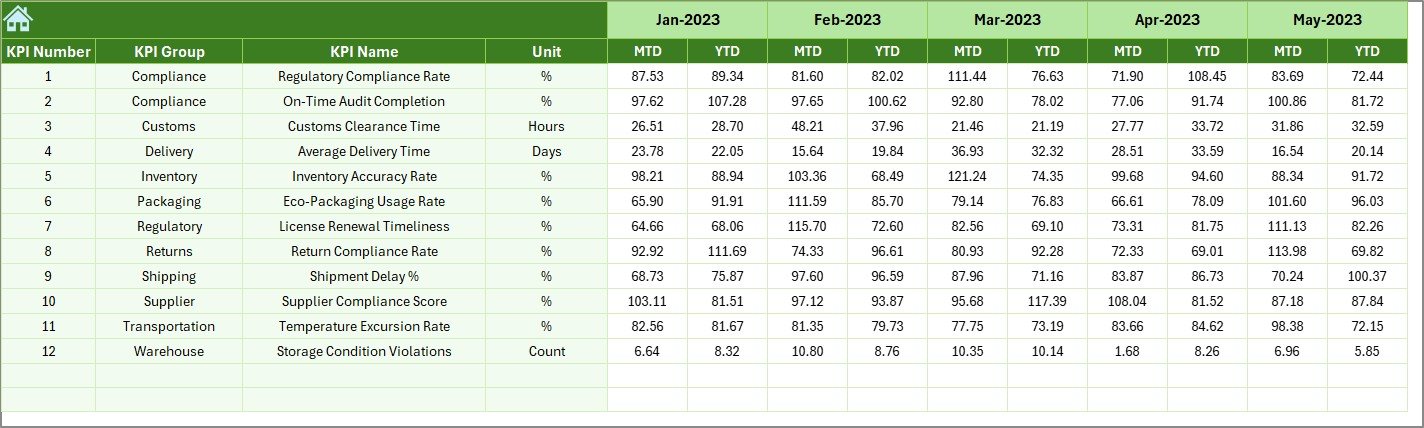
Actual Numbers Input Sheet

- Input actual MTD and YTD values here.
- Change the starting month of the year using cell E1.
Target Sheet
- Input the monthly Target values for each KPI.
- Includes both MTD and YTD fields.
Previous Year Numbers
- Input historical MTD and YTD data for the same KPIs.
- Allows year-over-year performance comparison.
Click to Purchases Supply Chain and Logistics Regulatory Adherence KPI Dashboard in Excel
KPI Definition Sheet
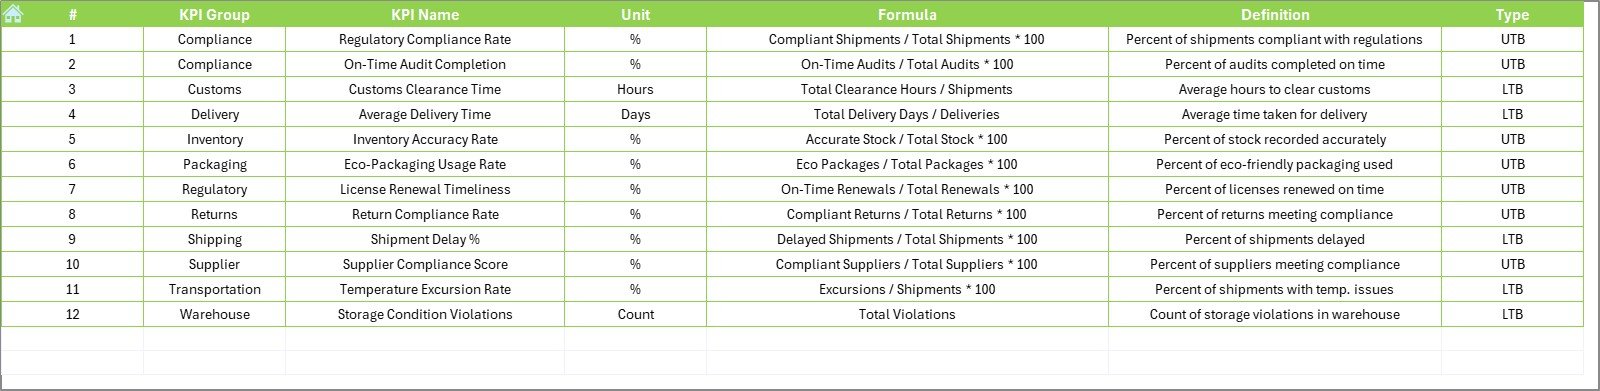
Maintain all KPI metadata like:
- KPI Name
- KPI Group
- Unit of Measurement
- Formula
- Definition
- Type (UTB/LTB)
Advantages of Using This Dashboard
✅ Real-Time Monitoring
You get instant updates when you input new data, which helps in tracking compliance at any moment.
✅ Visual Performance Comparison
With built-in conditional formatting, you can quickly see if your performance is on track.
✅ Historical Trends
The trend charts show how your regulatory adherence KPIs evolve over time, aiding long-term analysis.
✅ Zero Coding Required
You don’t need to write any Excel formulas or VBA code—the dashboard is ready to use.
✅ Customizable
You can easily add or remove KPIs, adjust layouts, or update formulas based on your organization’s needs.
Important KPIs Included
This dashboard typically tracks the following regulatory adherence KPIs:
- Customs Clearance Time (Hours)
- Number of Regulatory Violations
- % On-Time Compliance Submissions
- Audit Pass Rate (%)
- Corrective Actions Closed on Time
- Import/Export Documentation Accuracy (%)
- Product Recall Incidents
- Supplier Compliance Rate (%)
- Training Completion Rate (%)
- Transportation Safety Incidents
- Environmental Regulation Breaches
- Number of Detentions or Holds at Customs
Each of these KPIs falls under the UTB (Upper the Better) or LTB (Lower the Better) categories to guide decision-making.
How to Use the Dashboard
Step 1: Enter KPI Definitions
Start with the KPI Definition sheet. List out all your KPIs with units, formulas, and type.
Step 2: Fill in Previous Year Data
Go to the Previous Year Numbers sheet and input historical performance metrics for benchmarking.
Step 3: Input Targets
Update the Target Sheet with monthly targets for each KPI.
Step 4: Update Actuals
Use the Actual Numbers Input Sheet to feed in your current data.
Step 5: Analyze the Dashboard
Go to the Dashboard Sheet, pick a month, and analyze MTD and YTD trends.
Step 6: Deep Dive into KPI Trends
Visit the KPI Trend Sheet to explore individual KPI patterns.
Best Practices for Using This Dashboard
📊 Keep Data Updated Monthly
Consistency is key. Update your Actual, Target, and Previous Year data monthly to avoid gaps.
📊 Validate Data Sources
Ensure accuracy by pulling data from validated, audited sources only.
📊 Use KPI Definitions Uniformly
Standardize formulas and definitions to ensure everyone interprets KPIs the same way.
📊 Highlight Anomalies
Use conditional formatting or symbols (up/down arrows) to quickly identify outliers.
📊 Protect Input Sheets
Lock cells that users shouldn’t modify to maintain data integrity.
📊 Backup Regularly
Make periodic backups to avoid accidental data loss.
Why Choose Excel for Regulatory KPI Tracking?
Many wonder why Excel still stands strong despite the rise of BI tools. Here’s why:
- Accessibility: Everyone has Excel.
- Ease of Use: No steep learning curve.
- Customizable: Add features like slicers, pivot tables, and charts without code.
- Offline Availability: No internet needed to operate.
- Integration: Easily pull data from CSV, databases, and ERP systems.
Conclusion
Managing compliance across the supply chain requires careful tracking and constant evaluation. The Supply Chain and Logistics Regulatory Adherence KPI Dashboard in Excel offers an efficient, flexible, and cost-effective solution to do just that. With well-organized tabs, powerful visuals, and automated insights, this dashboard empowers decision-makers to act fast and stay compliant.
Don’t let compliance tracking become a burden. Use this Excel dashboard and turn regulatory adherence into a competitive advantage.
Frequently Asked Questions (FAQs)
1. Can I add more KPIs to the dashboard?
Yes, the dashboard is fully customizable. Just update the KPI Definition sheet and reflect changes in the input sheets.
2. Do I need Excel VBA to use this dashboard?
No VBA is required. Everything is done using Excel formulas, slicers, and conditional formatting.
3. What versions of Excel are supported?
The dashboard works best on Excel 2016 or later due to chart and slicer features.
4. Can I use this for industries other than supply chain?
Yes. While it’s designed for supply chain and logistics, you can repurpose it for other domains by adjusting the KPIs.
5. Is this dashboard suitable for large enterprises?
Yes. It suits both SMEs and large enterprises. For massive datasets, consider linking Excel with Power BI or Access.
Click to Purchases Supply Chain and Logistics Regulatory Adherence KPI Dashboard in Excel
Visit our YouTube channel to learn step-by-step video tutorials