Influencer marketing has become one of the most effective ways for brands to grow awareness, drive engagement, and boost sales. However, measuring the true success of influencer campaigns can be tricky without the right tools. That’s where the Influencer Marketing KPI Dashboard in Power BI steps in. This ready-to-use dashboard is designed to help marketing teams, agencies, and brand managers visualize performance in real time, track trends, and optimize decision-making using data from a simple Excel file.
Let’s dive into this complete guide where you’ll discover how the dashboard works, its structure, key benefits, and the best practices to get the most out of it.
Click to Purchases Influencer Marketing KPI Dashboard in Power BI
What is the Influencer Marketing KPI Dashboard in Power BI?
The Influencer Marketing KPI Dashboard in Power BI is a powerful business intelligence tool built using Microsoft Power BI Desktop. It connects to an Excel file to display key performance indicators (KPIs) for influencer campaigns across multiple timeframes.
It tracks both Month-to-Date (MTD) and Year-to-Date (YTD) numbers, comparing them with targets and previous year benchmarks. This allows you to get a 360-degree view of how your influencer strategy is performing.
Key Features of the Dashboard
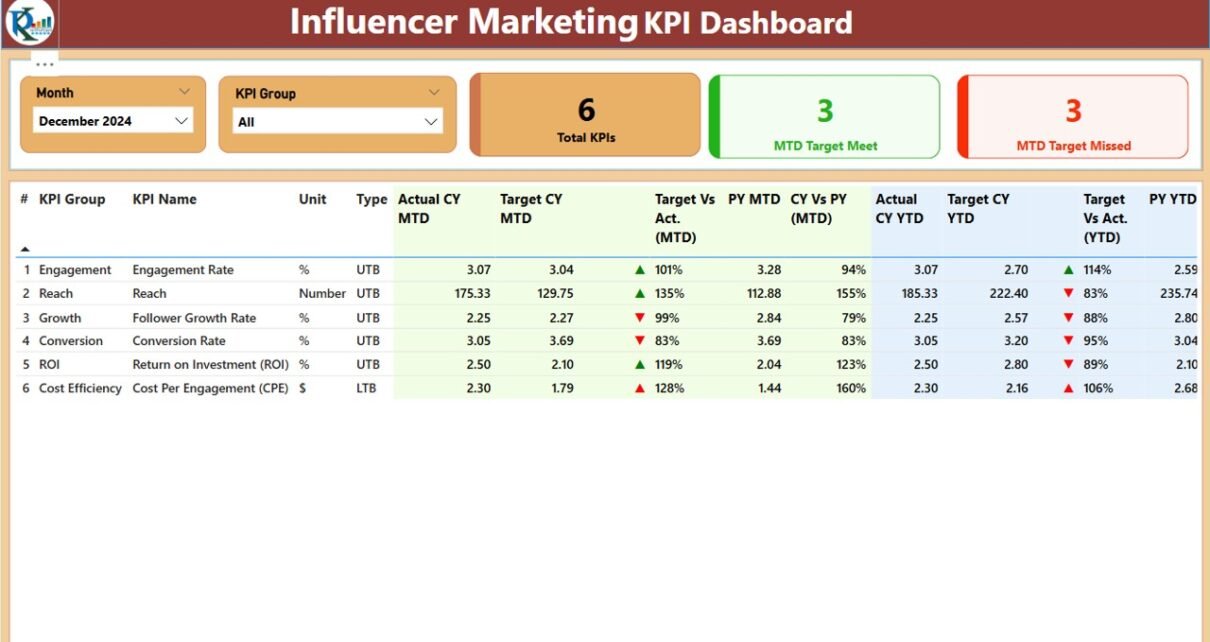
The dashboard is structured into three main pages, each offering a unique insight:
Summary Page
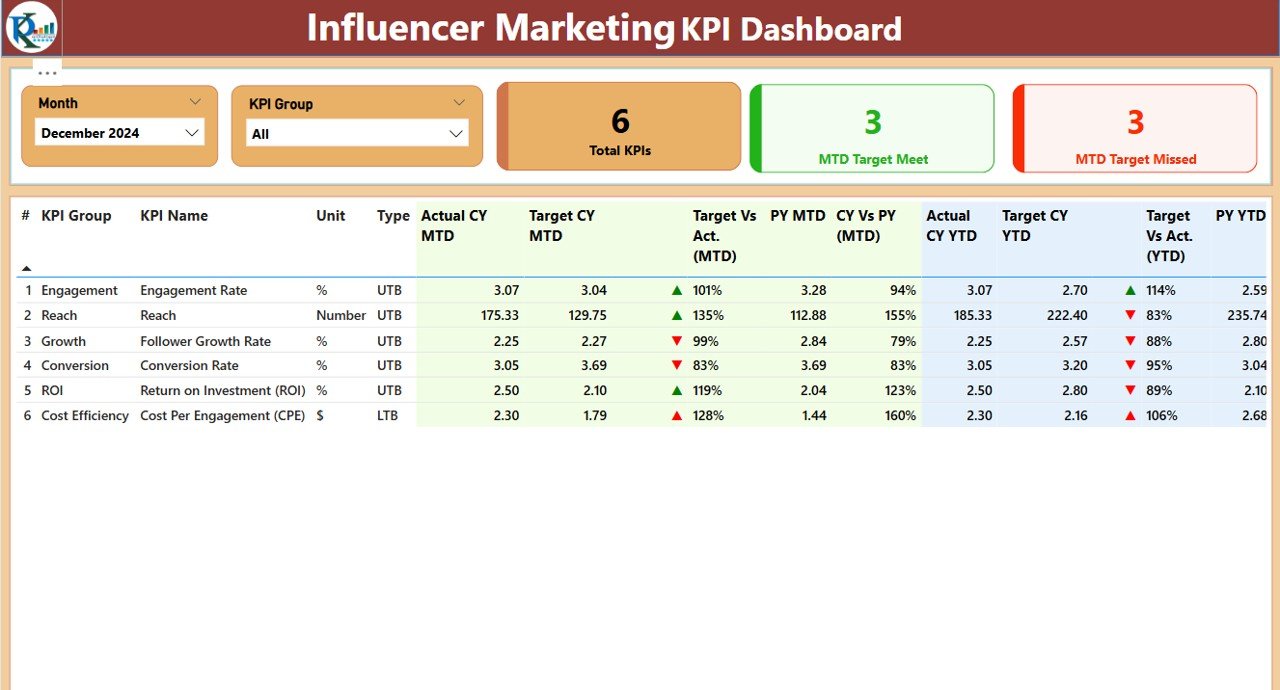
This is the core of the dashboard. It gives you a high-level overview of performance.
Top Section Includes:
- Month Selector: Choose the month for analysis.
- KPI Group Slicer: Filter KPIs by category.
Cards:
- Total KPI Count
- MTD Target Met Count
- MTD Target Missed Count
Detailed Table Includes:
- KPI Number: Sequence identifier for each KPI.
- KPI Group: Category (e.g., Engagement, Reach).
- KPI Name: Specific performance metric.
- Unit: Measurement unit (e.g., %, count).
- Type: KPI type – LTB (Lower the Better) or UTB (Upper the Better).
- Actual CY MTD & YTD: Current Year performance.
- Target CY MTD & YTD: Current Year goals.
- MTD & YTD Icons: Arrows (green/red) indicating performance vs. target.
- Target vs Actual % (MTD & YTD): Shows how well you are meeting targets.
- PY MTD & YTD: Previous year numbers for comparison.
- CY vs PY % (MTD & YTD): Highlights improvement or decline from last year.
KPI Trend Page
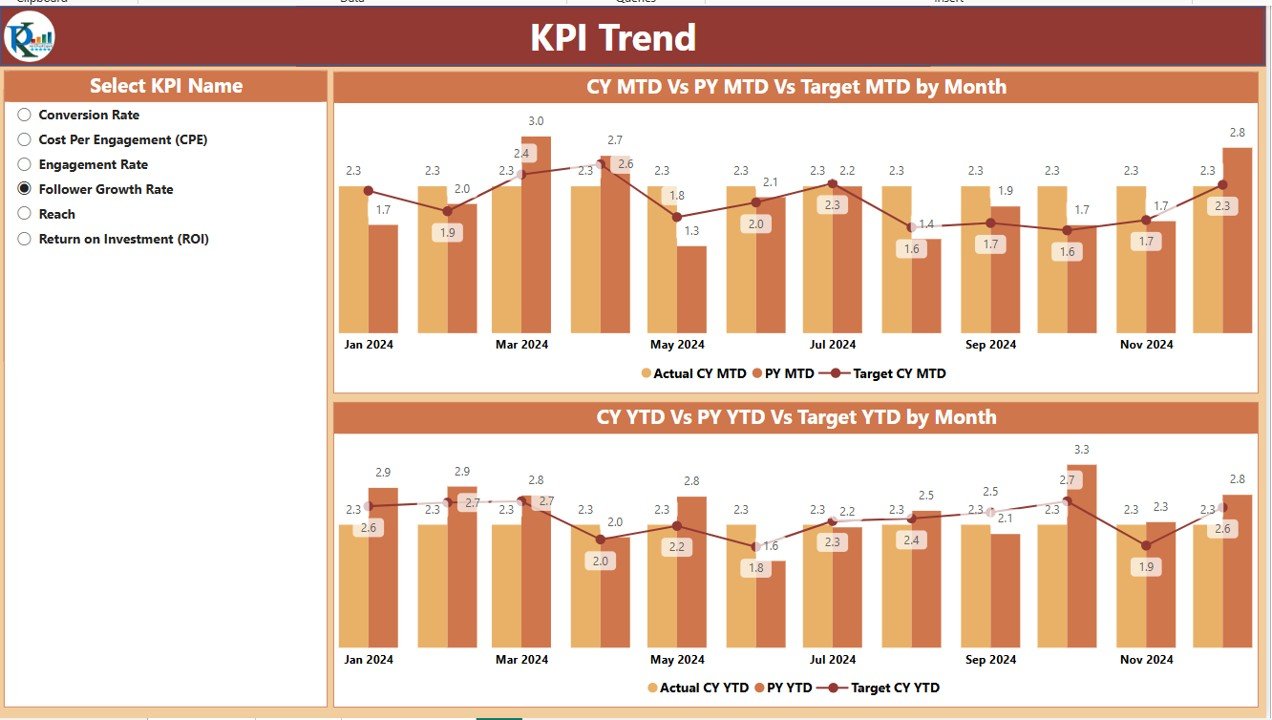
This page helps visualize performance over time with two combination charts:
- MTD Chart: Displays Actual vs Target vs Previous Year
- YTD Chart: Displays Actual vs Target vs Previous Year
Additional Feature: KPI selector slicer on the left side to focus on one KPI at a time.
Click to Purchases Influencer Marketing KPI Dashboard in Power BI
KPI Definition Page (Drill-through Page)
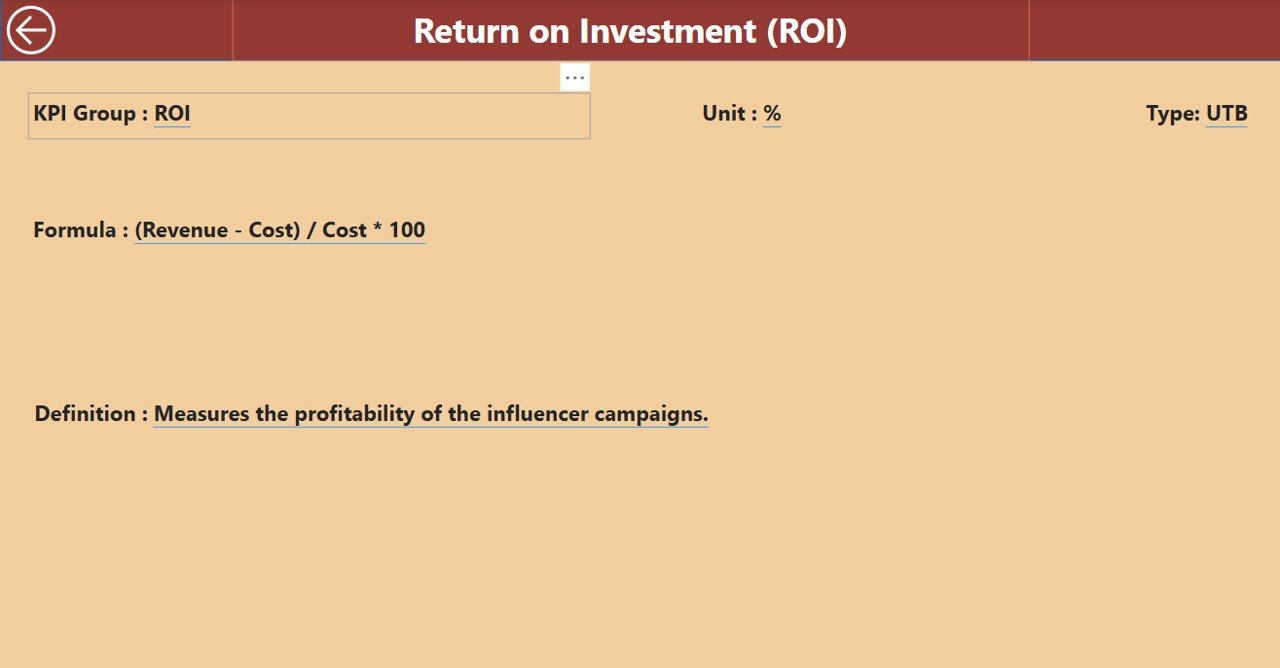
Hidden by default, this page can be accessed by drilling through from the summary table. It includes:
- KPI Number
- KPI Group
- KPI Name
- Unit
- Formula
- KPI Definition
- Type (LTB or UTB)
Navigation Tip: Click the back button (top-left) to return to the main summary page.
How the Excel Data Source Works
This dashboard runs on a structured Excel file. You just need to update three worksheets:
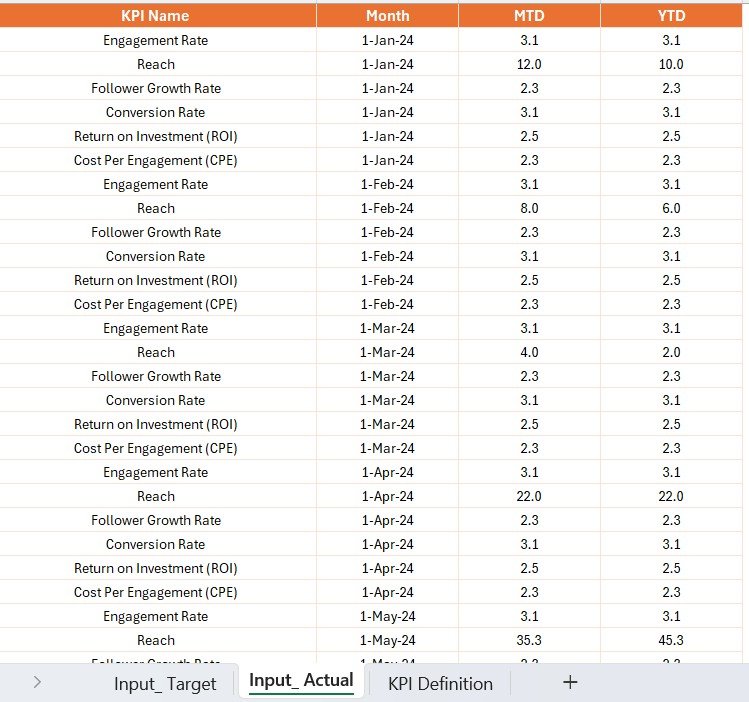
1. Input_Actual Sheet
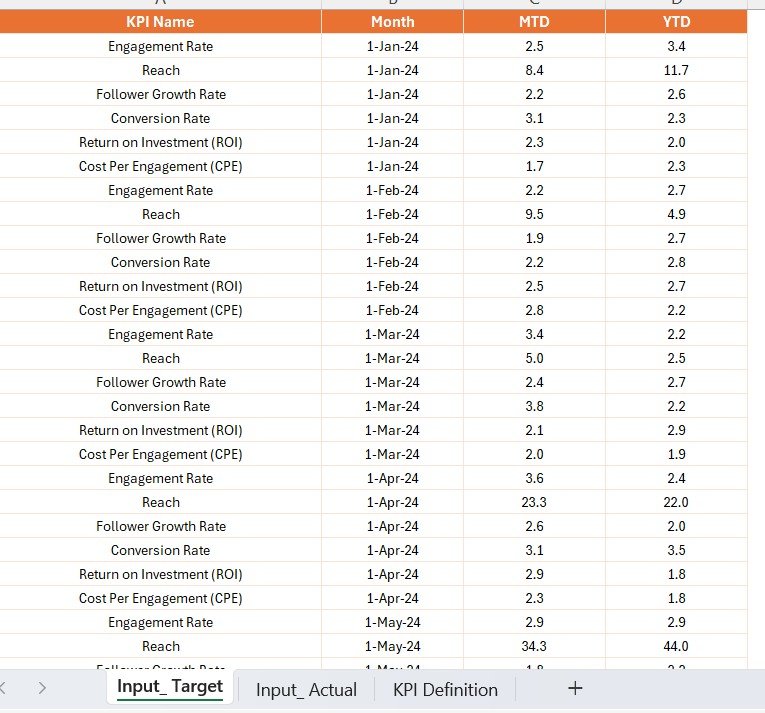
- Columns: KPI Name, Month (use first day of month), MTD Actual, YTD Actual
- Purpose: Capture actual performance numbers
2. Input_Target Sheet
- Columns: KPI Name, Month (use first day of month), MTD Target, YTD Target
- Purpose: Set monthly and yearly goals
3. KPI_Definition Sheet
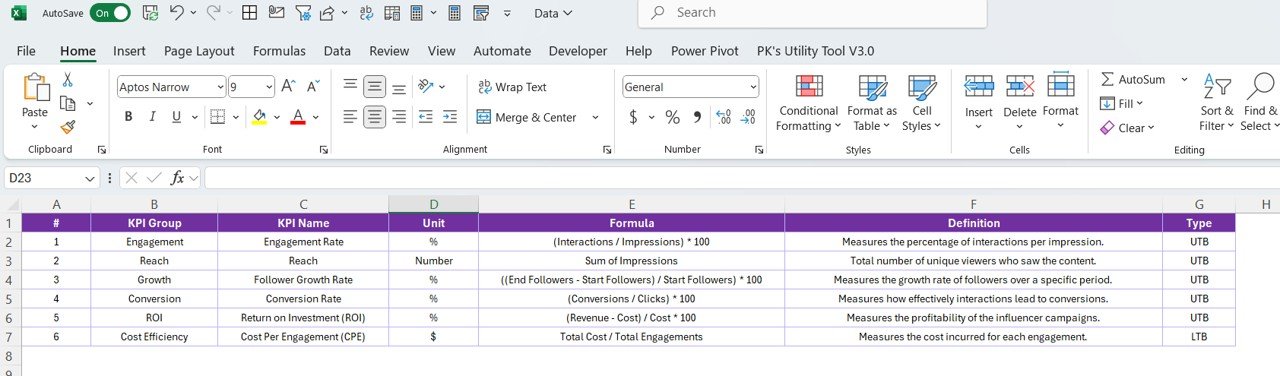
- Columns: KPI Number, KPI Group, KPI Name, Unit, Formula, Definition, Type
- Purpose: Define KPI logic and structure used in the dashboard
Advantages of Using the Influencer Marketing KPI Dashboard in Power BI
🔹 Real-Time Visibility
You get instant access to KPI performance with just a few clicks. No more waiting for monthly reports.
🔹 Simple Data Entry
Use Excel to update the actuals and targets. No need for coding or complex data connections.
🔹 Performance Comparison
Compare current numbers with last year’s and with your targets using automatic calculations and color-coded indicators.
🔹 Improved Decision Making
With clear visualizations and metrics, you can make faster and smarter marketing decisions.
🔹 Drill-Down Capabilities
Want to know why a metric is underperforming? Just drill into the KPI definition page for details.
Click to Purchases Influencer Marketing KPI Dashboard in Power BI
Best Practices for Using the Dashboard
1. Keep Data Up-to-Date
Regularly update the Excel sheets to reflect the latest actuals and targets. This ensures your dashboard stays accurate and meaningful.
2. Define KPIs Clearly
Make sure every KPI in the definition sheet has a clear formula, type (UTB or LTB), and concise explanation. This will help teams understand each metric.
3. Use Meaningful KPI Groups
Group related KPIs under categories like Engagement, Conversion, Reach, etc., for better filtering and segmentation.
4. Watch for Trends
Use the Trend Page regularly to identify any patterns or long-term shifts in performance.
5. Customize Visuals
Use Power BI’s flexibility to add your brand logo, customize color themes, or add more visuals if needed.
Why Power BI for Influencer Marketing?
Power BI is more than just a visualization tool. It allows dynamic filtering, slicing, and drill-throughs. For influencer marketing, where real-time data is key, Power BI stands out due to:
- Interactive visuals
- Ease of integration with Excel
- User-friendly interface for non-tech teams
- Speed in transforming raw data into insights
Conclusion
The Influencer Marketing KPI Dashboard in Power BI is a must-have tool for any marketing team looking to track performance efficiently. By connecting simple Excel inputs with powerful Power BI visuals, it brings both clarity and depth to your influencer marketing strategies. You can identify what’s working, what’s not, and where you need to act—all from one dashboard.
Frequently Asked Questions (FAQs)
Q1. Can I use this dashboard without technical knowledge?
Yes. As long as you can update an Excel sheet and open Power BI Desktop, you’ll find this dashboard easy to use.
Q2. How do I know if a KPI is performing well?
Check the green arrow icon (▲) beside the KPI for MTD and YTD. It means you’re meeting or exceeding the target.
Q3. Can I add more KPIs to the dashboard?
Absolutely. Just add new rows in the Excel file for actuals, targets, and definitions, then refresh the Power BI report.
Q4. Can this dashboard work with other data sources?
Yes, but this version is built for Excel. With a few tweaks, you can connect to SQL, Google Sheets, or APIs using Power BI.
Q5. What does UTB and LTB mean?
- UTB (Upper The Better): Higher value indicates better performance.
- LTB (Lower The Better): Lower value is preferred (e.g., bounce rate).
Click to Purchases Influencer Marketing KPI Dashboard in Power BI
Visit our YouTube channel to learn step-by-step video tutorials