In today’s world, corporate responsibility has become a major focus for organizations. More than ever, businesses are expected to contribute positively to society, the environment, and the economy. Corporate Social Responsibility (CSR) has thus become an essential part of any organization’s strategy. Measuring the success of CSR initiatives is critical for businesses to ensure that they are not only meeting their goals but also making a positive impact.
This article delves into the Corporate Social Responsibility KPI Dashboard in Power BI, a tool that helps businesses track, analyze, and optimize their CSR activities. This ready-to-use dashboard provides organizations with detailed insights into various CSR metrics, helping them stay on track with their sustainability, social, and ethical goals. Let’s explore how this dashboard works, its key features, best practices, and more!
Click to Purchases Corporate Social Responsibility KPI Dashboard in Power BI
What is a Corporate Social Responsibility KPI Dashboard?
A Corporate Social Responsibility KPI Dashboard in Power BI is a data-driven tool that provides real-time insights into an organization’s CSR performance. It helps companies track key performance indicators (KPIs) related to their CSR initiatives. These KPIs typically include social impact, environmental sustainability, and ethical governance. The dashboard leverages data visualizations to present these metrics clearly and concisely, empowering decision-makers to monitor, measure, and improve CSR performance.
The Power BI CSR dashboard is built to provide business leaders with insights into:
-
Environmental Impact: Tracking initiatives that reduce the company’s environmental footprint.
-
Social Impact: Measuring contributions to social causes, such as charitable donations or community engagement.
-
Governance: Assessing the ethical practices, transparency, and legal compliance of the organization.
By using Power BI, this dashboard brings together CSR data into one unified view that’s easy to interpret, share, and act upon.
Key Features of the Corporate Social Responsibility KPI Dashboard
Summary Page: The Heart of the Dashboard
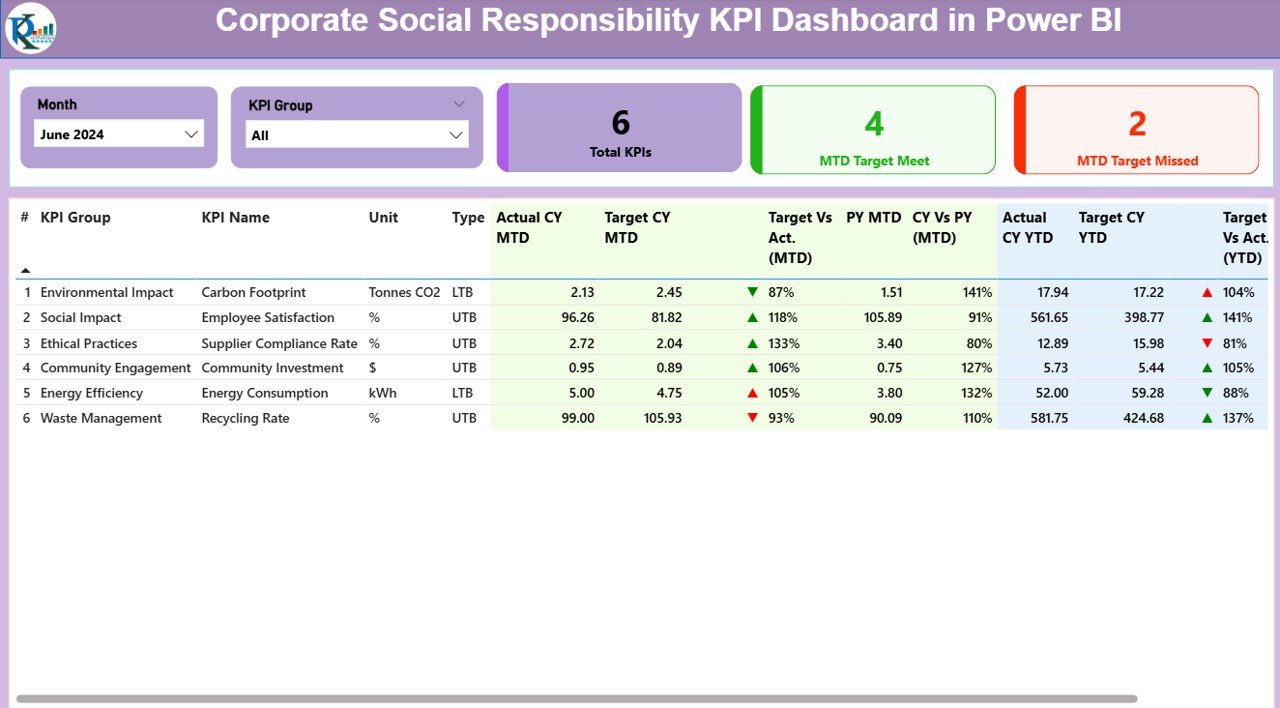
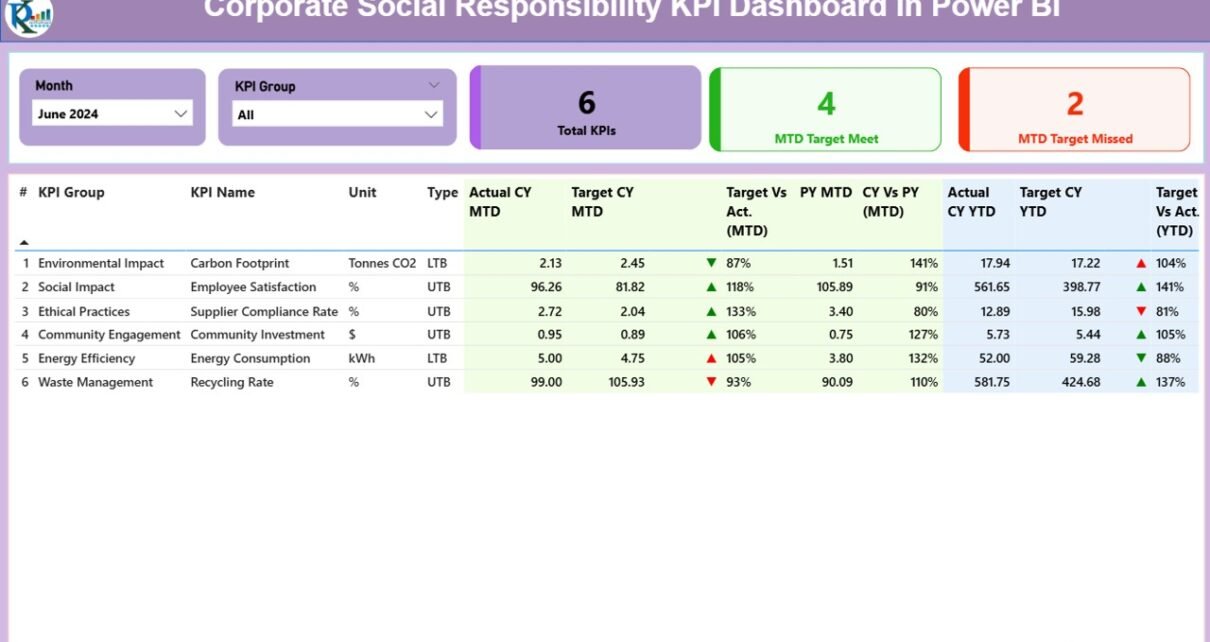
The Summary Page is the main hub of the CSR KPI dashboard, where you can track an array of KPIs, month-to-date (MTD) figures, and year-to-date (YTD) data. Here are the key elements displayed:
-
Slicers for Month and KPI Group: At the top, users can filter data by month and KPI group to focus on specific data sets.
KPIs Overview: The dashboard displays important KPI metrics like:
- Total KPIs Count
- MTD Target Met
- MTD Target Missed
Detailed Table: This table provides granular data for each KPI, including:
- KPI Number: Unique sequence number of each KPI.
- KPI Group: Category to which the KPI belongs (e.g., Environmental Impact, Social Responsibility).
- KPI Name, Unit, and Type: Name of the KPI, its measurement unit, and its type (Lower the Better – LTB or Upper the Better – UTB).
- Actual CY MTD and Target CY MTD: The actual values and targets for the current year’s month-to-date.
- Target vs. Actual (MTD): The percentage difference between the target and actual values.
- Previous Year MTD (PY MTD): Same metric from the previous year for comparison.
- YTD Metrics: Similar to the MTD metrics but for year-to-date.
- CY vs PY (YTD): A comparison between current year YTD and previous year YTD figures.
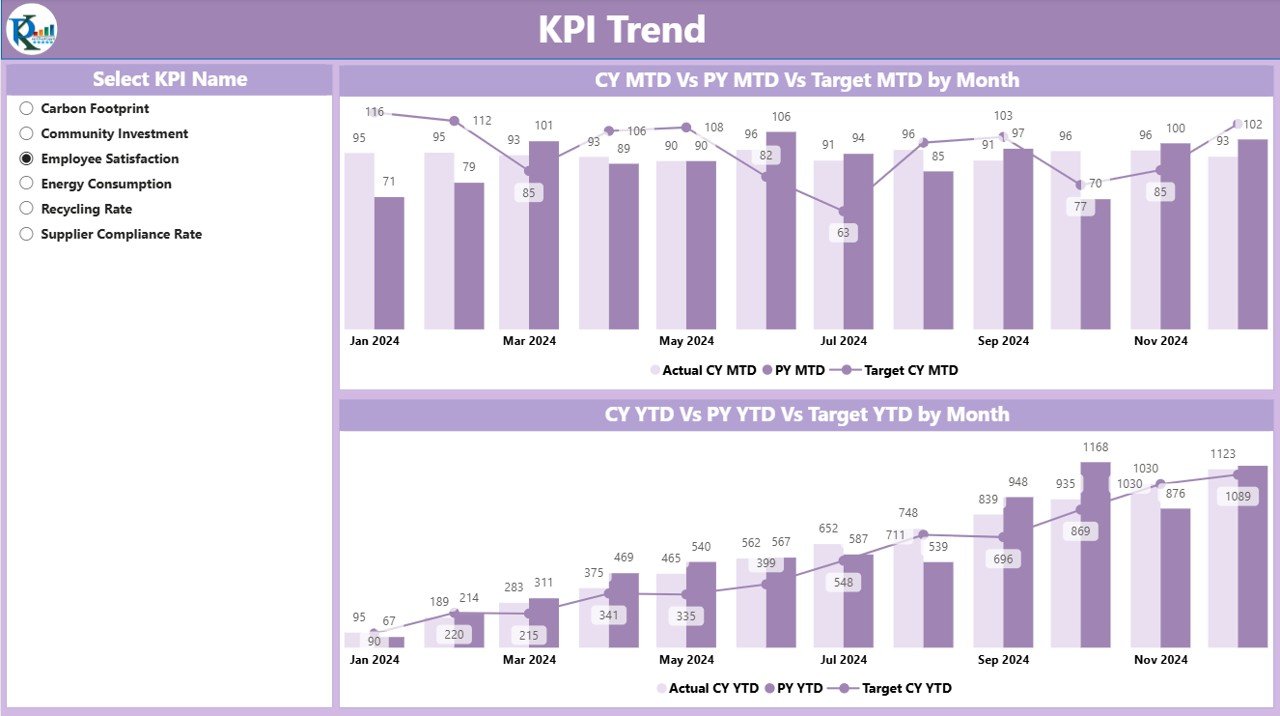
KPI Trend Page: Tracking Progress Over Time
The KPI Trend Page offers a detailed analysis of KPI performance trends, comparing actual numbers for the current and previous years, as well as target values.
-
Combo Charts: This page displays combo charts that visualize the Actual Numbers for both the current and previous years along with the targets for MTD and YTD periods.
-
Slicer for KPI Name: Users can filter data to view trends for specific KPIs, making it easier to track progress over time.
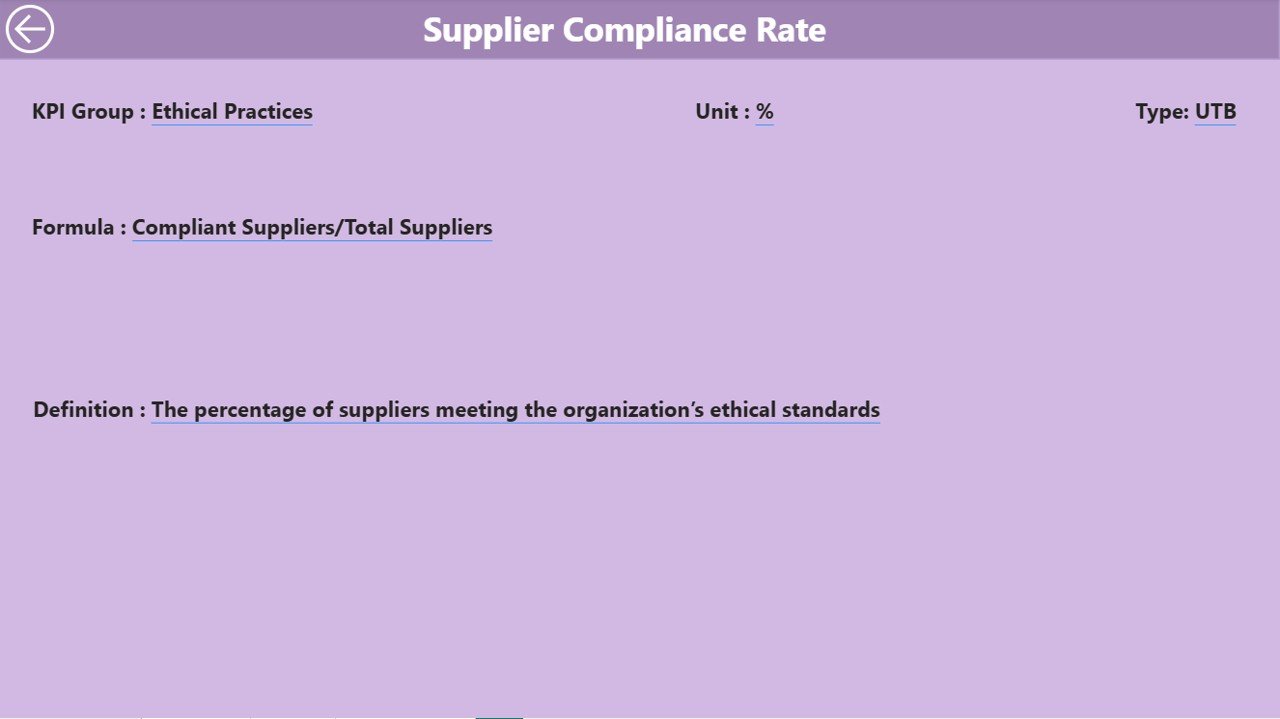
KPI Definition Page: Understanding Each Metric
The KPI Definition Page allows users to access detailed information about each KPI:
-
Drill-through Functionality: Users can click on any KPI in the summary page to view its detailed formula, unit of measurement, and definition.
-
Formula Explanation: This page shows how the KPI is calculated, which can help users understand the logic behind the data.
Excel Data Integration
The dashboard is linked to an Excel file, which serves as the data source. This Excel file has three key worksheets:
-
Input_Actual Sheet: Users fill in the actual data for each KPI (MTD and YTD).
-
Input_Target Sheet: Users enter the target values for the same KPIs.
-
KPI Definition Sheet: Users define the KPIs, including their names, units, formulas, and types.
Advantages of the Corporate Social Responsibility KPI Dashboard
-
Centralized Data View: All CSR performance metrics are brought together in one platform, making it easier to manage and track.
-
Real-Time Insights: The dashboard updates automatically, providing real-time data that helps businesses make informed decisions.
-
Comparative Analysis: The ability to compare current performance with previous years ensures that businesses can measure progress and identify areas for improvement.
-
Customizable: The slicers and drill-through options provide flexibility, allowing users to view data from different perspectives.
-
Actionable Visuals: With clear visualizations like combo charts and icons (green for positive performance and red for negative), users can quickly interpret performance and take necessary actions.
Click to Purchases Corporate Social Responsibility KPI Dashboard in Power BI
Best Practices for Using the CSR KPI Dashboard
-
Regular Updates: Make sure the data in your Excel sheets is regularly updated to ensure the dashboard reflects the latest metrics.
-
Data Accuracy: Ensure that the data entered into the Input_Actual and Input_Target sheets is accurate, as this directly affects the dashboard’s output.
-
Clear KPI Definitions: Define your KPIs clearly in the KPI Definition sheet to avoid confusion and ensure consistency across reporting periods.
-
Set Realistic Targets: Make sure that the target values for each KPI are achievable and aligned with your organization’s CSR goals.
-
Analyze Trends Regularly: Use the KPI Trend page to monitor changes over time, allowing you to adjust strategies as needed.
-
Leverage Drill-Through: Use the drill-through feature to access detailed information about each KPI and understand the underlying data behind each metric.
Frequently Asked Questions (FAQs)
1. What is the purpose of a Corporate Social Responsibility KPI Dashboard?
The purpose of a CSR KPI Dashboard is to provide a clear and detailed overview of an organization’s CSR activities, track key performance indicators (KPIs), and compare performance against targets to measure the effectiveness of CSR initiatives.
2. How can the dashboard help businesses improve CSR performance?
The dashboard allows businesses to monitor their CSR performance in real-time, compare current performance to past years, and identify areas that need improvement. This helps organizations take proactive actions to enhance their CSR efforts.
3. Can the dashboard be customized to fit the specific needs of different industries?
Yes, the dashboard is customizable. Businesses can define their KPIs, adjust target values, and select relevant data sets that are specific to their industry or CSR focus.
4. What types of KPIs can be tracked with this dashboard?
The CSR KPI dashboard can track various types of KPIs, including environmental impact, social contributions, governance, and ethical practices. Each KPI is defined based on the organization’s CSR goals.
5. How does the drill-through feature work?
The drill-through feature allows users to click on any KPI in the summary page to access more detailed information, such as its definition, formula, and historical data. This helps users gain a deeper understanding of each metric.
Conclusion
The Corporate Social Responsibility KPI Dashboard in Power BI is an indispensable tool for any organization committed to improving its CSR efforts. By tracking and analyzing CSR metrics in real-time, businesses can ensure that they are meeting their sustainability and social impact goals while maintaining a high level of ethical governance. With its user-friendly interface, detailed data visualizations, and powerful features like drill-through and trend analysis, this dashboard provides everything you need to monitor and improve your CSR initiatives.
Visit our YouTube channel to learn step-by-step video tutorials
Click to Purchases Corporate Social Responsibility KPI Dashboard in Power BI