Relocating an office is no small task. From planning budgets to monitoring task progress and tracking deadlines, every detail matters. A well-managed office relocation not only ensures minimal disruption to operations but also boosts employee morale and productivity in the new environment. However, without the right tools, it can be challenging to coordinate multiple teams, locations, and budgets.
The Office Relocation Dashboard in Excel is a ready-to-use, interactive template designed to help organizations plan, execute, and track their office relocation projects with accuracy and efficiency. This powerful tool centralizes all relocation data in one place, making it easier to manage progress, monitor costs, and ensure deadlines are met.
In this comprehensive guide, we will explore the features, benefits, and best practices of using this dashboard, along with practical tips for successful office relocation.
Click to Purchases Office Relocation Dashboard in Excel
What is an Office Relocation Dashboard in Excel?
An Office Relocation Dashboard in Excel is a data-driven project management tool that helps businesses oversee every stage of the relocation process. It integrates task tracking, budget management, departmental analysis, and monthly trends into a single interactive platform.
Instead of juggling multiple spreadsheets and project management tools, this dashboard consolidates all the important metrics into a visual, easy-to-navigate format. You can quickly identify delays, monitor budget variances, and ensure relocation tasks are completed on time.
Key Features of the Office Relocation Dashboard
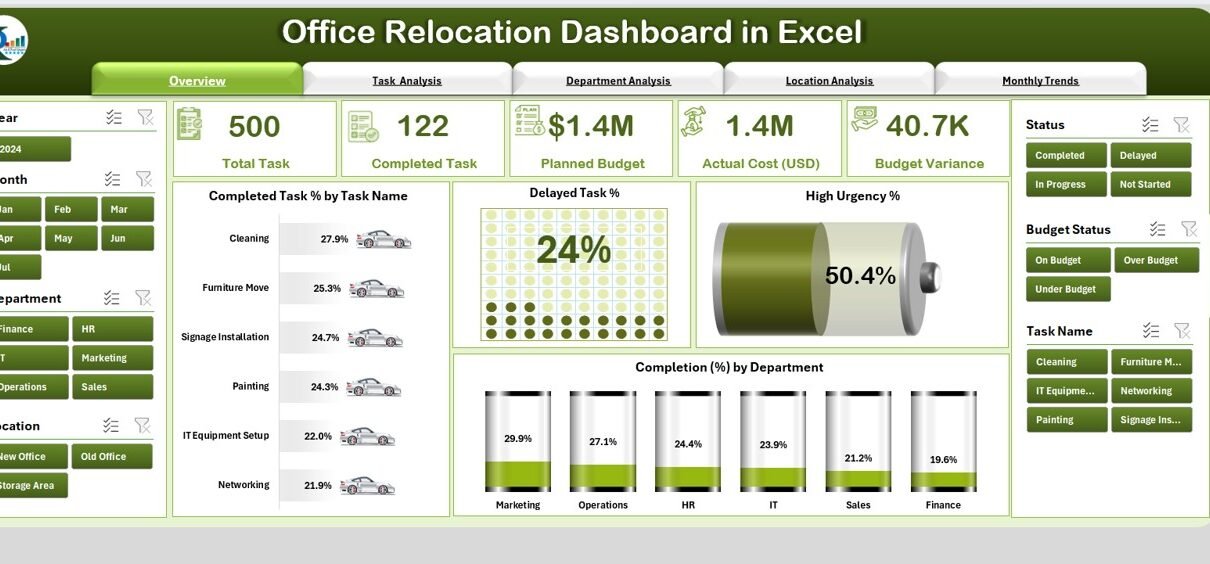
This dashboard is designed with usability in mind, featuring five analytical pages and built-in navigation to make tracking relocation progress simple.
Page Navigator
-
Located on the left side of the dashboard.
-
Allows you to switch between different analytical pages instantly.
-
Eliminates the need to scroll through large datasets or switch files.
Overview Page
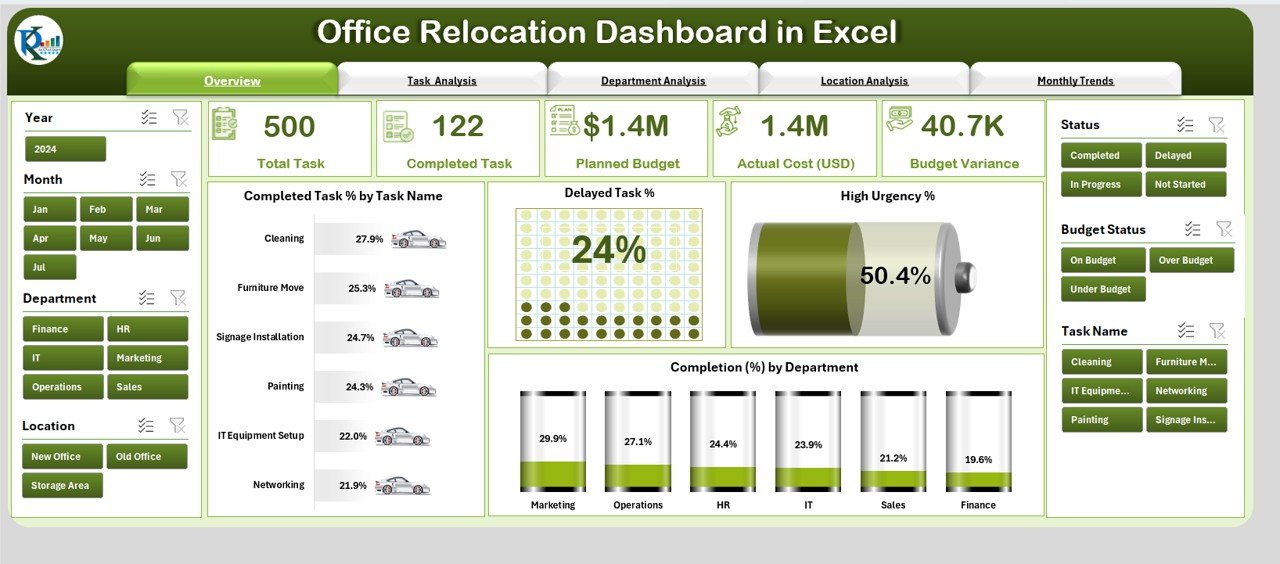
This is the main page that provides a snapshot of the relocation project.
Features:
-
Five Key Cards displaying overall progress metrics.
Charts Included:
- Completed Task % by Task Name
- Delayed Task %
- High Urgency %
- Completion % by Department
This section answers questions like:
-
How much of the relocation work is done?
-
Which tasks are lagging behind?
-
Are urgent issues increasing?
Task Analysis
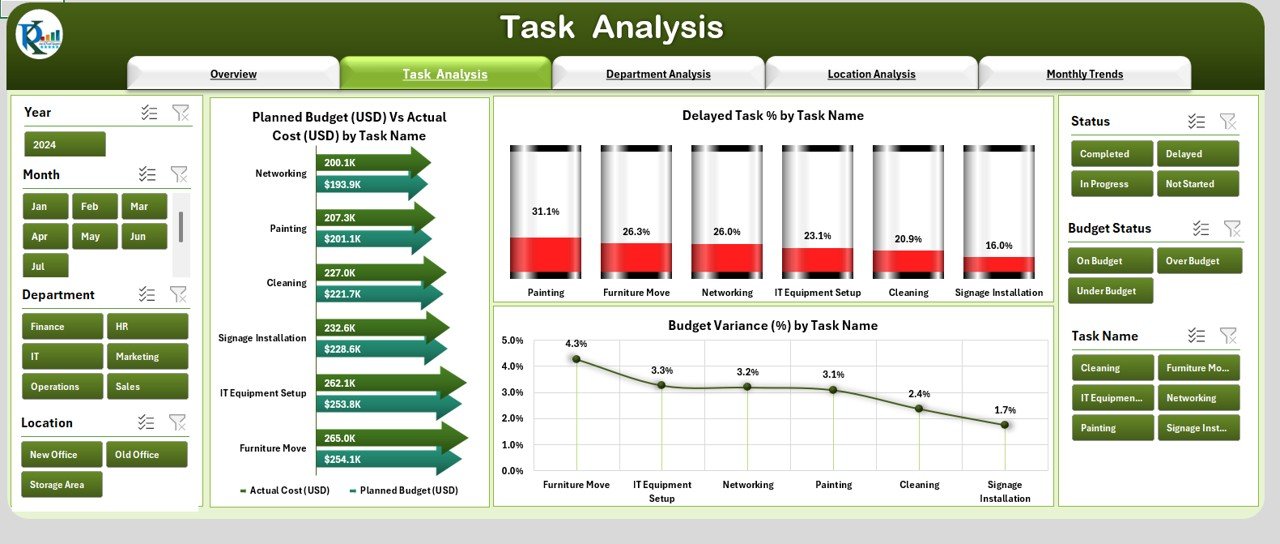
A deep dive into the task-level performance of the relocation.
Features:
Charts to track:
- Planned Budget (USD) vs. Actual Cost (USD) by Task Name
- Delayed Task % by Task Name
- Budget Variance % by Task Name
This section helps project managers pinpoint:
-
Which tasks are going over budget.
-
Where delays are happening.
-
How actual spending compares with planned costs.
Department Analysis
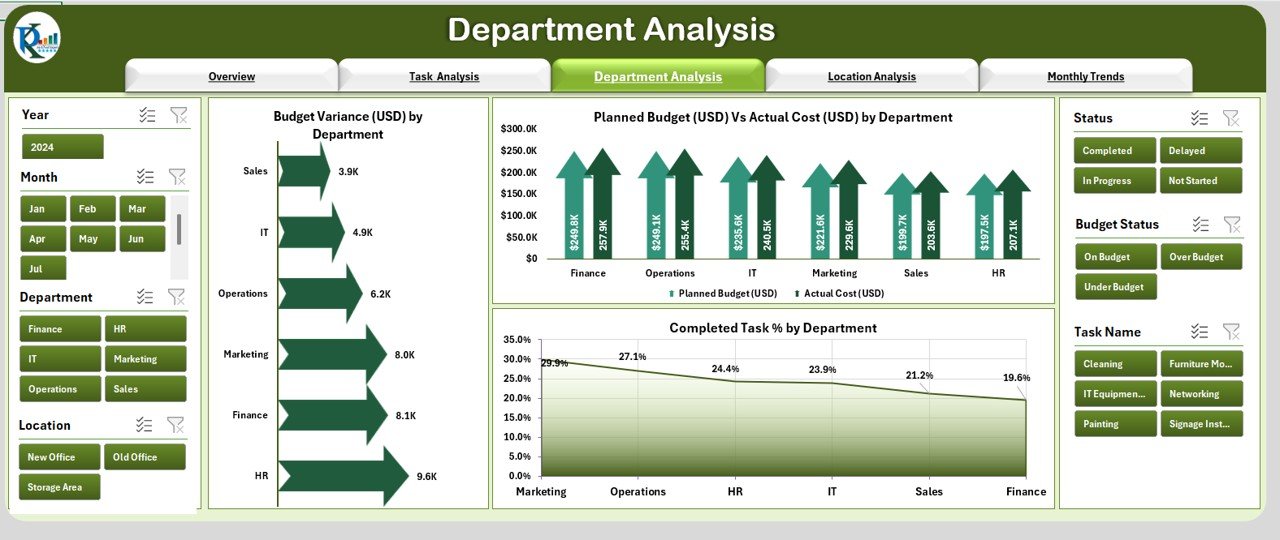
Analyze department-wise performance in the relocation.
Features:
Charts to track:
- Budget Variance (USD) by Department
- Planned Budget (USD) vs. Actual Cost (USD) by Department
- Completed Task % by Department
This section helps answer:
-
Which department is performing best?
-
Are certain teams overspending?
-
How efficiently is each department handling relocation tasks?
Click to Purchases Office Relocation Dashboard in Excel
Location Analysis
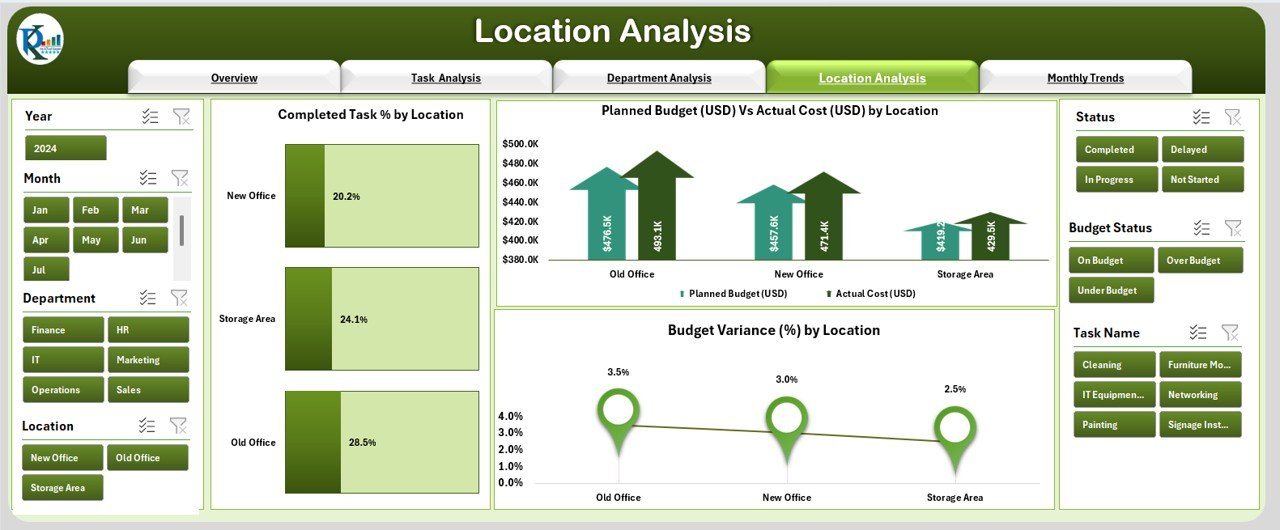
Ideal for multi-site relocation projects.
Features:
Charts to track:
- Completed Task % by Location
- Planned Budget (USD) vs. Actual Cost (USD) by Location
- Budget Variance % by Location
This is useful for:
-
Identifying problem areas in specific locations.
-
Comparing cost efficiency across sites.
-
Tracking regional progress.
Monthly Trends
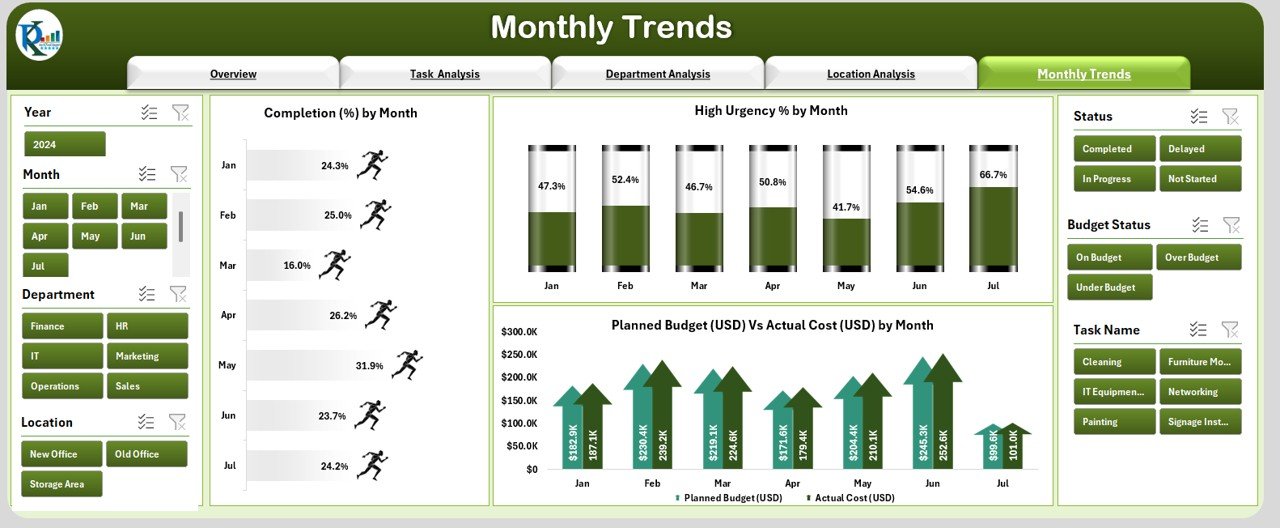
Track relocation progress over time.
Features:
Charts to track:
- Total Completion % by Month
- High Urgency % by Month
- Planned Budget (USD) vs. Actual Cost (USD) by Month
This section allows:
-
Seasonal or monthly performance review.
-
Identification of months with higher delays or urgent issues.
-
Monitoring of budget changes over time.
Data Sheet
-
Central repository for all relocation data.
-
Easy to update and automatically reflected in the dashboard visuals.
Support Sheet
-
Stores reference lists, drop-down values, and supporting data.
-
Keeps the main dashboard clean and functional.
Why You Need an Office Relocation Dashboard
Relocating an office involves multiple moving parts:
-
Coordination between departments.
-
Budget management.
-
Vendor oversight.
-
Timeline tracking.
Without a centralized tool, things can get messy quickly. The Office Relocation Dashboard helps you:
-
Avoid overspending by comparing planned vs. actual costs.
-
Identify delays early before they snowball.
-
Track performance of departments and locations.
-
Visualize trends to make better decisions.
Advantages of the Office Relocation Dashboard in Excel
Using this dashboard offers several benefits:
-
Centralized Information: All relocation-related data is in one place.
-
Real-Time Tracking: Updates automatically reflect across all charts and visuals.
-
Improved Decision-Making: Visual insights help prioritize actions.
-
Better Budget Control: Monitor and compare actual vs. planned expenses.
-
Time Efficiency: Quickly identify bottlenecks without going through endless spreadsheets.
-
Customizable: Easily adapt the dashboard to match your organization’s specific relocation needs.
Opportunities for Improvement
Even though this dashboard is comprehensive, you can make it even more powerful by:
-
Integrating with Power BI for advanced reporting.
-
Adding automated email alerts for delayed or urgent tasks.
-
Including Gantt charts for better visual timeline management.
-
Using conditional formatting to flag critical budget overshoots.
-
Tracking vendor performance to evaluate service quality.
Best Practices for Using the Office Relocation Dashboard
To get the most out of your dashboard:
-
Update Data Regularly – Make sure the Data Sheet is refreshed daily or weekly.
-
Standardize Task Names – Avoid duplicates or variations that can distort analysis.
-
Set Realistic Budgets – Base them on past relocation costs and market rates.
-
Monitor Department KPIs – Assign specific goals for each team.
-
Use Filters Wisely – Focus on problem areas instead of reviewing all data at once.
-
Back Up Your File – Always keep a backup before making major changes.
-
Engage Stakeholders – Share dashboard insights in weekly meetings for collective decision-making.
How to Use the Office Relocation Dashboard
-
Enter Data in the Data Sheet.
-
Select Filters using the slicers on each page.
-
Review Key Metrics on the Overview page.
-
Drill Down into specific pages for task, department, location, or monthly details.
-
Take Action based on insights, such as reallocating budgets or assigning additional resources.
Conclusion
The Office Relocation Dashboard in Excel is more than just a spreadsheet — it is a strategic control center for managing complex relocation projects. By bringing together budget data, departmental performance, and progress tracking, it ensures that your office move stays on time, within budget, and hassle-free.
Whether you are relocating a small office or moving multiple sites, this tool provides the clarity and structure you need to manage the process with confidence.
Frequently Asked Questions (FAQs)
1. Can I customize the Office Relocation Dashboard for my company?
Yes. You can edit task names, departments, locations, and budget values to match your relocation project.
2. How often should I update the dashboard data?
For active projects, update it at least weekly. For fast-moving projects, daily updates work best.
3. Can I track multiple office relocations in one dashboard?
Yes. By using location-based filters, you can track multiple moves in a single file.
4. Does it require advanced Excel skills?
No. The dashboard is designed for ease of use. If you can enter data and use drop-down menus, you can operate it.
5. Can I share the dashboard with my team?
Yes. You can share it via a shared drive, cloud storage, or email. Just ensure everyone uses the same version.
6. Is this dashboard compatible with Mac?
Yes, it works on both Windows and Mac versions of Excel, although some advanced features work best in the Windows desktop version.
Visit our YouTube channel to learn step-by-step video tutorials