In the fast-paced world of construction and real estate, market expansion is one of the most critical areas to track. Companies need a clear and structured way to monitor performance, compare actual results against targets, and make data-driven decisions. A Market Expansion KPI Dashboard in Excel provides a powerful and cost-effective solution, as it allows decision makers to access all metrics in one place.
In this article, we will walk you through everything you need to know about building and using a Construction and Real Estate Market Expansion KPI Dashboard in Excel, including its structure, key features, advantages, best practices, and frequently asked questions.
Click to Purchases Construction and Real Estate Market Expansion KPI Dashboard in Excel
What Is a Construction and Real Estate Market Expansion KPI Dashboard?
A Construction and Real Estate Market Expansion KPI Dashboard is an Excel-based tool designed to analyze and visualize key performance indicators related to entering new markets, launching projects in new regions, and increasing the company’s market reach.
The dashboard brings together actual numbers, targets, and previous-year results, and delivers MTD/YTD (month-to-date and year-to-date) insights for every KPI.
Why Should You Use Excel for Market Expansion KPI Dashboards?
Excel remains one of the most flexible and affordable tools for performance dashboards, especially for construction and real estate organizations that want to:
-
Centralize KPI data in a single file
-
Link multiple worksheet tabs
-
Use drop-downs to filter data by month or KPI
-
Monitor performance trends across the year
-
Compare actual vs target vs previous year
-
Avoid complex software licensing fees
Home Sheet
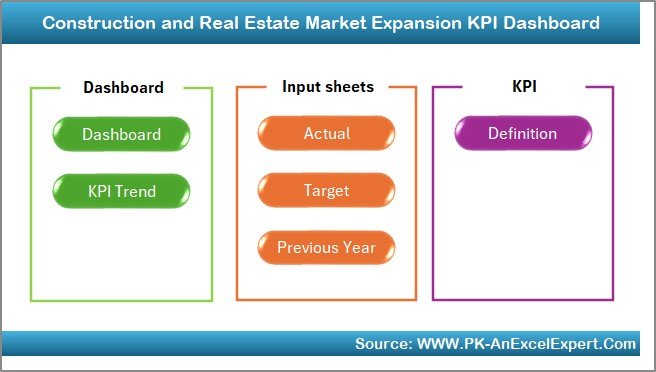
The Home Sheet acts as a landing page and navigation hub.
It contains 6 clearly labeled buttons that allow the user to jump to each worksheet without scrolling.
This saves time and improves the overall user experience.
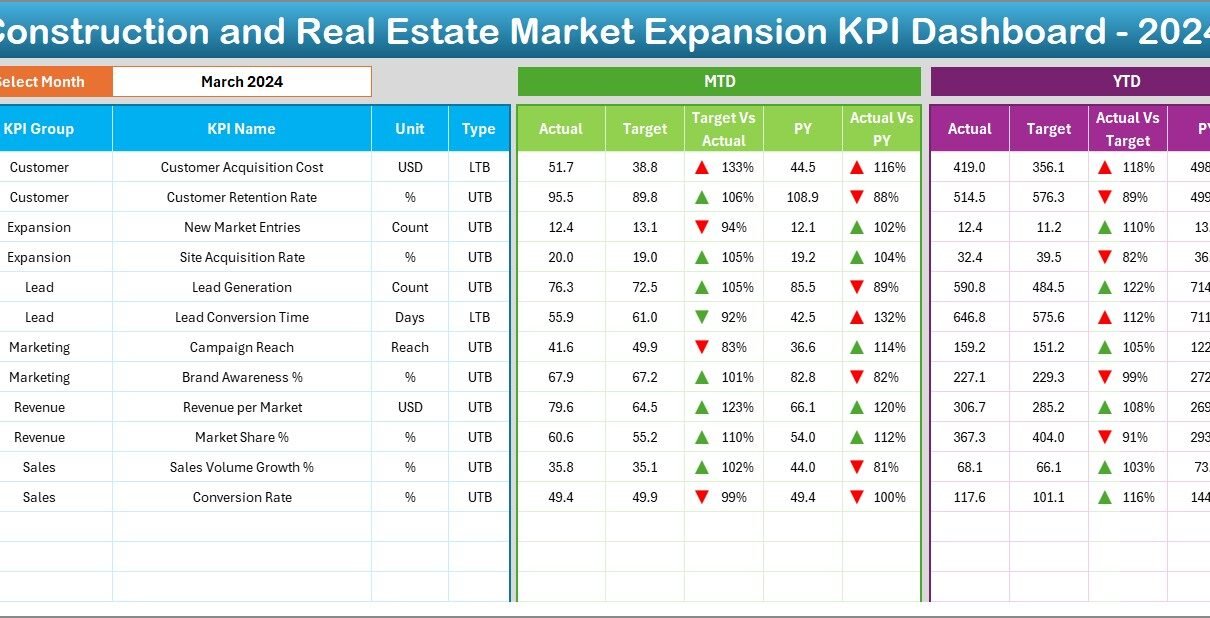
Dashboard Sheet
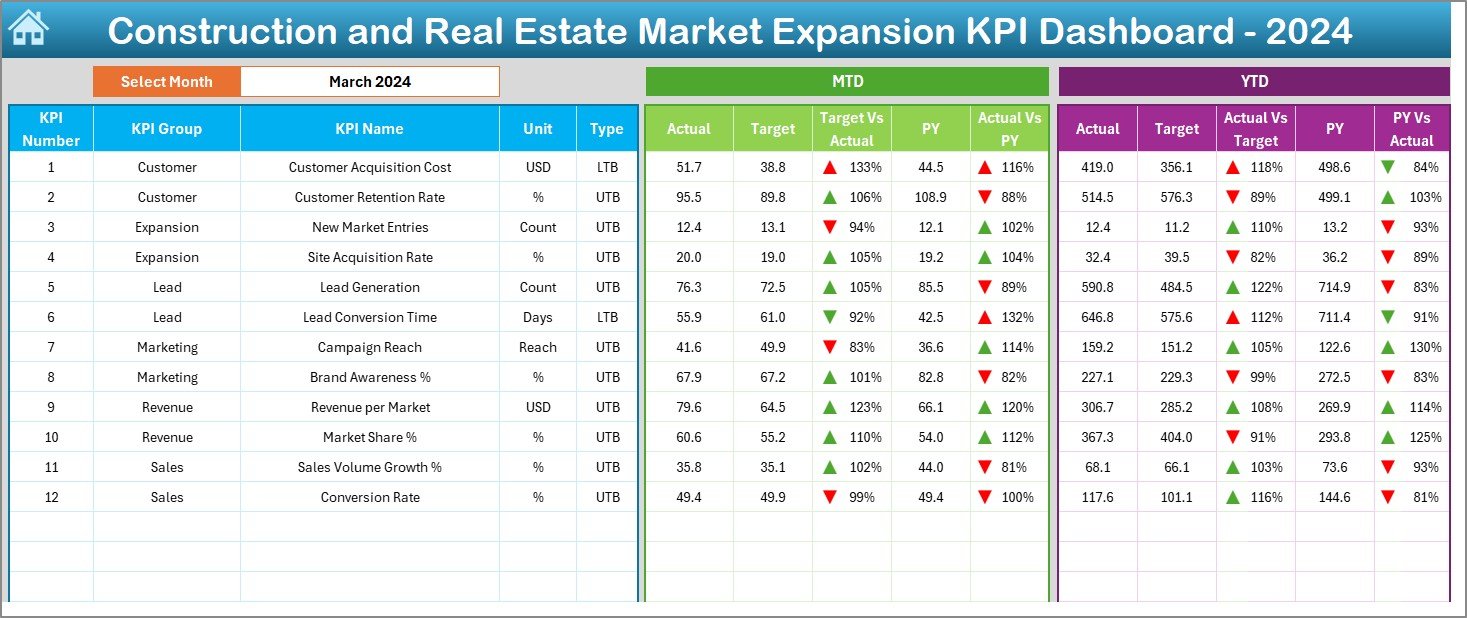
This is the core of the entire file.
It displays a month filter (cell D3) that users can change using a drop-down list.
Once a month is selected, all dashboard visuals update automatically.
The Dashboard page includes:
-
KPI cards for MTD Actual, Target, and Previous Year
-
Conditional formatting with up/down arrows for fast detection of trends
-
A detailed table with KPI Number, Group, Name, Unit, Type, MTD Actual, MTD Target, and MTD Previous Year
-
YTD analysis for Actual vs Target vs Previous Year
KPI Trend Sheet
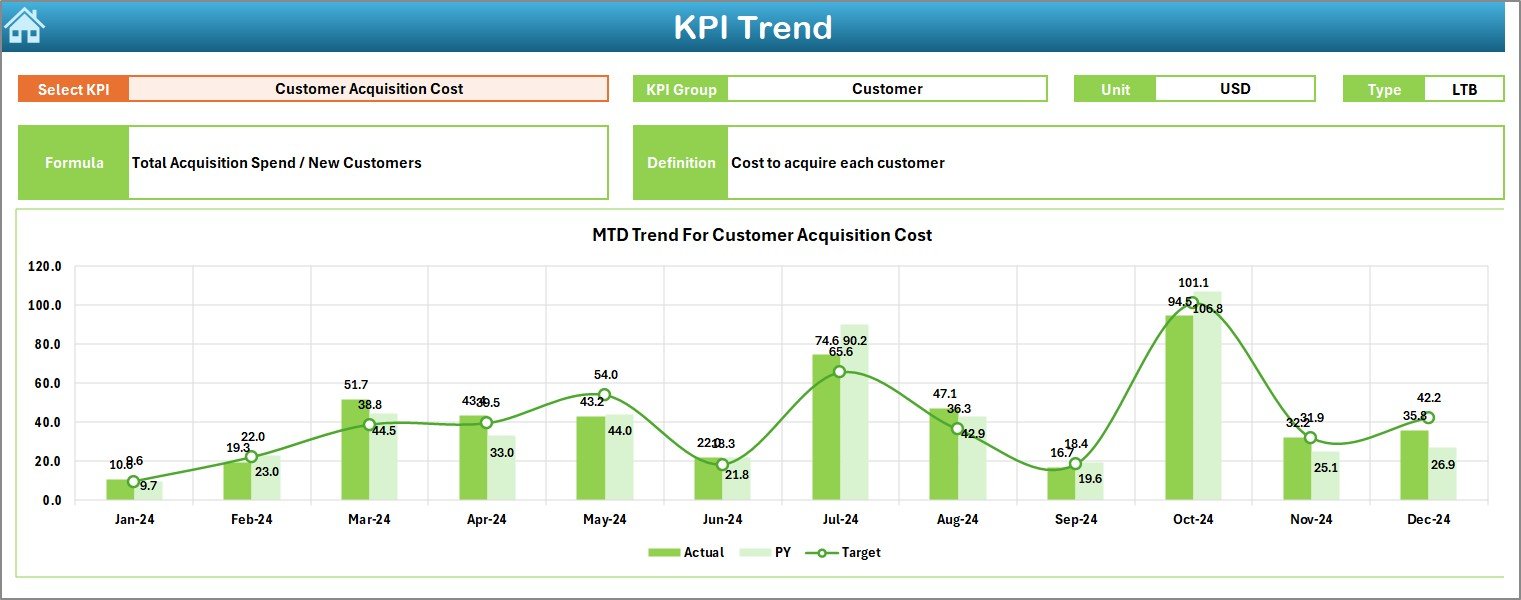
This sheet provides a deeper trend analysis.
Users can choose the respective KPI from a drop-down (cell C3) and see:
-
KPI Group
-
Unit of measurement
-
Type of KPI – LTB (Lower the better) or UTB (Upper the better)
-
Formula used
-
Definition (concise)
-
MTD trend chart (Actual, Target, Previous Year)
-
YTD trend chart (Actual, Target, Previous Year)
This makes it easy to detect deviations early, and make corrective actions before the end of the year.
Click to Purchases Construction and Real Estate Market Expansion KPI Dashboard in Excel
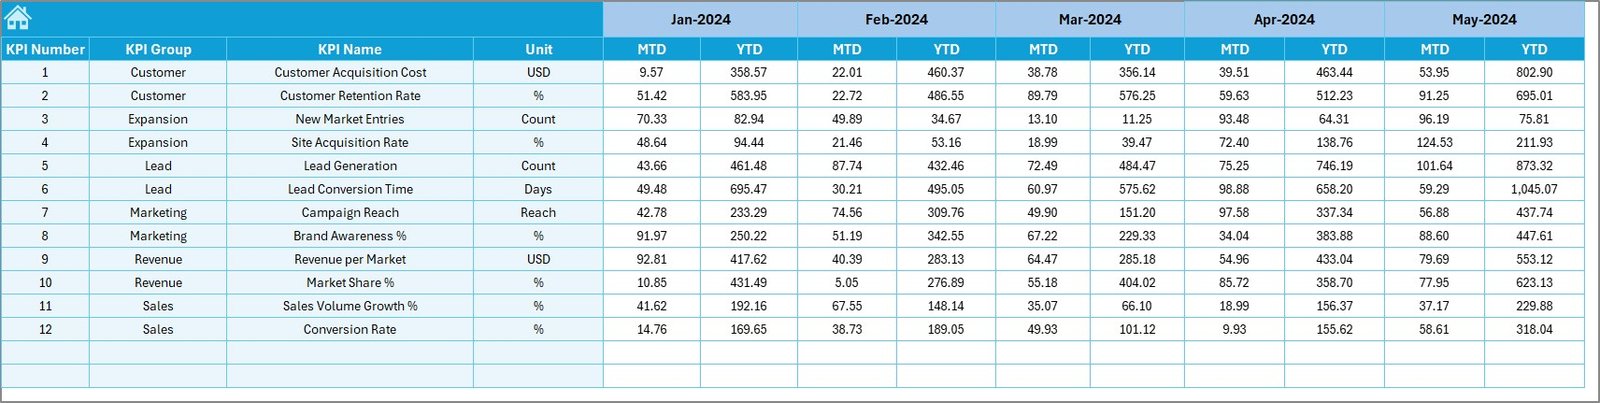
Actual Numbers Input Sheet
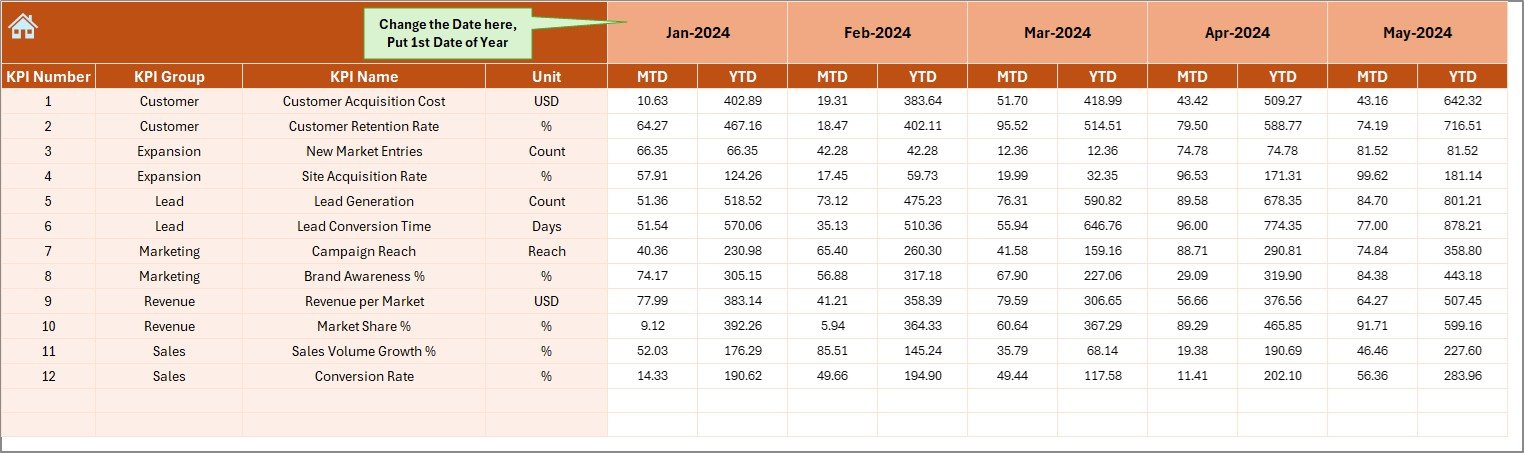
In this sheet, users enter the real values for each KPI.
By entering the first month of the year in cell E1, all month labels update automatically.
Then you just type in the MTD and YTD values for each KPI.
This approach ensures accuracy and keeps manual work to a minimum.
Target Sheet
This sheet stores all the target values.
You enter MTD and YTD targets on a monthly basis for each KPI.
The Dashboard and Trend Pages then compare actual performance against those numbers.
Previous Year Number Sheet
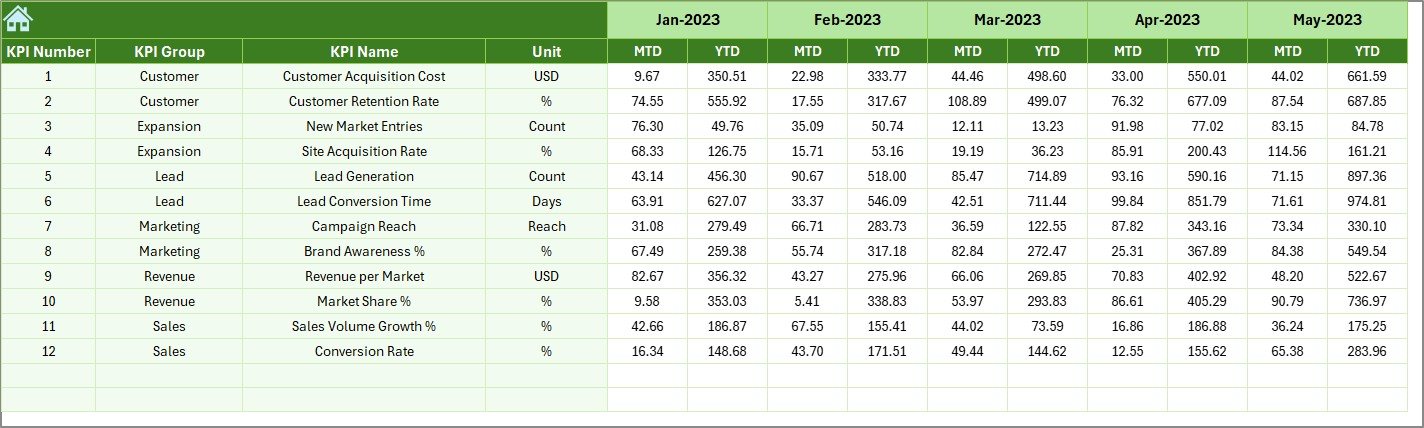
To understand how you are performing this year, you must compare it with the previous year.
In this sheet, you enter the monthly MTD and YTD values for the selected KPIs from last year.
The dashboard and trend visualizations then use this to calculate the variance.
KPI Definition Sheet
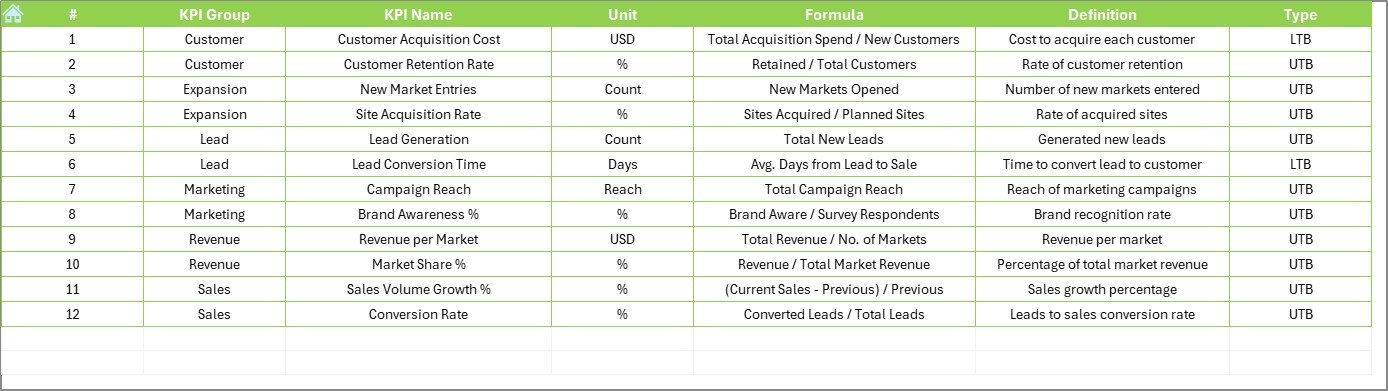
In this sheet, you define all KPIs, including:
-
KPI Name
-
KPI Group
-
Unit
-
Formula
-
Description
-
KPI Type (LTB or UTB)
Everything in the dashboard is powered by these definitions, which ensures consistency across all worksheets.
Advantages of a Construction and Real Estate Market Expansion KPI Dashboard
-
Centralization of information – All KPIs are in one file
-
Improved transparency – Easy to share with stakeholders
-
Real-time monitoring – One click to update performance view
-
Faster decision making – Visuals highlight deviations immediately
-
Better alignment – Target vs actual can be checked at every level
-
Clear structure – Separate sheets for input and reporting
-
Scalable – New KPIs can be added in the Definition sheet and will automatically appear in other views
Best Practices for the Construction and Real Estate Market Expansion KPI Dashboard
✅ Use short KPI definitions to keep the dashboard clean
✅ Always split MTD and YTD values – never merge them
✅ Enter the first month of the year correctly in the Actual Numbers Sheet
✅ Use drop-downs for easier selection (Month / KPI Name)
✅ Apply conditional formatting only where needed
✅ Keep the KPI Definition Sheet strictly for definitions (do not add data there)
✅ Update the Target and Previous Year Sheets once per month to avoid lag
✅ Review trend charts regularly, not just dashboards
Frequently Asked Questions
Q1: Can I add more KPIs later?
Yes. You simply need to update the KPI Definition sheet. All other sheets will automatically pick up the new KPI.
Q2: Can I use this dashboard in Google Sheets instead of Excel?
Excel is recommended due to better support for complex formulas and drop-down controls. You can still convert it to Google Sheets, but you may lose some formatting and charts.
Q3: What is the difference between MTD and YTD?
MTD stands for Month-to-Date – the performance for the current month only.
YTD means Year-to-Date – the cumulative performance from the start of the year until now.
Q4: Can I use this for multiple regions?
Yes. Add “Region” as an additional column in the Actual Numbers sheet, and use a slicer in the Dashboard to filter by region.
Q5: Do I need VBA for this dashboard?
No. This dashboard works without VBA. It is based on formulas, drop-downs, and standard Excel charts.
Visit our YouTube channel to learn step-by-step video tutorials