Office asset management has become a major priority for growing organizations. As the number of physical assets increases, businesses often struggle to keep everything organized. Whether you are tracking laptops, printers, furniture, or software licenses, one simple mistake can lead to unnecessary expenses and operational delays. Luckily, you can avoid all of that with a smart Office Asset Management Report in Excel.
In this article, you will discover how this Excel-based reporting tool works, what it includes, and why businesses use it to streamline daily asset monitoring. We will also walk through the key features, benefits, and best practices so that you can build an efficient, easy-to-use asset reporting process.
Click to Purchases Office Asset Management Report in Excel
What Is an Office Asset Management Report in Excel?
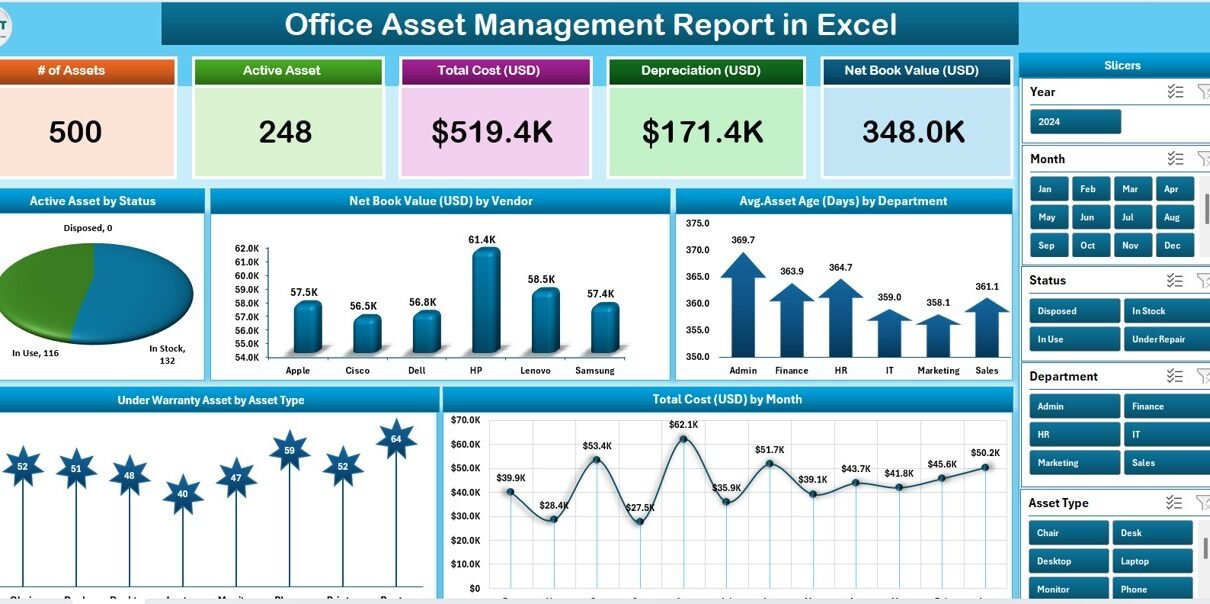
An Office Asset Management Report in Excel is a ready-to-use template for tracking and monitoring all the fixed and movable assets of your organization. It helps you record important information such as purchase date, current status, warranty expiry, vendor details, asset type, and net book value. Most importantly, it allows you to view everything in one consolidated dashboard.
Since it is built in Microsoft Excel, you do not need any additional software or IT support. The template includes predefined charts, slicers, and summary cards that make the report completely dynamic. Once you update the data sheet, the full report updates automatically.
What Are the Key Components of This Report?
The template contains three core pages and one support sheet, all designed to provide a seamless asset monitoring experience.
Summary Page
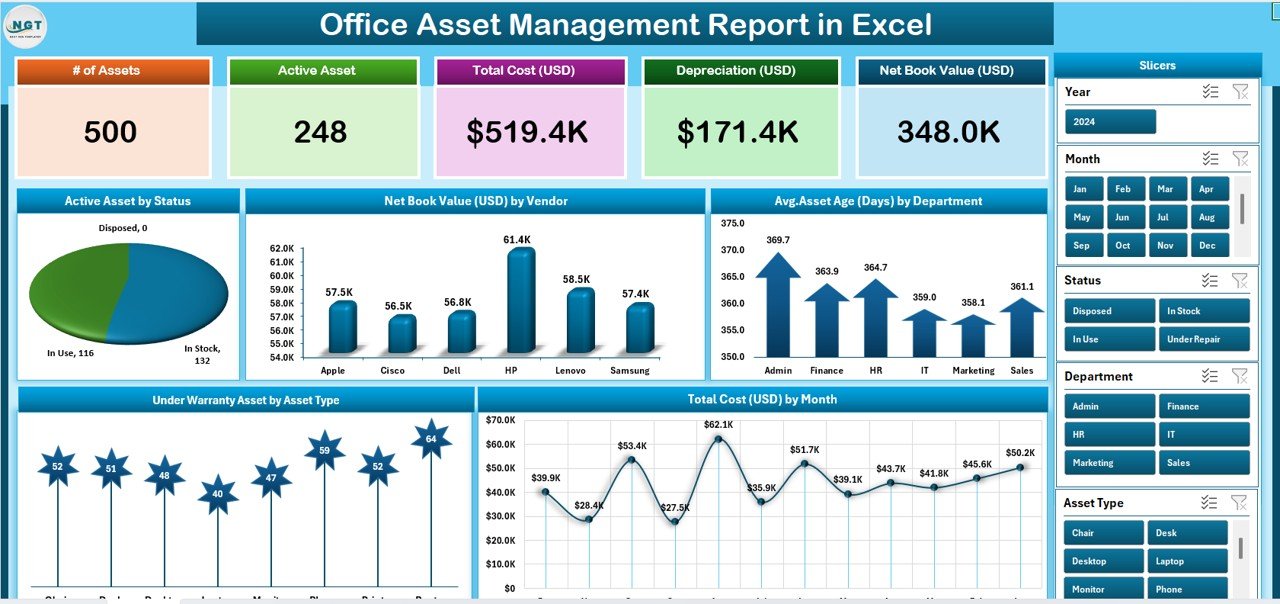
This is the main dashboard, offering a high-level overview of important asset metrics. It contains five informative cards that display real-time asset statistics. These cards typically show:
-
Total Active Assets
-
Net Book Value (USD)
-
Average Asset Age (Days)
-
Under Warranty Assets
-
Total Asset Cost (USD)
Below the cards, there are five interactive charts:
📊 Active Assets by Status
📊 Net Book Value (USD) by Vendor
📊 Average Asset Age (Days) by Department
📊 Under Warranty Assets by Asset Type
📊 Total Cost (USD) by Month
On the right side, you will find easy-to-use slicers so that users can filter information by department, asset type, or vendor.
Report Page
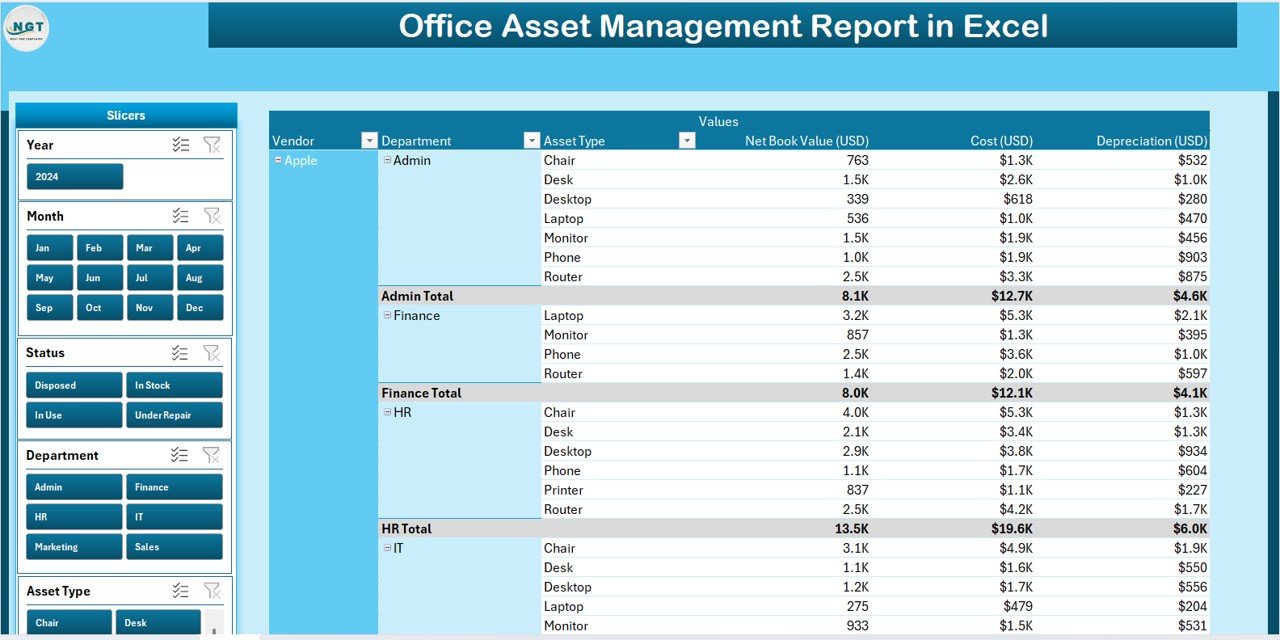
This page is focused on detailed asset analysis. On the left, slicers help you refine the information, while the main section displays a full information table. This table includes each individual asset along with its purchase date, asset ID, vendor name, cost, status, warranty status, and remaining life.
Data Sheet
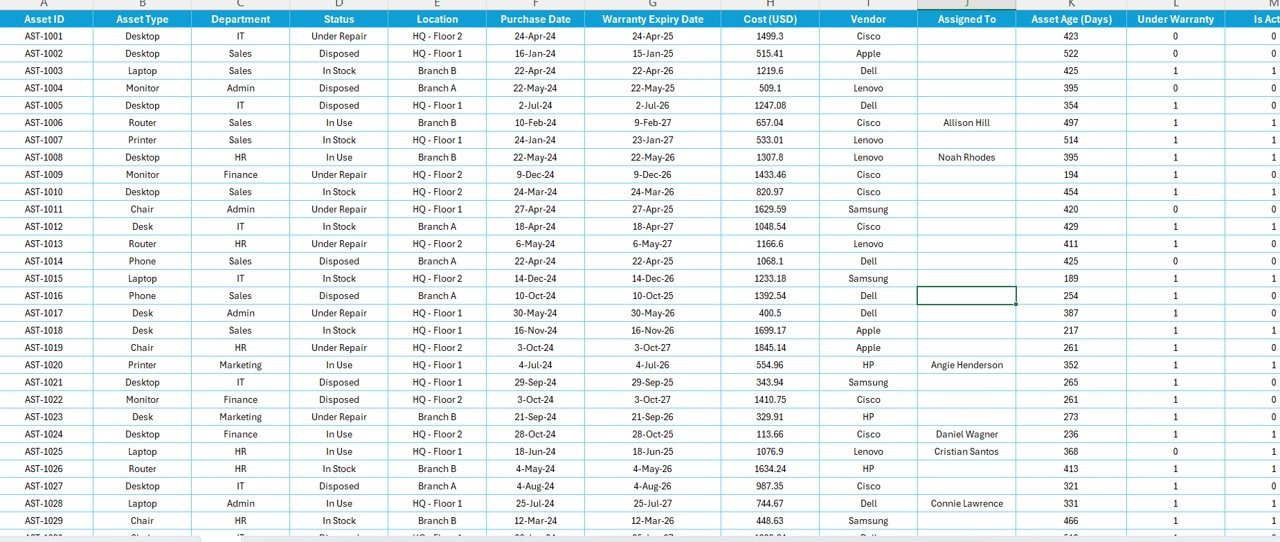
This sheet is where you enter and update all raw data. It usually contains fields such as:
Once this information is entered, the dashboard updates automatically.
Support Sheet
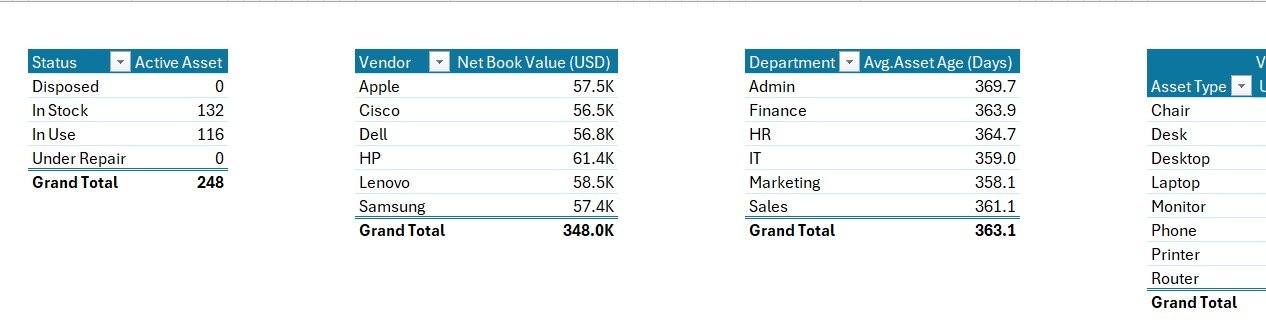
This sheet contains dropdown reference lists used throughout the report. For example, the lists of vendors, departments, and asset types are stored here, so all dropdowns stay consistent and error-free.
Why Should You Use an Excel-Based Office Asset Management Report?
There are many reasons why organizations choose Excel over complicated systems. Let’s look at the most important ones:
Cost-Effective and Easy to Deploy
Excel is already available in most offices. You don’t need to purchase any new software or hire consultants. As a result, you can deploy the report within minutes without heavy setup.
Centralized View of All Assets
The report consolidates all information in one place. You no longer need separate spreadsheets or documents for different departments. This reduces confusion and improves accuracy.
Helps You Monitor Asset Health
Because it tracks asset age, warranty status, and usage, you can identify which assets need replacement or renewal. Therefore, you avoid costly breakdowns or sudden failures.
Improves Budget Planning
With the Net Book Value (USD) and Total Cost (USD) displayed clearly, senior management can plan asset budgets more effectively. It becomes easier to estimate future replacement costs and evaluate ROI.
Fast and Flexible Reporting
Unlike rigid systems, Excel allows you to customize charts and add extra fields without any coding. You can adapt the report as your business evolves.
Click to Purchases Office Asset Management Report in Excel
Advantages of Using an Office Asset Management Report in Excel
✅ Real-time visibility of all office assets
✅ Better decision-making through visual charts and KPIs
✅ Accurate asset lifecycle tracking (from purchase to disposal)
✅ Improved warranty management and timely renewals
✅ Enhanced transparency across departments
✅ Easy customization for business-specific needs
✅ Lower operational risk due to fewer errors
✅ No subscription fees or long learning curves
What Information Can You Show in the Report?
To make your reporting more informative and actionable, include the following metrics and indicators:
How to Use the Office Asset Management Report (Step-by-Step)
-
Collect Asset Information
Gather purchase dates, warranty expiry, vendor details, and current status for each asset. -
Enter the Data into the Data Sheet
Use the pre-defined columns. Do not change any header names so that the dashboard works properly. -
Refresh the Pivot Tables
Go to Data → Refresh All. This updates all slicers, cards, and charts with the latest numbers. -
Review the Summary Page
Analyze the top cards first. Then filter by department or asset type to focus on specific areas. -
Drill Down in the Report Page
Click through slicers to see the detailed information table. Export filtered views into PDF if required. -
Repeat Weekly or Monthly
Update the data regularly so that every stakeholder always sees current information.
Best Practices for the Office Asset Management Report in Excel
✔ Standardize All Asset Names and Types
Use a consistent naming structure to avoid duplicate entries.
✔ Set a Monthly Update Schedule
Allocate a regular time for data entry and report refresh so that nothing is missed.
✔ Use Pivot Filters for Quick Insights
Always check slicers when viewing reports so that you focus only on the required information.
✔ Back Up the Report File
Keep at least one backup to avoid accidental loss of data.
✔ Train Users on Basic Excel Features
Make sure everyone knows how to filter, refresh, and export the report.
Conclusion
An Office Asset Management Report in Excel is one of the most effective ways to manage and monitor your organization’s assets. It gives you full control, real-time insights, and higher accuracy without investing in complex software. Since it is based on a simple Excel file, anyone can use it and the report can grow with your business.
If you want to keep your assets secure, reduce operational risks, and plan budgets more effectively, start using this Excel-based report today.
Frequently Asked Questions (FAQs)
Q1. What is the purpose of an Office Asset Management Report in Excel?
A1. The main purpose is to track the status, cost, usage, and lifecycle of all office assets in one central dashboard.
Q2. Can I add more assets or columns later?
A2. Yes. You can add more records or new columns in the Data Sheet and refresh the report to update the dashboard.
Q3. Do I need advanced Excel knowledge to use this report?
A3. No. The report works with simple slicers, pivot tables, and charts. Anyone with basic Excel skills can use it.
Q4. How often should I update the data sheet?
A4. You should update the data weekly or monthly, depending on how frequently your assets change.
Q5. Can I customize the charts shown on the summary page?
A5. Yes. You can edit the pivot chart settings in Excel. The template is fully customizable.
Visit our YouTube channel to learn step-by-step video tutorials