Cash Flow Forecasting in Excel forecasting becomes lender-ready when it shows exactly when cash enters the business, when cash leaves, and how much liquidity remains week by week. A 13-week cash flow forecast is the short-term model many US lenders, turnaround advisors, and finance teams expect because it converts a vague profit plan into a practical view of payroll, vendor payments, tax dates, debt service, collections, and borrowing needs.Cash Flow Forecasting in Excel
The pressure is real. The Federal Reserve’s 2026 Report on Employer Firms found that 60% of firms applied for financing in the 12 months leading up to the survey, and 56% of those applicants sought funding to meet operating expenses. Only 42% received the full amount requested. The U.S. Chamber Q1 2026 Small Business Index also reported that 72% of small businesses were comfortable with cash flow, but only 20% were very comfortable. That gap is why a rolling 13-week model matters.Cash Flow Forecasting in Excel
In simple terms, a 13-week cash flow is a direct-method forecast. It focuses on cash receipts and cash disbursements, not accounting profit. Wall Street Prep describes the 13-week model as a weekly forecast used in restructuring and lender situations because it gives short-term visibility into the company’s options.Cash Flow Forecasting in Excel
Key Features of a 13-Week Cash Flow Forecasting in Excel
A lender-ready 13-week cash flow forecast should be simple enough to update every week and detailed enough to support a credit conversation. The core features are:
- Weekly columns for 13 weeks: each column represents one week, usually ending on the same weekday.
- Cash receipts section: customer collections, loan proceeds, owner contributions, tax refunds, asset sales, and other inflows.
- Cash disbursements section: payroll, rent, vendors, taxes, insurance, loan payments, capex, and other cash outflows.
- Beginning and ending cash balance: the line lenders check first when they ask whether the business can make payroll and debt payments.
- Variance tracking: actual vs forecast by week, with notes explaining collection delays, timing shifts, and cost overruns.
- Rolling update logic: every week, replace the oldest forecast with actuals, add a new week at the end, and keep the forecast at 13 weeks.
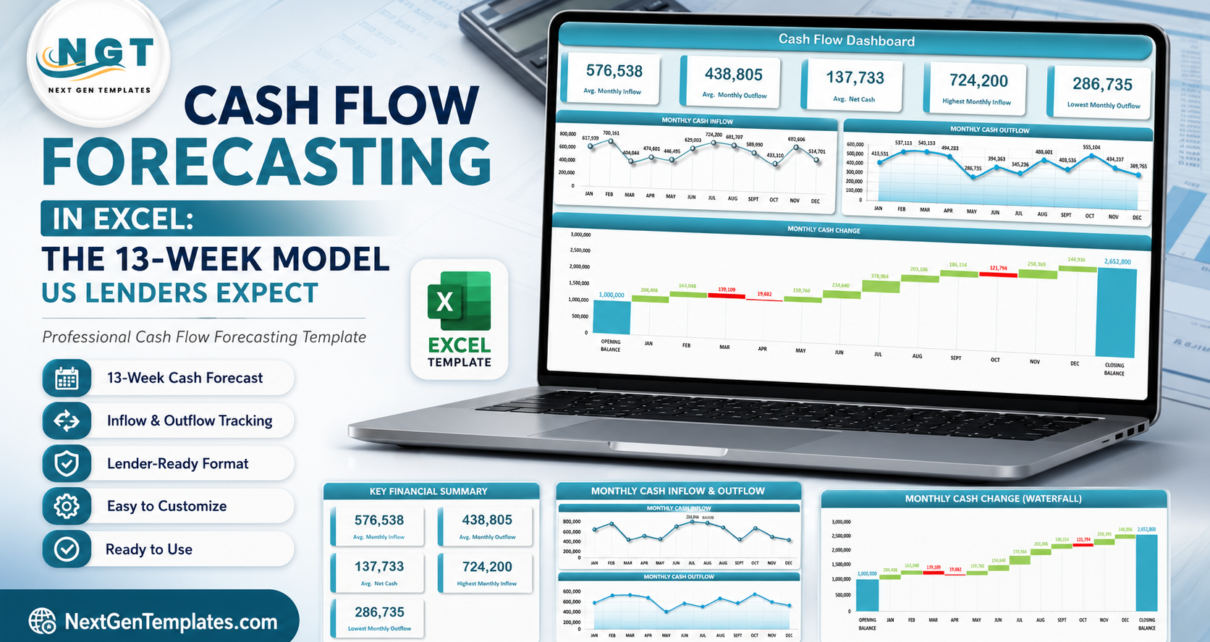
Recommended starting point: Use the Cash Flow Template in Excel from NextGenTemplates as your base workbook. It is a paid Excel template currently listed at $6.99 and includes monthly inflow/outflow tracking, automatic net cash and closing balance calculations, a dashboard, and a waterfall chart. For a lender package, add the 13 weekly forecast columns described in this tutorial.
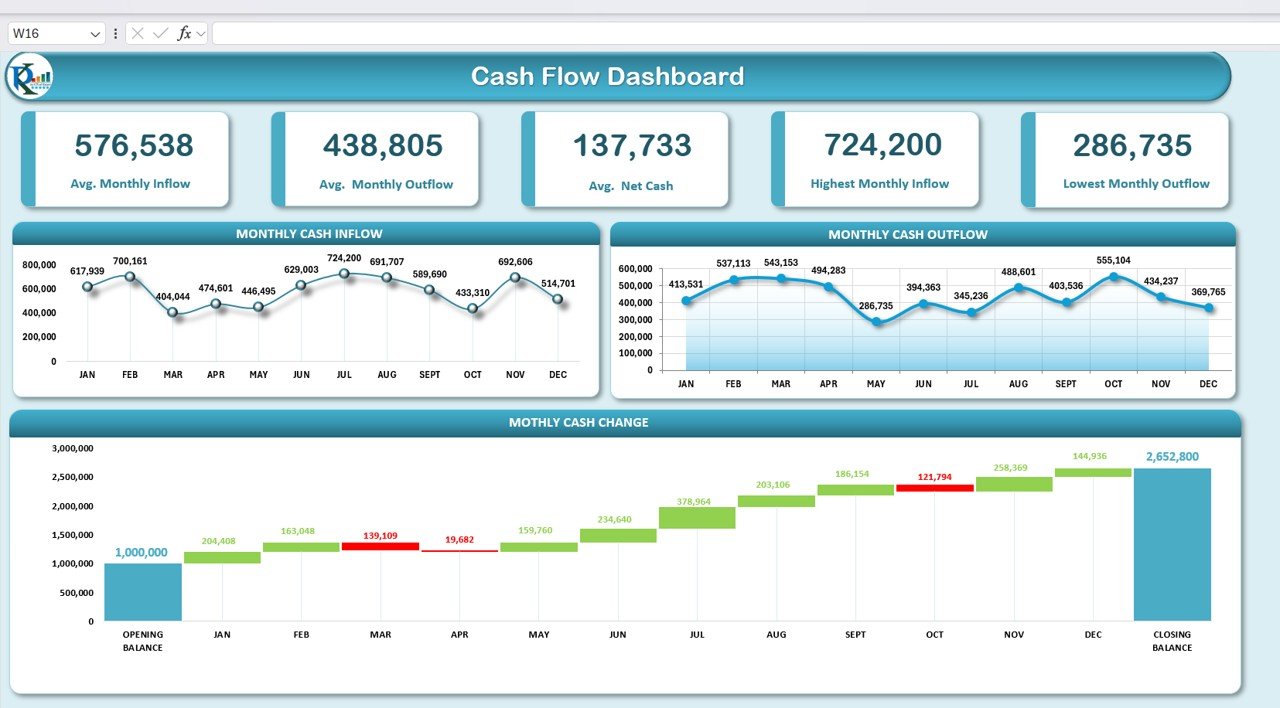
Dashboard Pages Explanation for the Cash Flow Template in Excel
The Cash Flow Template in Excel gives you the base structure for cash visibility. It is not limited to lender reporting, but it is a practical workbook to start from before you build the 13-week version.Cash Flow Forecasting in Excel
Data Entry Sheet
The data entry area captures opening balance, monthly cash inflows, monthly cash outflows, net cash change, and closing balance. Typical inflow categories include sales revenue, investment income, loan received, and other income. Typical outflows include operating expenses, salaries, loan repayment, asset purchases, and custom expense categories.Cash Flow Forecasting in Excel
Dashboard Sheet
The dashboard summarizes average monthly inflow, average monthly outflow, average net cash flow, highest monthly inflow, and lowest monthly outflow. It also includes trend visuals and a waterfall chart so owners and finance teams can see how the opening balance moves to the closing balance.Cash Flow Forecasting in Excel
13-Week Forecast ViewCash Flow Forecasting in Excel
For the lender-ready version, create a separate tab with Week 1 through Week 13 as columns. Bring the same inflow and outflow categories across the rows. Add beginning cash, total receipts, total disbursements, net weekly cash flow, ending cash, minimum cash requirement, and borrowing need. This keeps the workbook simple while making it useful for bank discussions.Cash Flow Forecasting in Excel
Cash Flow Template in Excel vs Google Sheets vs Paid Finance Software – Feature Comparison
| Feature | Cash Flow Template in Excel | Google Sheets Alternative | Paid Finance SaaS |
|---|---|---|---|
| Cost | One-time template purchase | Low-cost cloud template | Monthly subscription |
| Setup time | Fast for Excel users | Fast for teams already in Google Drive | Longer implementation |
| 13-week customization | Easy to add weekly columns | Easy to share, but formula governance matters | Depends on vendor module |
| Best fit | Owners, accountants, and finance managers | Distributed teams | Larger finance teams with integrations |
| Year-1 cost at 5 users | Usually template cost only | Template plus workspace costs if applicable | Can rise quickly by seat or module |
Who Should Use This Template
This approach is ideal for business owners preparing for a bank review, finance managers tracking short-term liquidity, accountants building client cash reports, startup founders watching runway, and operators who need to know whether payroll, rent, inventory, and debt payments can be covered over the next quarter.Cash Flow Forecasting in Excel
It is not the best fit if you need automated bank feeds, ERP integrations, treasury approval workflows, or multi-entity consolidation. In those cases, use Excel for the operating forecast and connect it to a broader finance system later.
Real-World Use Cases
1. Line of Credit Renewal
A lender reviewing a revolving line wants evidence that the business can handle collections, supplier payments, and borrowing base movement. A 13-week cash flow gives the discussion a weekly rhythm.
2. Seasonal Cash Crunch
A retailer can use the model to see whether inventory purchases in Week 3 will create a cash gap before customer receipts arrive in Week 7.
3. Turnaround or Expense Control
A company under pressure can use the weekly variance log to decide which payments can be delayed, which receivables need collection calls, and which expenses must be reduced now.
Advantages of Using a Cash Flow Template in Excel
Excel keeps the model transparent. Lenders, accountants, and business owners can see formulas, adjust assumptions, and test scenarios without waiting on a software implementation. A template also reduces setup time because the categories, calculations, dashboard layout, and starting structure are already built.
The biggest advantage is ownership. You can change the weekly buckets, add lender-specific lines, include notes, and keep the workbook aligned with how your business actually collects and spends cash.
Opportunities for Improvement
The Cash Flow Template in Excel is a strong starting point, but a lender-ready 13-week model needs weekly detail. Add invoice-level collections for major customers, separate payroll weeks, track rent and tax dates, and include a variance explanation column. If multiple people update the workbook, protect formulas and keep one owner responsible for final weekly sign-off.
Best Practices for a 13-Week Rolling Cash Flow
- Start with cash in bank: reconcile opening cash to the bank balance before updating the model.
- Use real collection dates: do not spread receivables evenly if customers pay in specific weeks.
- Separate fixed and variable payments: payroll, rent, taxes, and loan payments should be visible.
- Update weekly: replace forecast with actuals, explain variance, and add a new Week 13.
- Show borrowing need: add a minimum cash line so the lender can see when the business needs support.
- Keep assumptions documented: every major timing change should have a note.
Explore Relevant Templates
Cash Flow Template in Excel – best starting point for Excel users who want inflow, outflow, net cash, closing balance, dashboard KPIs, and a waterfall chart.
Cash Flow Dashboard in Google Sheets – a cloud-friendly option for teams that want cash inflow, cash outflow, and net cash visuals in Google Sheets.
Cash Flow KPI Dashboard in Google Sheets – useful when you need MTD, YTD, target, previous-year comparison, and KPI trend tracking.
Finance Summary Dashboard in Excel – better for broader finance reporting across income, expenses, profit margin, and cash flow.
For more finance tools, browse the Financial Tools collection. You can also watch spreadsheet tutorials on YouTube.com/@PKAnExcelExpert and product walkthroughs on YouTube.com/@NextGenTemplates.
Frequently Asked Questions
What is a 13-week cash flow forecast?
A 13-week cash flow forecast is a weekly model that projects cash receipts, cash disbursements, and ending cash for the next 13 weeks. It is usually updated every week and rolled forward by adding one new week.
Why do lenders ask for 13 weeks?
Thirteen weeks covers roughly one quarter, which is long enough to show payroll, rent, tax, inventory, debt, and collection cycles, but short enough to remain accurate at a weekly level.
Can I build a 13-week cash flow forecast in Excel?
Yes. Excel is often the easiest place to build it because the model is transparent, flexible, and easy to share with lenders, accountants, and management. Start with a clean cash flow template, then add weekly columns and variance tracking.
What should be included in a lender-ready cash flow forecast?
Include beginning cash, cash receipts, cash disbursements, net weekly cash flow, ending cash, minimum cash requirement, borrowing need, actual-vs-forecast variance, and assumption notes.
Is the Cash Flow Template in Excel already a 13-week model?
The template is a ready-to-use cash flow workbook with monthly inflow/outflow tracking, closing balance calculations, dashboard KPIs, and waterfall visuals. For a lender-specific 13-week package, use it as a base and add the weekly forecast tab described above.
About the Author
Built by PK – Microsoft Certified Professional with 15+ years of Excel, Google Sheets, and Power BI experience. Founder of NextGenTemplates, reaching 300K+ subscribers across YouTube channels. Every template is hand-built and tested before release.
Conclusion
A good 13-week cash flow forecast does not need to be complicated. It needs to be current, weekly, cash-based, and honest about timing. If you want to move faster, start with the Cash Flow Template in Excel, then add the weekly lender view. That gives you the best of both worlds: a usable cash flow dashboard for management and a practical short-term forecast for lender conversations.
For step-by-step Excel tutorials, visit YouTube.com/@PKAnExcelExpert.