Podcast monetization startups create more moving parts than most founders expect: total revenue, operating cost, net profit, active startups, funding stage, primary channel, monthly listeners, paid subscribers, subscriber conversion, region, podcast category, monetization model, quarter, and startup status. A small podcast portfolio tracking 10 startups across 12 months can easily produce hundreds of rows of performance data. The Podcast Monetization Startups Dashboard in Power BI turns those records into a 5-page PBIX report with KPI cards, slicers, and visual analysis for revenue, audience growth, startup health, and category insight.
This Power BI dashboard is built for podcast founders, creator economy operators, media startup teams, accelerators, podcast agencies, and investor reporting teams that want a repeatable way to review monetization performance without designing a report from scratch. Open the PBIX file in Power BI Desktop, replace or connect the sample source, refresh the report, and use slicers to review the selected startup, channel, region, category, funding stage, month, status, or monetization model.
Microsoft explains the Power BI Desktop environment here: Power BI Desktop documentation.
Click here to purchase Podcast Monetization Startups Dashboard in Power BI
Key Features of Podcast Monetization Startups Dashboard in Power BI
5 Power BI report pages: The template includes Overview Page, Revenue Mix, Audience Growth, Startup Health, and Category Insights. Each page answers a different management question about revenue, cost, profit, subscribers, listeners, funding stages, categories, channels, and monetization models.
5 executive KPI cards: The Overview Page includes Total Revenue, Total Startups, Operating Cost, Net Profit, and Active Startups. These cards help teams understand commercial performance and portfolio activity before drilling into the charts.
15 ready-made chart views: The report includes charts for Net Profit by Funding Stage, Operating Cost by Monetization Model, Total Revenue and Operating Cost by Month Name, Profit Margin by Region, channel cost and revenue, Monthly Listeners by Month Name, Total Startups by Status, Paid Subscribers by Region, Monthly Listeners by Primary Channel, Active Startups by Funding Stage, Operating Cost by Region, Net Profit by Podcast Category, Total Revenue by Quarter, and Subscriber Conversion by Podcast Category.
Interactive slicers: Slicers make the report useful during founder meetings, agency reviews, and investor updates. Instead of duplicating pages manually, users can filter the dashboard by the fields available in their data and quickly compare segments.
Editable PBIX format: Analysts can customize visuals, labels, pages, colors, measures, relationships, and data connections in Power BI Desktop. The template gives you a starting structure while keeping the report editable.
Dashboard Pages Explanation
1 – Overview Page
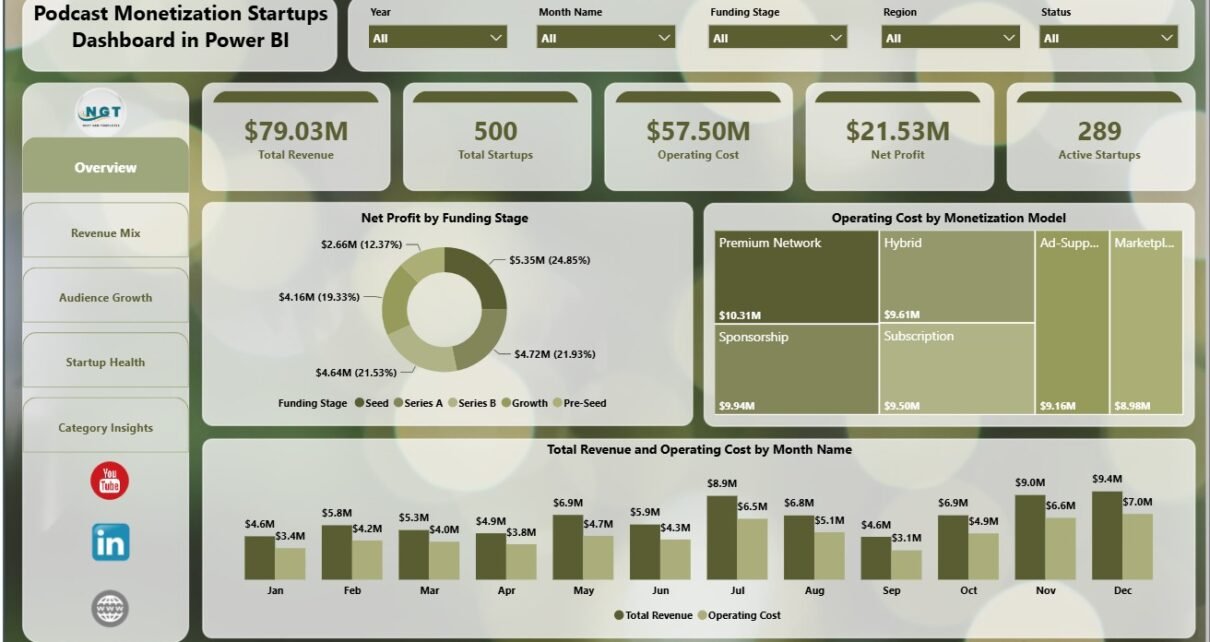
The Overview Page is the executive summary of the Podcast Monetization Startups Dashboard in Power BI. At the top, it shows Total Revenue, Total Startups, Operating Cost, Net Profit, and Active Startups. These cards help users quickly understand whether the podcast startup portfolio is growing profitably and how many startups are currently active.
Net Profit by Funding Stage: This chart compares net profit across funding stages. It helps founders, analysts, and investors understand whether early-stage or later-stage podcast startups are producing stronger profit outcomes.
Operating Cost by Monetization Model: This visual compares cost across monetization models such as ads, subscriptions, sponsorships, memberships, or affiliate revenue. It helps teams identify which models are more expensive to operate before scaling them.
Total Revenue and Operating Cost by Month Name: This trend compares monthly revenue against monthly operating cost. It helps teams see whether monetization growth is staying ahead of monthly cost movement.

Podcast Monetization Startups Dashboard in Power BI
2 – Revenue Mix
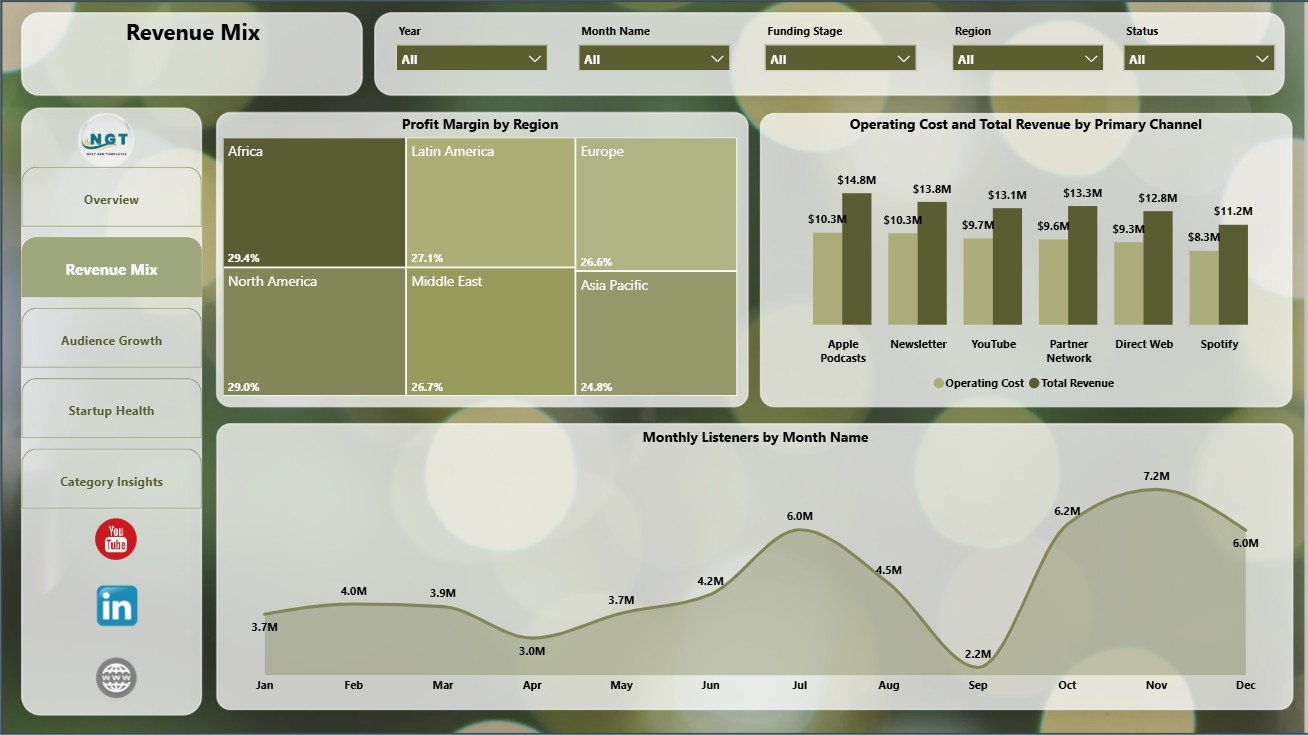
The Revenue Mix page focuses on profit margin, channel performance, operating cost, total revenue, and listener movement. It is useful when teams need to understand whether top-line revenue is actually converting into profitable performance by region, channel, and month.
Profit Margin by Region: This chart compares profit margin across regions. It helps identify markets where revenue quality is strongest and regions where cost, pricing, or channel strategy may need review.
Operating Cost and Total Revenue by Primary Channel: This visual compares channel-level revenue and cost. It helps teams separate channels that create profitable growth from channels that add cost without enough revenue return.
Monthly Listeners by Month Name: This trend shows listener movement across months. It helps review seasonality, audience growth momentum, and months that may need more promotion or content support.
Revenue Mix
3 – Audience Growth
The Audience Growth page connects startup status, regional paid subscribers, and channel-level listener acquisition. It helps teams understand whether listener reach is becoming paid subscriber growth and whether active startup count is healthy.
Total Startups by Status: This chart breaks startup count by status. It helps portfolio teams understand how many startups are active, paused, scaling, inactive, or in another operating state based on the source data.
Paid Subscribers by Region: This visual compares paid subscriber volume by region. It helps identify markets where subscription conversion and monetization deserve more attention.
Monthly Listeners by Primary Channel: This chart compares listener volume across primary channels. It helps teams decide which distribution or acquisition channels are strongest for audience growth.
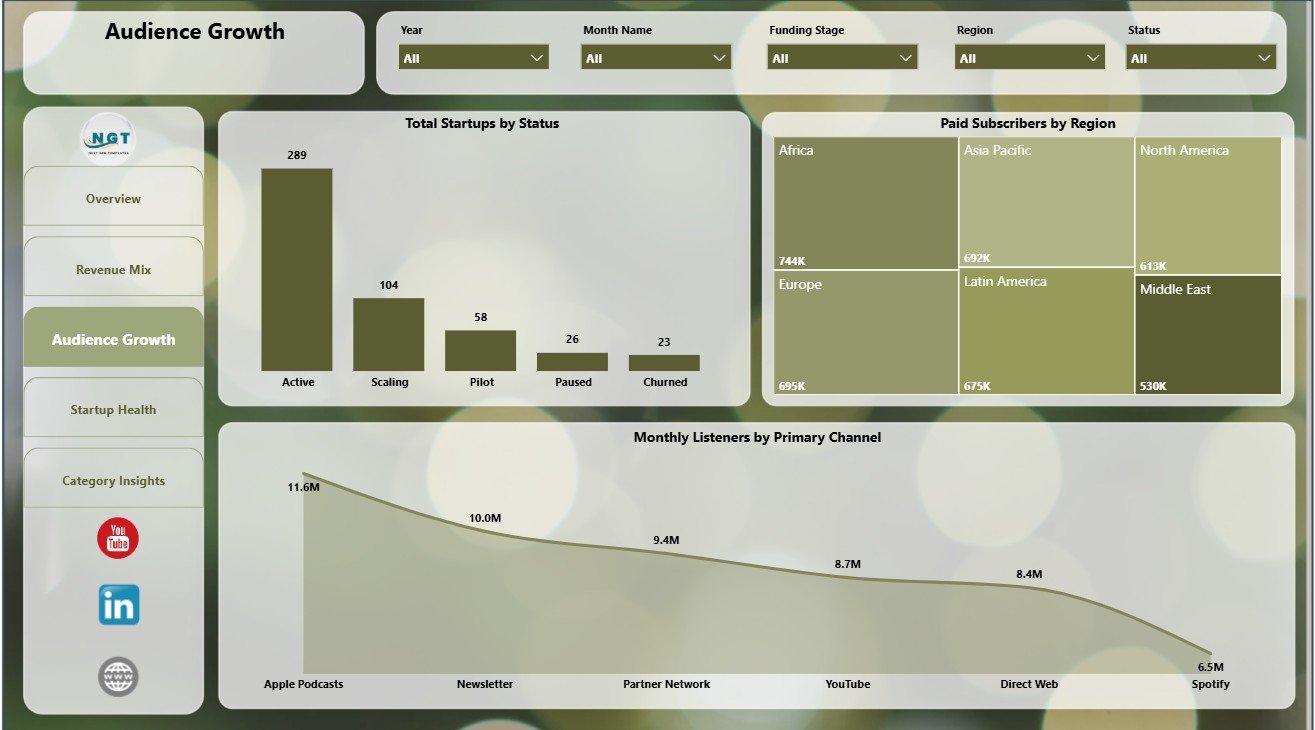
Audience Growth
4 – Startup Health
The Startup Health page reviews operating condition by funding stage, region, and podcast category. It supports founder updates, agency reporting, portfolio reviews, and investor conversations where the team needs to connect cost, activity, and category profit.
Active Startups by Funding Stage: This chart compares active startup count by funding stage. It helps teams understand whether bootstrapped, seed, Series A, or later-stage startups are more operationally active.
Operating Cost by Region: This visual compares operating cost by region. It helps identify where production, sales, talent, platform, or marketing cost is concentrated.
Net Profit by Podcast Category: This chart ranks podcast categories by profit contribution. It helps teams decide which categories deserve more investment, sponsor packaging, or audience development.
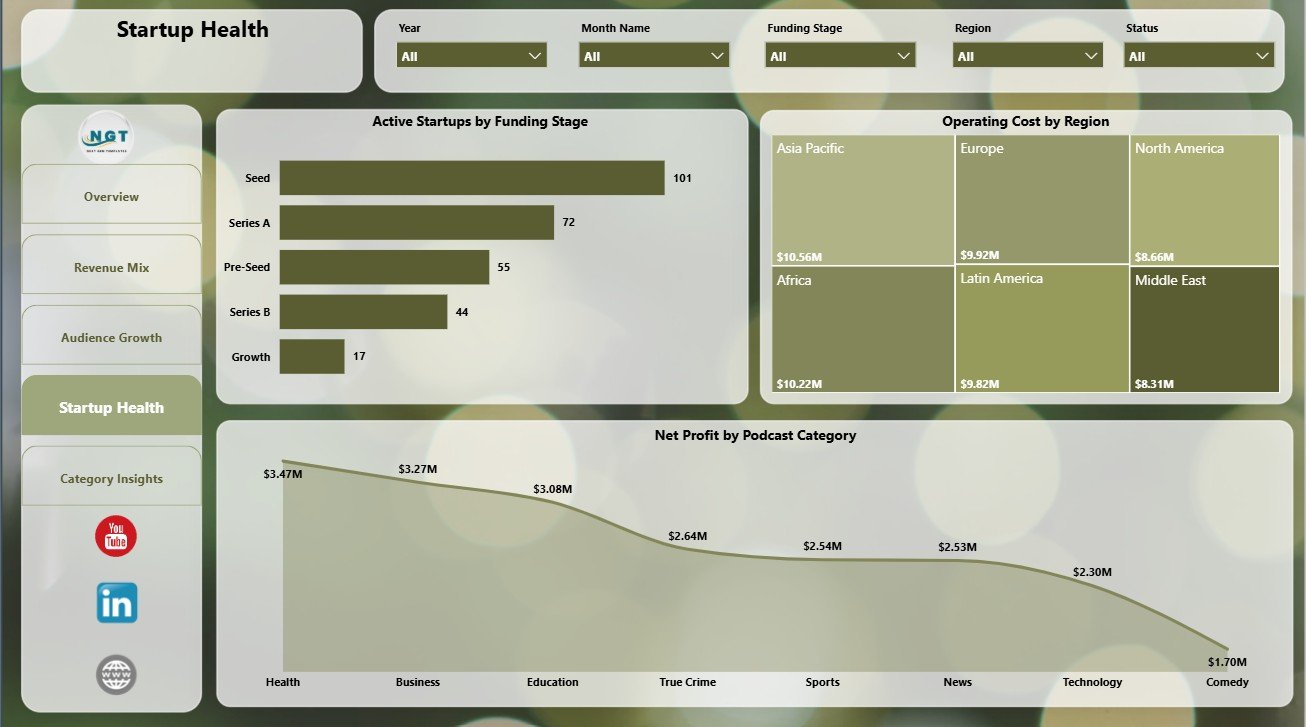
Startup Health
5 – Category Insights
The Category Insights page is built for quarterly planning and category-level strategy. It connects revenue timing, model-level cost, and subscriber conversion by category so teams can see where commercial traction is strongest.
Total Revenue by Quarter: This chart shows revenue by quarter. It helps leadership review whether monetization is improving across the year or concentrated in specific periods.
Operating Cost by Monetization Model: This visual compares operating cost by monetization model. It helps teams understand which revenue models need more resources before making growth decisions.
Subscriber Conversion by Podcast Category: This chart compares subscriber conversion across categories. It helps identify podcast categories where listeners are more likely to become paid subscribers.
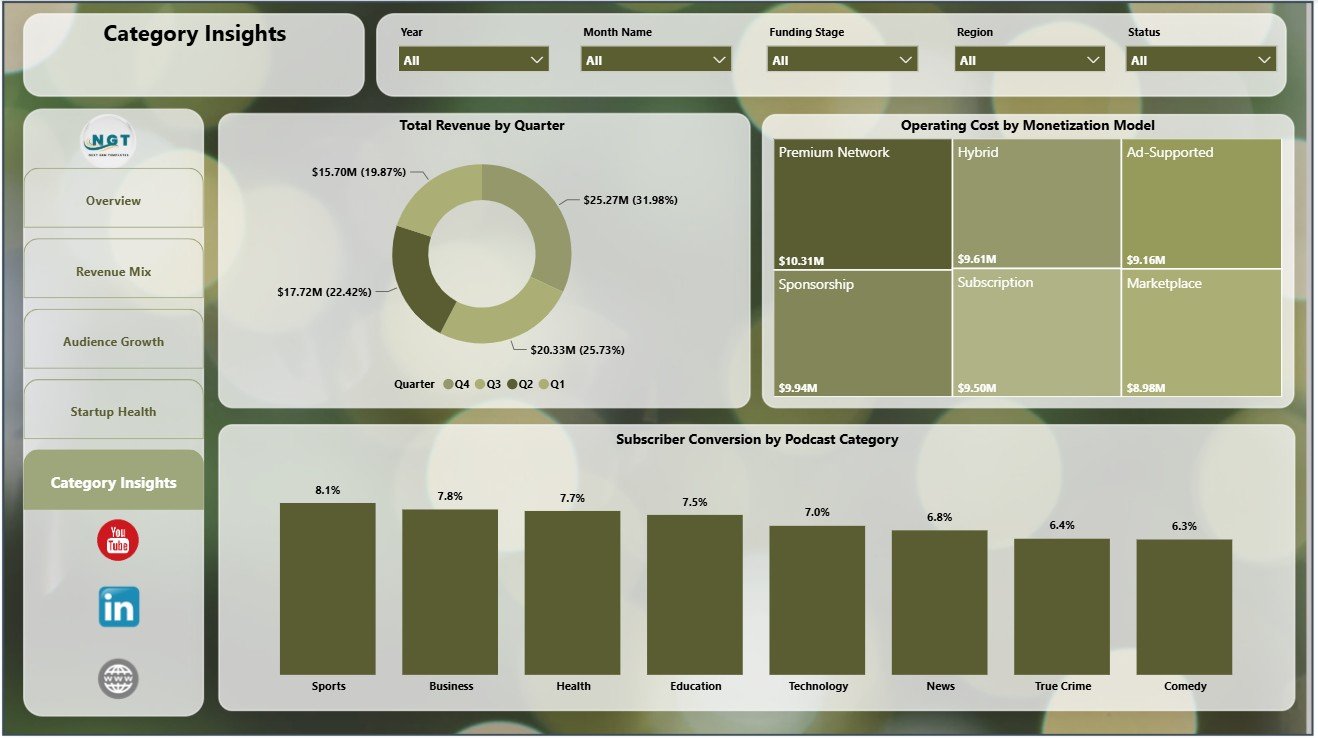
Category Insights
Podcast Monetization Startups Dashboard in Power BI vs. Tableau vs. Paid CRM/SaaS – Feature Comparison
| Feature | Podcast Monetization Startups Dashboard in Power BI | Tableau or Qlik alternative | Paid podcast SaaS |
|---|---|---|---|
| Cost | $17.99 one-time sale price | License cost plus report build time | Monthly or annual subscription |
| Platform | Power BI Desktop and optional Power BI Service | BI platform setup required | Vendor cloud platform |
| Setup time | Open PBIX, replace source, refresh | Build model, measures, and visuals manually | Onboarding and integrations |
| Real-time team collaboration | Available after publishing to Power BI Service | Available by plan | Usually included by plan |
| Mobile access | Available through Power BI mobile after publishing | Available through vendor app | Usually included |
| Customizable fields | Edit model, visuals, slicers, measures, and pages | Editable with BI skills | Often limited by vendor settings |
| Share with link | Available through workspace permissions | Available through platform permissions | Usually login controlled |
| Year-1 cost at 5 users | Template cost plus Microsoft licensing choice | License cost plus analyst time | Often hundreds or thousands per year |
| Podcast monetization views | Revenue, cost, profit, subscribers, listeners, channels, models, funding, category, region, and status | Must be designed manually | Depends on reporting module |
Who Should Use This Template
This template is a good fit for podcast startup founders, media startup teams, creator economy analysts, podcast agencies, investor reporting teams, accelerators, and consultants who already maintain structured podcast monetization data and want a Power BI reporting layer.
It is not the right fit if you need podcast hosting, ad serving, automatic attribution, CRM follow-up, accounting, payment processing, or direct platform imports. This is an analytics dashboard template, not a transaction system or live podcast operations platform.
Real-World Use Cases
Maya, podcast startup founder: Maya reviews Total Revenue, Operating Cost, and Net Profit before deciding whether to scale sponsor outreach or reduce production spend.
Rahul, creator economy analyst: Rahul compares paid subscribers by region, subscriber conversion by category, and net profit by podcast category before preparing an investor update.
Elena, podcast agency manager: Elena filters the dashboard by channel and monetization model during client review meetings to explain where audience growth is creating profitable revenue.
Advantages of Podcast Monetization Startups Dashboard in Power BI
- It gives podcast teams a ready report structure instead of starting with a blank PBIX file.
- It connects revenue, cost, profit, listeners, subscribers, funding, channel, model, region, and category analysis in one report.
- It can be refreshed when new source records are connected or loaded.
- It is editable in Power BI Desktop, so analysts can change visuals, measures, colors, and data connections.
- It supports recurring founder, agency, accelerator, and investor reviews because the same metrics can be compared consistently.
Opportunities for Improvement
- Add clear KPI definitions for profit margin, subscriber conversion, active startup status, net profit, and operating cost.
- Keep startup names, regions, funding stages, monetization models, channels, and podcast categories consistent before refreshing the report.
- Connect exported data from podcast hosting, ad sales, subscription, and finance tools once the team is ready for a more automated workflow.
- Document any custom DAX measures added after purchase so future users understand the calculations.
Best Practices
- Keep source columns consistent with the sample structure before refreshing the report.
- Use the same naming conventions for startup, channel, category, region, funding stage, and monetization model values.
- Validate Total Revenue, Operating Cost, Net Profit, and Active Startups after replacing the sample source.
- Use slicers during review meetings instead of duplicating separate pages for every segment.
- Publish to Power BI Service only after checking workspace permissions, privacy settings, and data governance requirements.
Explore Relevant Templates
- Podcast Monetization Startups Dashboard in Power BI
- Podcast Monetization Startups Dashboard in Excel
- Podcast Audience Insights Dashboard in Google Sheets
- Audio Streaming Services Dashboard in Excel
- Browse Power BI Dashboard templates
Frequently Asked Questions
What does the Podcast Monetization Startups Dashboard in Power BI track?
It tracks total revenue, total startups, operating cost, net profit, active startups, funding stage, monetization model, month, profit margin, region, primary channel, monthly listeners, status, paid subscribers, podcast category, quarter, and subscriber conversion.
How many pages are included?
The report includes 5 Power BI pages: Overview Page, Revenue Mix, Audience Growth, Startup Health, and Category Insights.
Do I need Power BI Desktop?
Yes. Power BI Desktop is required to open and edit the PBIX file. Power BI Service is optional if you want browser access, sharing, or scheduled refresh.
Can I use my own podcast startup data?
Yes. Replace or connect the sample source with your structured podcast startup data, then refresh the report.
Can I customize the report?
Yes. You can edit pages, visuals, colors, fields, slicers, measures, labels, and data connections in Power BI Desktop.
Does this replace podcast analytics software?
No. It is a reporting dashboard template, not a podcast host, ad server, attribution platform, payment processor, CRM, or live operations system.
About the Author
Built by PK – Microsoft Certified Professional with 15+ years of Excel, Google Sheets, and Power BI experience. Founder of NextGenTemplates, reaching 300K+ subscribers across YouTube channels. Every template is hand-built and tested before release.
Conclusion
The Podcast Monetization Startups Dashboard in Power BI gives podcast startup teams a practical way to review revenue, operating cost, net profit, listeners, paid subscribers, funding stages, status, channel performance, monetization models, regions, and category conversion in one editable report. It is a strong fit when you already have structured data and need a faster way to turn it into recurring management insight.
For more tutorials, visit YouTube.com/@PKAnExcelExpert.
Last updated: July 26, 2026