In today’s data-driven education sector, maintaining financial health is more important than ever. Institutions must continuously evaluate their fiscal performance to ensure long-term sustainability and growth. One of the most effective tools to do this is by using an Education and Learning Financial Health KPI Dashboard in Excel.
This ready-to-use template offers comprehensive visibility into all essential financial KPIs, allowing educational organizations to monitor their performance monthly and annually. From tuition revenue to grant utilization, the dashboard helps turn complex data into actionable insights.
Click to Purchases Education and Learning Financial Health KPI Dashboard in Excel
What is the Financial Health KPI Dashboard in Excel?
The Education and Learning Financial Health KPI Dashboard in Excel is a pre-built, interactive tool that enables users to:
- Track monthly and yearly financial performance
- Compare actual values with targets and previous year data
- Visualize trends using dynamic charts
- Manage KPI definitions and targets centrally
This dashboard is designed to be used by school administrators, financial officers, and education sector stakeholders who want to ensure financial transparency, efficiency, and accountability.
Key Worksheets Included in the Dashboard
The dashboard includes 7 structured worksheets, each designed for specific functions:
Home Sheet
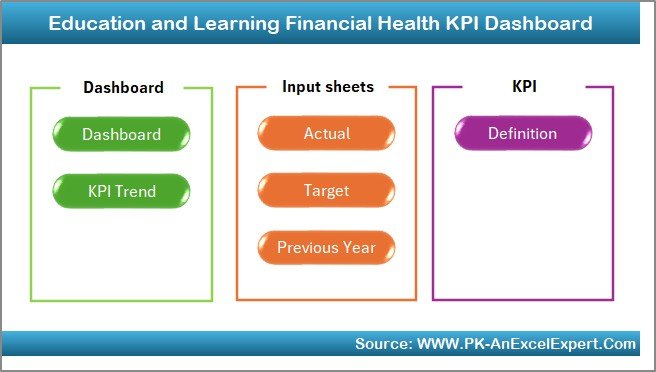
This is the central navigation panel. With 6 buttons provided, users can quickly jump to:
- Dashboard
- KPI Trend
- Actual Numbers Input
- Target Sheet
- Previous Year Numbers
- KPI Definition
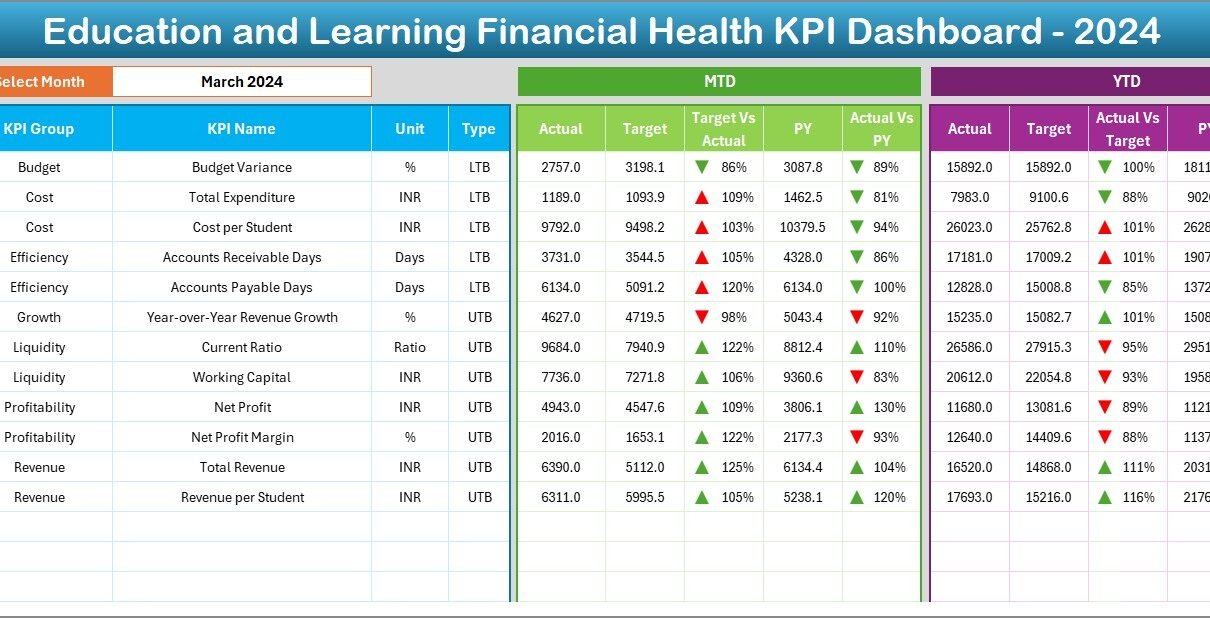
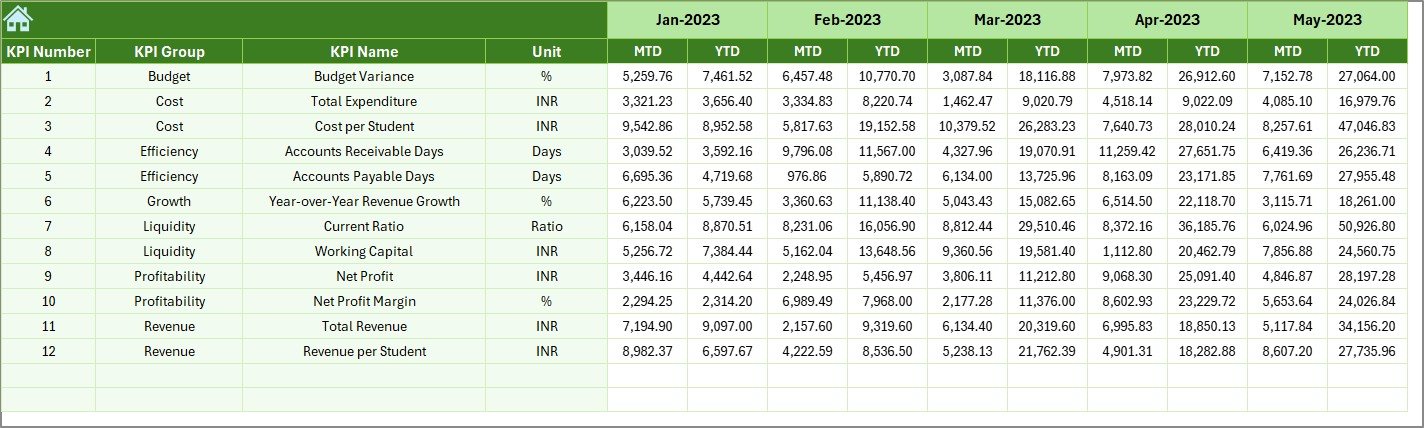
Dashboard Sheet Tab
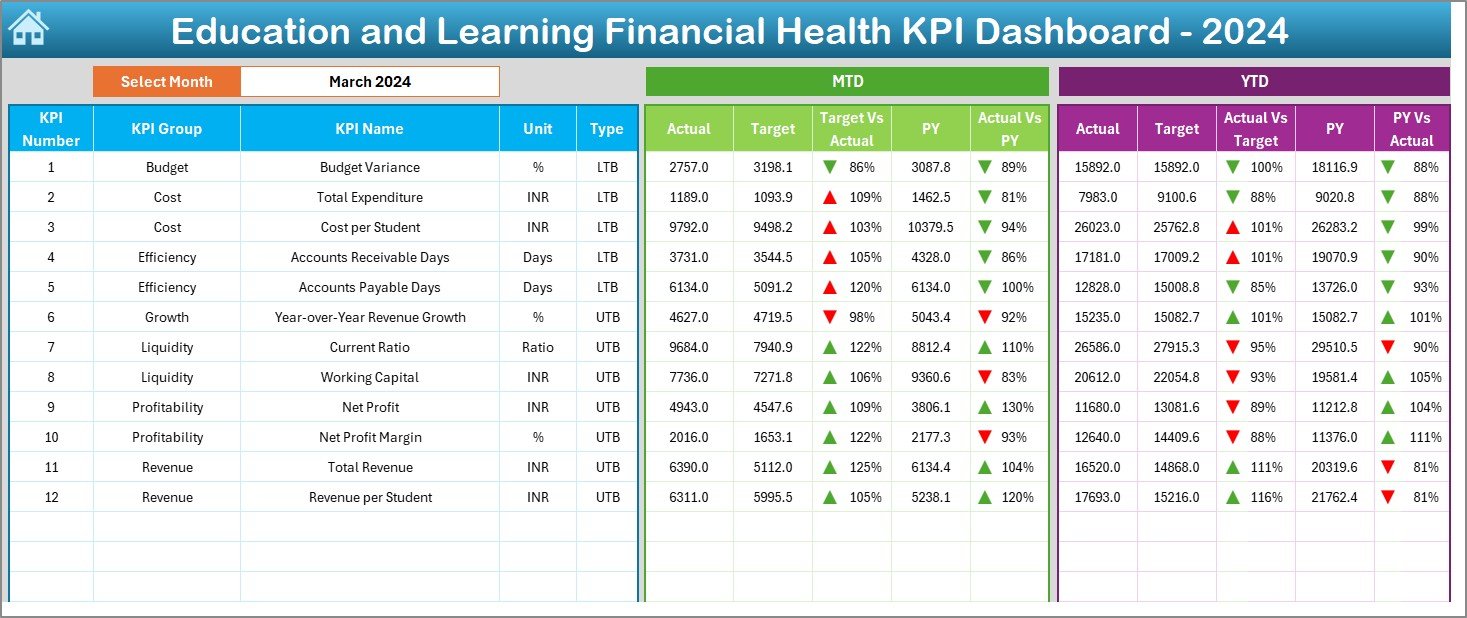
This sheet presents a comprehensive overview of all KPIs:
- MTD and YTD Performance: View current month and year-to-date actuals, targets, and previous year comparisons.
- Conditional Formatting: Visual up/down arrows for quick trend recognition.
- Dropdown Selection: Change the month using a dropdown in cell D3 to dynamically update metrics.
Click to Purchases Education and Learning Financial Health KPI Dashboard in Excel
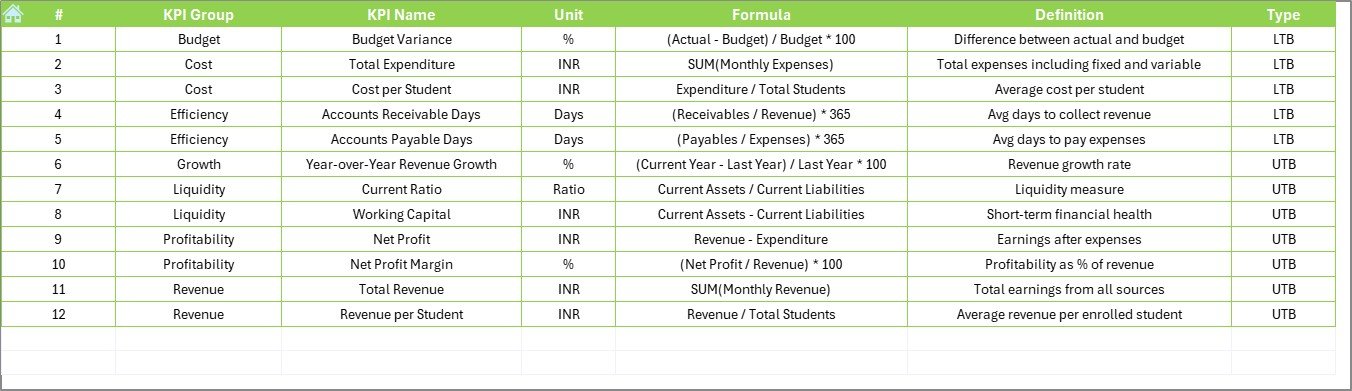
KPI Trend Sheet Tab
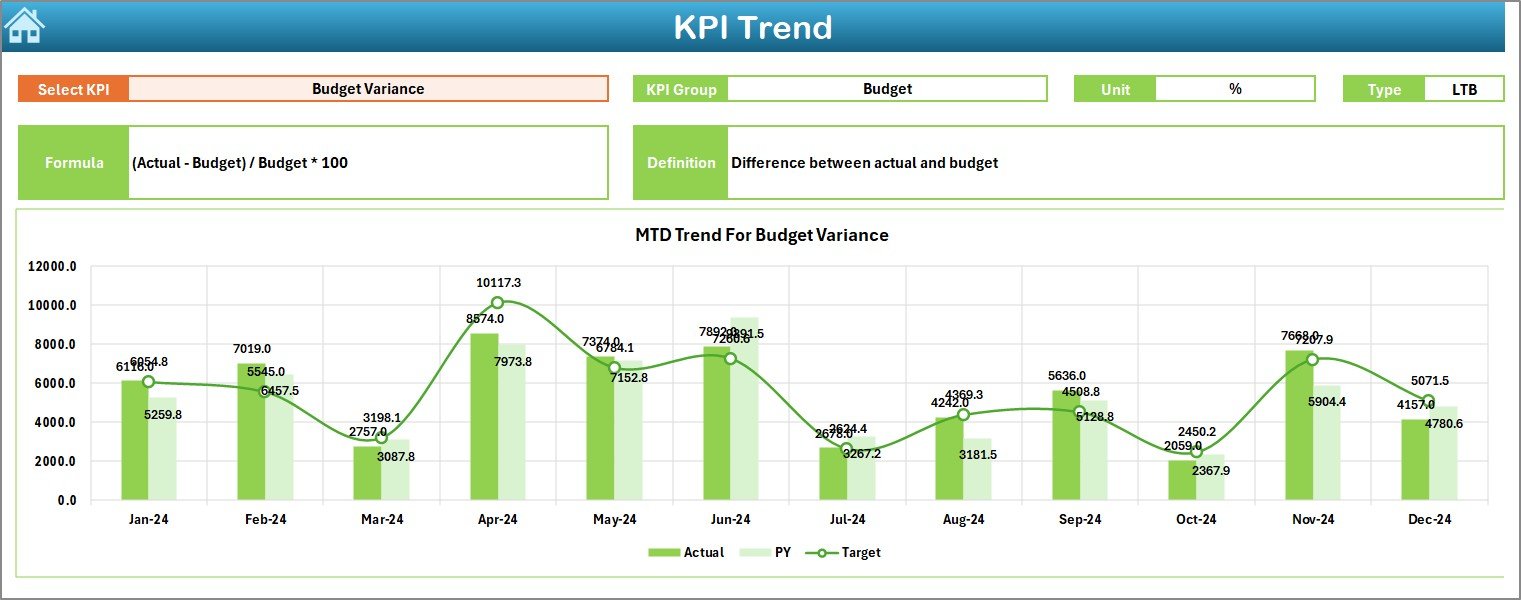
Dive deeper into individual KPIs:
- Select a KPI from the dropdown in cell C3.
- See trend lines for Actual vs. Target vs. Previous Year.
- Display supporting information like KPI Group, Unit, Type (UTB or LTB), Formula, and Definition.
Actual Numbers Input Sheet
Easily input actual values:
- Change the base month from cell E1.
- Enter MTD and YTD numbers for each KPI.
Target Sheet Tab
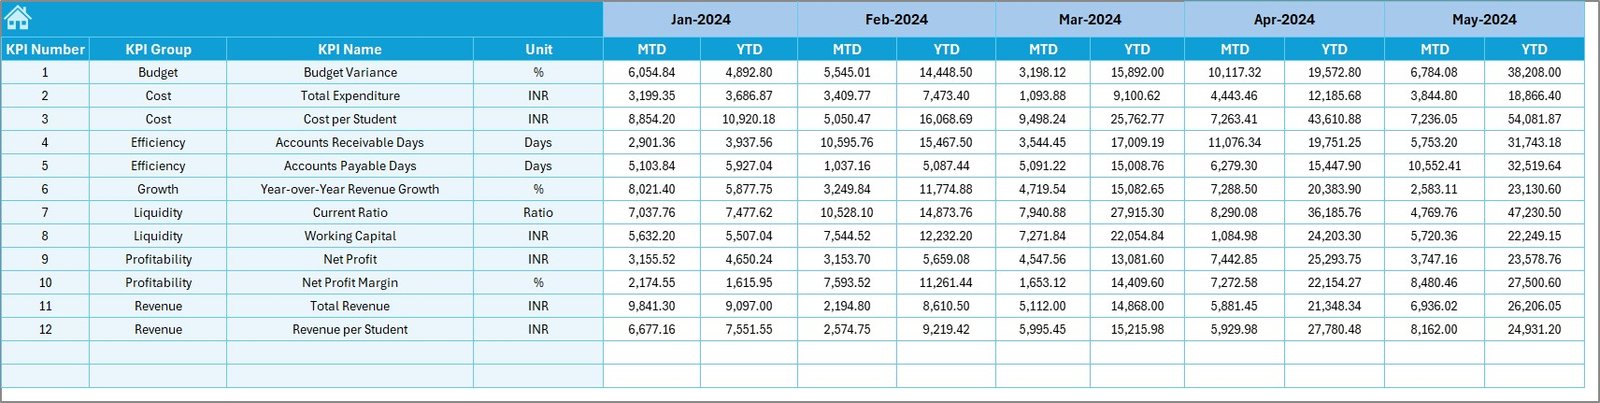
Set and manage performance goals:
- Input monthly targets for MTD and YTD for each KPI.
Previous Year Numbers Sheet
Ensure accurate comparisons:
- Record previous year’s monthly and annual data for each KPI.
Click to Purchases Education and Learning Financial Health KPI Dashboard in Excel
KPI Definition Sheet
Standardize your KPIs:
- Maintain a list with KPI Name, Group, Unit, Formula, and Definitions.
Advantages of the Financial Health KPI Dashboard
✅ Real-time Monitoring
You can easily track monthly and yearly financial performance without any manual calculation.
✅ Data-Driven Decisions
The dashboard empowers leadership to make informed decisions based on trends and target gaps.
✅ Time-Saving Automation
You no longer need to update multiple files. Just update your data sheets and the dashboard auto-refreshes.
✅ Centralized Information
All KPI-related information including targets, actuals, previous year data, and definitions are managed in one file.
✅ Easy to Use and Customize
This Excel-based solution requires no complex software. You can easily expand or modify it as per your institution’s requirements.
Best Practices for Using the KPI Dashboard
To get the most out of your dashboard, follow these best practices:
1. Define Clear KPIs
Start by identifying KPIs that are most relevant to your institution’s financial goals.
2. Keep Data Entry Consistent
Always input data in the correct format and time frame to avoid inconsistencies.
3. Review Monthly
Set a calendar reminder to update and review the dashboard every month for better financial control.
4. Use Comments or Notes
Explain any anomalies or sudden changes using Excel notes or comment features.
5. Train Your Team
Ensure key personnel know how to navigate and update the dashboard to maintain accuracy and continuity.
Why Should Educational Institutions Track Financial KPIs?
Educational institutions operate under budget constraints and must manage resources carefully. Tracking KPIs like “Tuition Fee Collection Rate” or “Operational Cost per Student” provides transparency and identifies areas for improvement.
Additionally, monitoring financial health KPIs helps:
- Build trust with stakeholders
- Improve budgeting and forecasting
- Ensure compliance with funding and audit standards
Most Common KPIs in the Dashboard
Here are some of the core financial KPIs included in the template:
- Tuition Fee Collection Rate
- Operational Cost per Student
- Faculty Salary to Total Expense Ratio
- Grant Utilization Percentage
- Monthly Revenue Growth
- Year-on-Year Budget Variance
- Debt to Income Ratio
- Cash Flow per Student
- Expenditure per Program
- Cost Recovery Ratio
Each KPI clearly defines whether it is UTB (Upper the Better) or LTB (Lower the Better), making it easy to analyze performance.
How to Get Started with the Dashboard
Getting started is simple:
- Open the Excel file and go to the Home sheet.
- Click the Actual Numbers Input tab and enter current month data.
- Set your targets and previous year figures.
- Select a month on the Dashboard tab to view insights.
- Explore trends on the KPI Trend tab.
With just a few updates every month, you will have a powerful financial performance tracking system.
Click to Purchases Education and Learning Financial Health KPI Dashboard in Excel
How This Dashboard Benefits Different Roles
💼 Finance Managers
Easily track cost efficiency, revenue, and cash flow.
🏫 School Administrators
Get quick insights on how budget aligns with actual performance.
📈 Grant Managers
Monitor fund utilization and ensure compliance.
✍️ Policy Makers
Make data-backed decisions for better allocation of educational resources.
Conclusion
The Education and Learning Financial Health KPI Dashboard in Excel is a game-changer for any institution that wants to stay financially healthy. It brings all your financial performance indicators into one interactive and user-friendly file.
From monthly updates to YTD trend analysis, this dashboard simplifies financial tracking, making it a must-have tool in today’s education system.
Start using it today to gain clarity, control, and confidence in your financial decisions.
Frequently Asked Questions (FAQs)
Q1: Is this dashboard suitable for small schools?
Yes. The dashboard is scalable and works well for both small schools and large universities.
Q2: Can I add more KPIs?
Absolutely. You can insert new rows in the KPI Definition and Data sheets to add more KPIs.
Q3: What Excel version do I need?
Excel 2016 or later is recommended for best compatibility with charts and slicers.
Q4: Is this dashboard formula-based or uses VBA?
It is fully formula-based. No macros are used, making it more secure and easier to maintain.
Q5: Can I customize the color theme?
Yes. You can change themes using Excel’s built-in formatting and design options.
Click to Purchases Education and Learning Financial Health KPI Dashboard in Excel
Visit our YouTube channel to learn step-by-step video tutorials