In today’s fast-evolving educational landscape, sustainability plays a vital role in ensuring long-term impact and continuous improvement. Institutions, whether schools, universities, or training centers, are under increasing pressure to demonstrate the effectiveness and sustainability of their learning initiatives. That’s where a Education and Learning Sustainability KPI Dashboard in Excel becomes an essential tool.
This comprehensive guide will walk you through everything you need to know about creating and using this powerful Excel-based dashboard. From its core features to its benefits and best practices, you will find practical insights to help you use data to make smarter decisions.
Click to Purchases Education and Learning Sustainability KPI Dashboard in Excel
What is an Education and Learning Sustainability KPI Dashboard?
An Education and Learning Sustainability KPI Dashboard in Excel is a dynamic reporting tool that tracks and visualizes key performance indicators (KPIs) related to learning outcomes, resource efficiency, student engagement, and institutional sustainability.
The dashboard provides a centralized view of:
- Monthly and Year-to-Date (MTD/YTD) actuals and targets
- Comparisons with previous year data
- Visual charts and trends
- KPI definitions and types (UTB or LTB)
It allows education leaders to measure effectiveness, identify gaps, and continuously improve educational sustainability.
Key Features of the Education and Learning Sustainability KPI Dashboard
This Excel-based dashboard includes 7 structured worksheet tabs:
Home Sheet
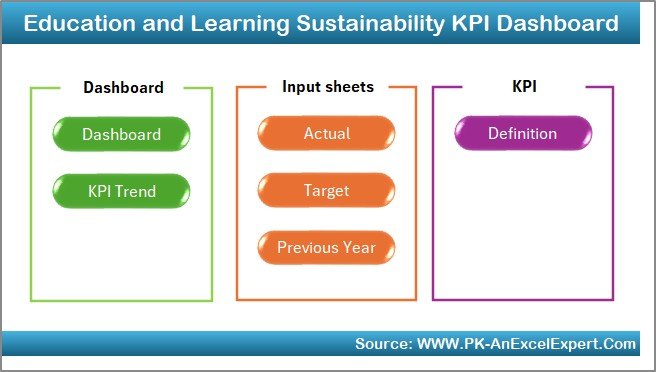
- Acts as an index page
- Includes 6 navigation buttons to jump to specific sheets instantly
Click to Purchases Education and Learning Sustainability KPI Dashboard in Excel
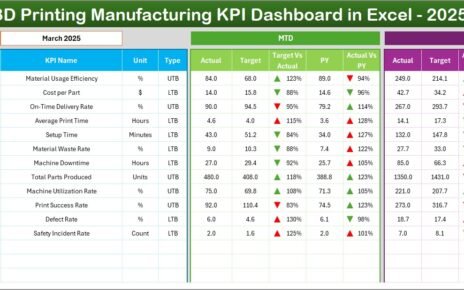
Dashboard Sheet
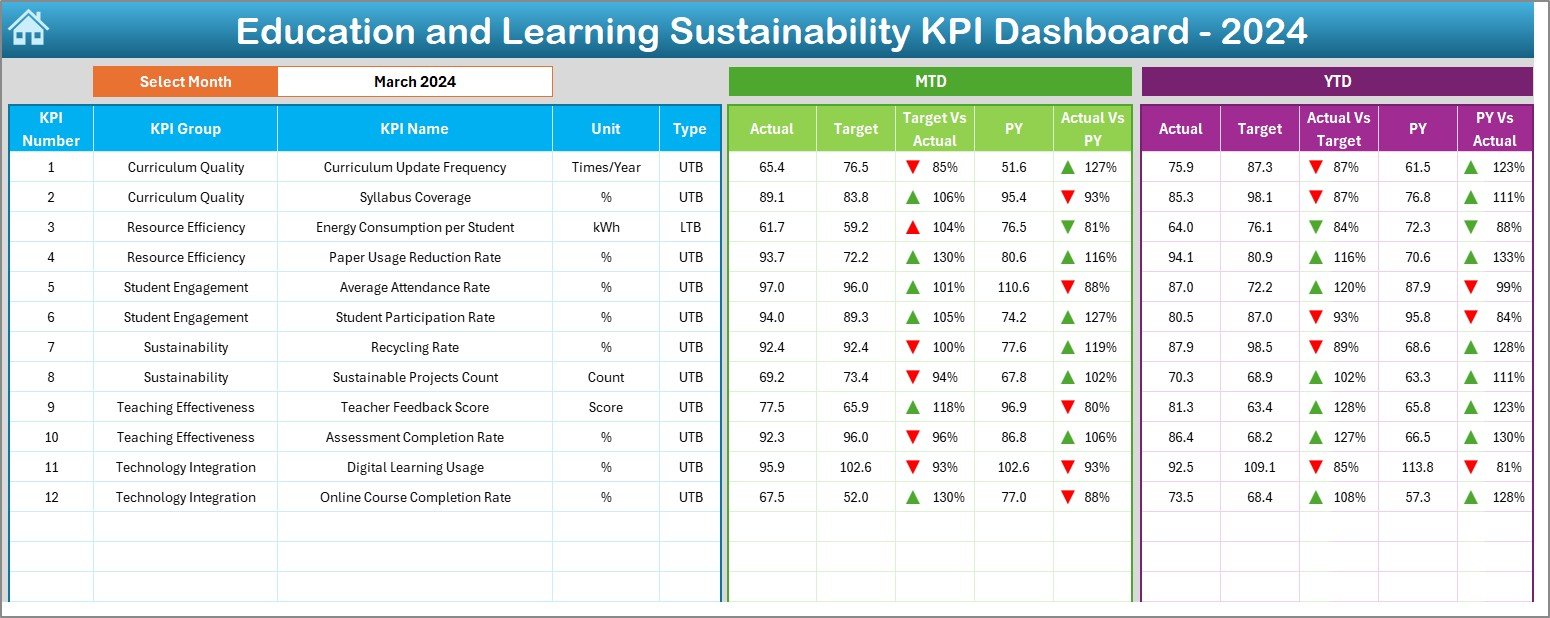
- Main sheet with full visualization
- Month selector (D3) updates all dashboard data
- Shows MTD Actual, Target, Previous Year data
- Includes conditional formatting with up/down arrows for Target vs Actual and PY vs Actual
- Displays YTD metrics with the same comparative insights
KPI Trend Sheet
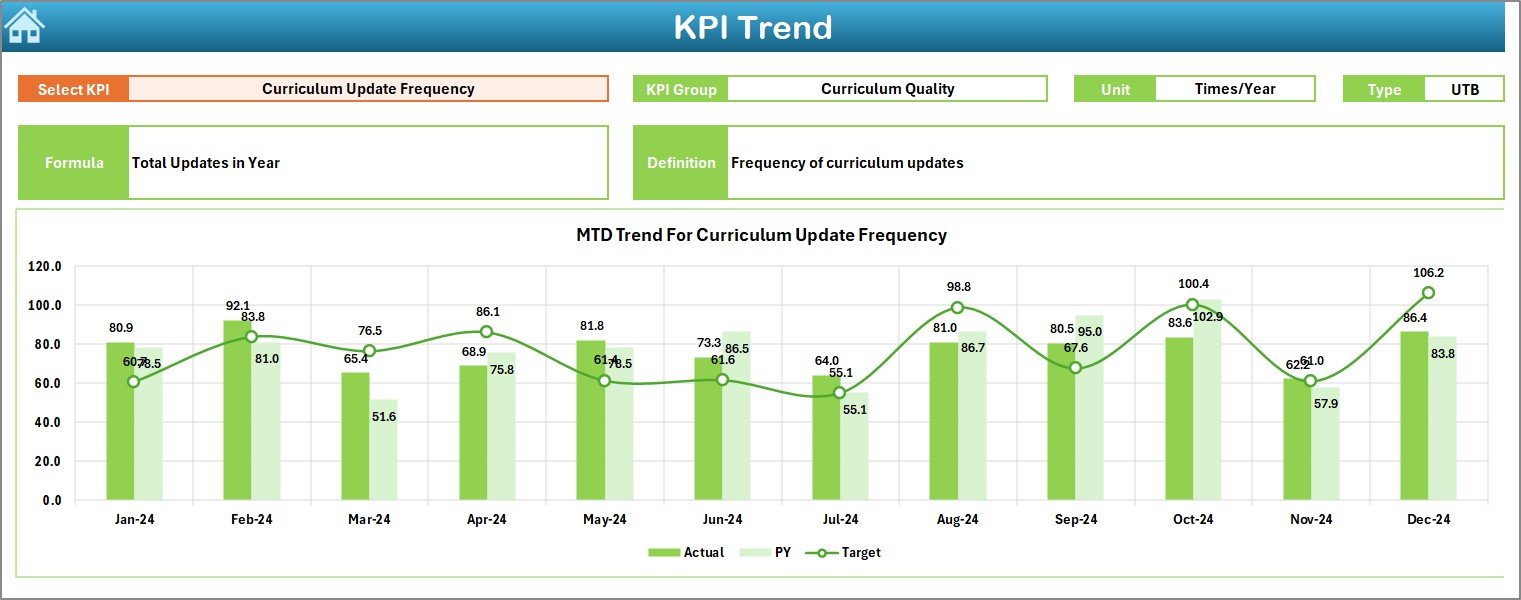
- Dropdown in cell C3 allows KPI selection
- Displays group, unit, type (UTB/LTB), formula, and definition
- Shows both MTD and YTD trend charts for Actual, Target, and Previous Year
Actual Numbers Input Sheet
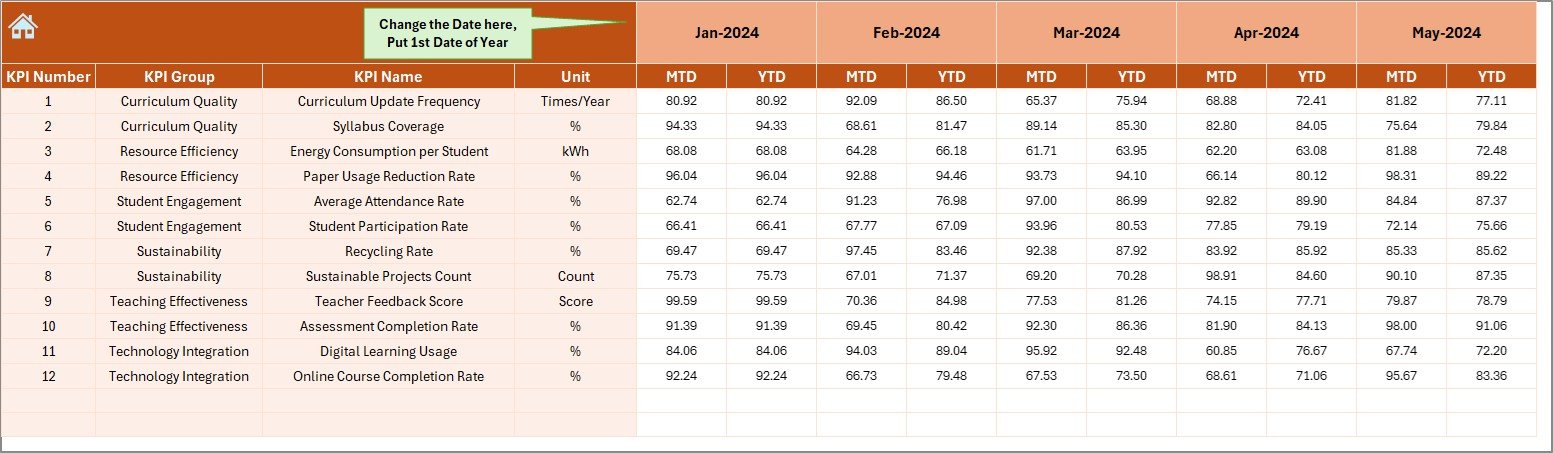
- Input actual numbers for MTD and YTD by month
- Set the start of the year in cell E1 to update month sequence
Target Sheet
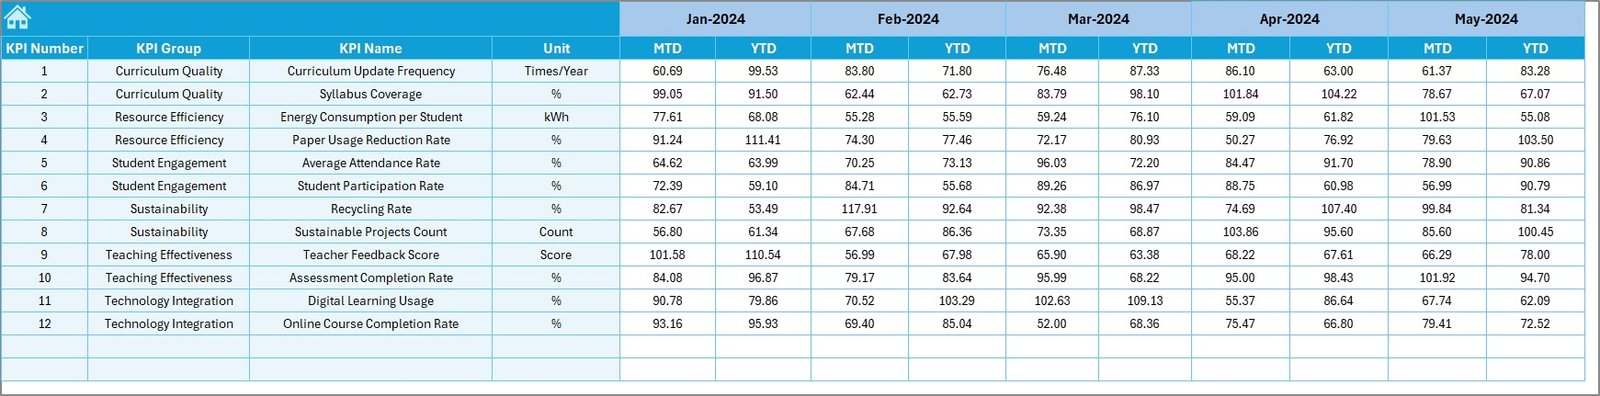
- Input monthly MTD and YTD targets for each KPI
Previous Year Sheet
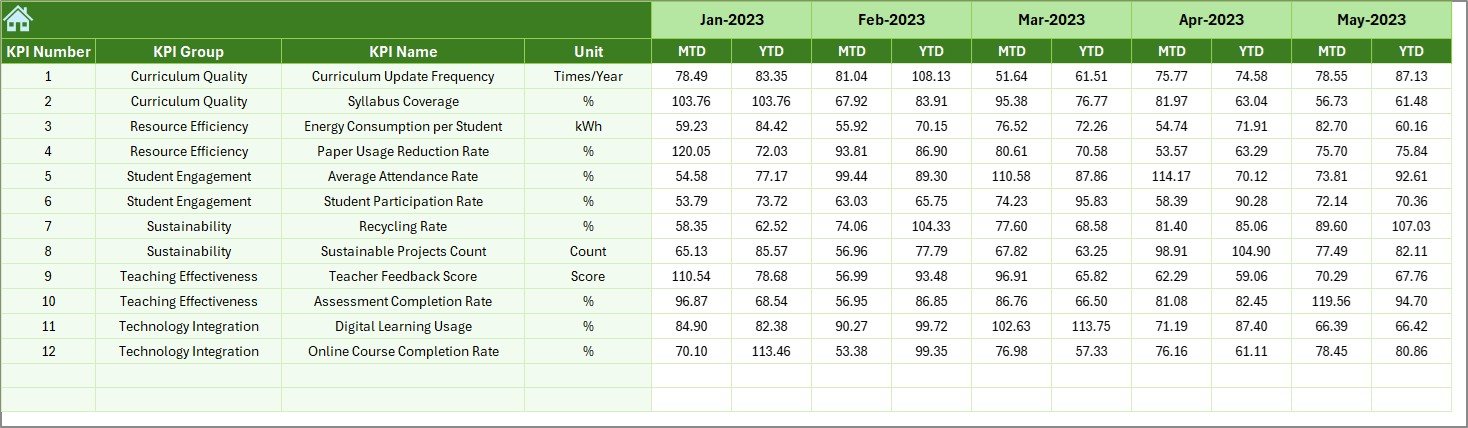
- Enter corresponding monthly data for the previous year
KPI Definition Sheet
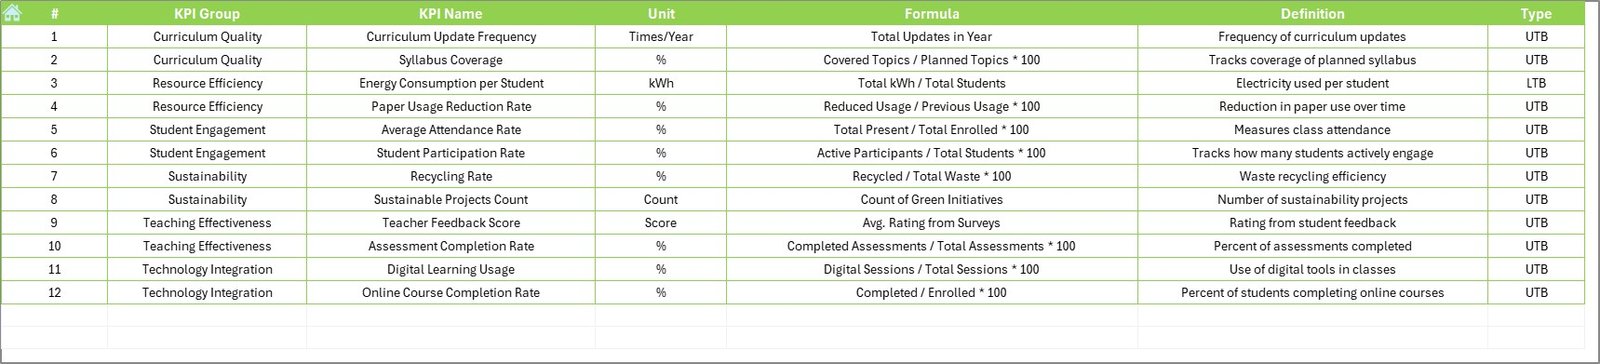
- Log KPI Name, Group, Unit, Formula, and clear definition
Why Should You Use This Dashboard?
This dashboard transforms complex data into actionable insights. Whether you’re a school principal, academic coordinator, or data analyst, it helps you:
- Monitor student performance and resource utilization
- Improve course delivery and content planning
- Track progress toward institutional sustainability goals
- Make informed decisions based on past and present trends
Click to Purchases Education and Learning Sustainability KPI Dashboard in Excel
Advantages of Education and Learning Sustainability KPI Dashboard
📊 Data-Driven Decision Making
It provides instant access to insights that drive educational and administrative decisions.
📊 Customizable and Scalable
Built in Excel, it can be easily adapted to different institutions or education levels.
📊 Monthly Monitoring
Compare current performance with targets and previous year data in real-time.
📊 KPI Trend Visualization
Understand the progress or decline of key metrics over time with charts.
📊 Simple Data Entry
User-friendly input sheets reduce the chances of data errors.
Best Practices for Using the Dashboard
To make the most out of your dashboard, follow these best practices:
✅ Define Clear KPIs
Start by defining clear and measurable KPIs in the “KPI Definition Sheet.”
✅ Maintain Data Consistency
Ensure that monthly data entry follows a consistent format in both actual and target sheets.
✅ Use Conditional Formatting Wisely
Avoid overuse but keep it for key indicators like performance gaps.
✅ Regularly Update the Dashboard
Update MTD and YTD data monthly for accurate tracking.
✅ Train Stakeholders
Educate teachers and administrators on how to read and interpret the dashboard.
✅ Review Trends
Use the trend charts to identify long-term patterns and adjust strategies accordingly.
🔹 Important KPIs to Track
Here are some essential KPIs for learning sustainability:
- Student Retention Rate (UTB)
- Graduation Rate (UTB)
- Teacher-to-Student Ratio (LTB)
- Digital Resource Usage (UTB)
- Energy Consumption per Student (LTB)
- Curriculum Completion Rate (UTB)
- Student Satisfaction Score (UTB)
- Training Hours per Teacher (UTB)
- Dropout Rate (LTB)
- Classroom Utilization Rate (UTB)
These KPIs help evaluate both academic success and environmental/resource efficiency.
How to Customize This Dashboard for Your Institution?
Customizing the dashboard for your educational institution is simple:
- Rename KPI Groups based on your needs (e.g., Academic, Sustainability, Operations)
- Add or Remove KPIs using the KPI Definition Sheet
- Modify Charts in the dashboard using Excel’s built-in chart tools
- Update Monthly Labels starting from E1 in the Actual Numbers Input sheet
- Integrate Your Branding by adding logos or colors matching your theme
Common Mistakes to Avoid
Here are a few pitfalls you should be aware of:
- Skipping monthly updates – leads to inaccurate reporting
- Ignoring YTD trends – may hide performance declines
- Poorly defined KPIs – result in misleading conclusions
- Overloading the dashboard – too much data can confuse rather than clarify
Who Can Use This Dashboard?
This dashboard serves a wide audience, including:
- School Principals and Administrators
- University Deans and Faculty Heads
- Educational NGOs
- Government Education Departments
- Corporate Training Managers
Real-World Use Case Example
Let’s say a university wants to evaluate the sustainability of their e-learning programs. By using this dashboard:
- They monitor digital resource usage monthly
- Compare the dropout rate vs. last year
- Track MTD/YTD course completion targets
- Identify whether new digital tools improve student satisfaction
Within a few months, leadership has actionable insights to improve online education delivery and reduce dropout rates.
Conclusion
The Education and Learning Sustainability KPI Dashboard in Excel is not just another spreadsheet—it’s a strategic asset. By focusing on MTD/YTD metrics, comparing performance with targets, and tracking trends, institutions can drive continuous improvement in both learning outcomes and sustainability initiatives.
Whether you manage a school, a university, or a training program, this dashboard will empower you to make smarter, faster, and more impactful decisions.
Frequently Asked Questions (FAQs)
1. What is the purpose of this dashboard?
It helps track and visualize KPIs for monitoring educational performance and sustainability in one place.
2. Can I use this dashboard in Google Sheets?
Although designed for Excel, you can convert it to Google Sheets with some adjustments to formulas and charts.
3. How many KPIs can I track?
There is no strict limit. However, for clarity, tracking around 10–20 KPIs is ideal.
4. Is this dashboard suitable for schools and colleges?
Yes, it works well for schools, colleges, universities, and even private training institutes.
5. Can I modify the structure of the sheets?
Absolutely! Since it’s Excel-based, you can add or delete sheets, KPIs, and visuals as needed.
6. How often should I update the dashboard?
You should update it monthly for MTD and YTD data to get accurate and timely insights.
Click to Purchases Education and Learning Sustainability KPI Dashboard in Excel
Visit our YouTube channel to learn step-by-step video tutorials