In today's rapidly evolving IT landscape, effective IT operations management plays a crucial role in ensuring that technology services run
In the fast-paced world of IT service management, staying organized is not just an advantage—it's a necessity. Whether you're managing
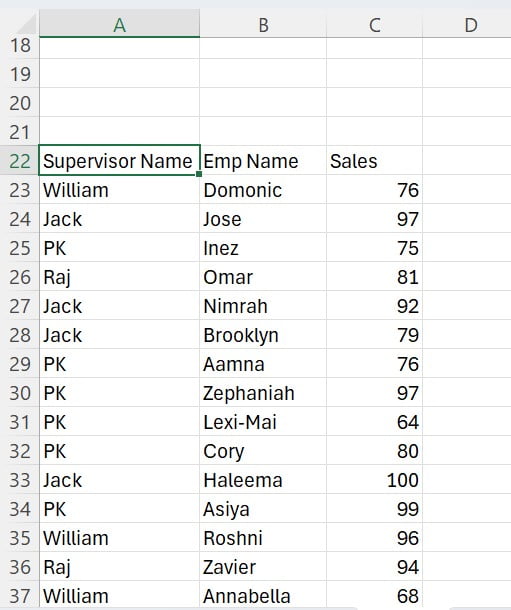
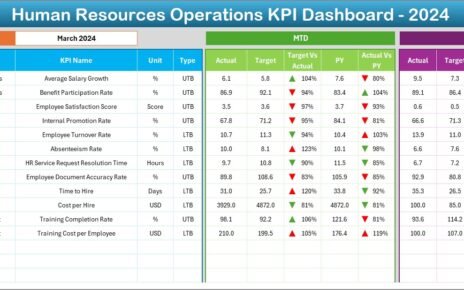
Managing a Human Resources (HR) department without clear insights is like sailing without a compass. You can make decisions, but