Risk management plays a critical role in finance and accounting. Without robust tracking tools, it becomes extremely difficult to identify potential financial threats, ensure compliance, and maintain operational efficiency. That’s where the Finance and Accounting Risk Management KPI Dashboard in Excel comes in. This ready-to-use, dynamic dashboard allows you to monitor, analyze, and act on key performance indicators (KPIs) that matter most to your finance team.
In this comprehensive guide, we’ll dive deep into how this dashboard works, its advantages, best practices for using it effectively, and answers to frequently asked questions. So, let’s get started!
Click to Purchases Finance and Accounting Risk Management KPI Dashboard in Excel
What is a Finance and Accounting Risk Management KPI Dashboard?
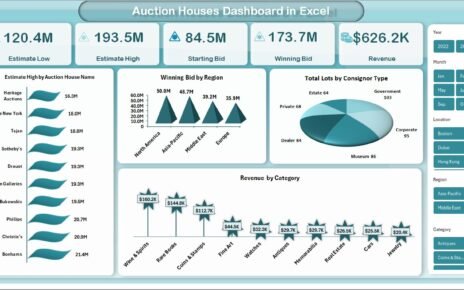
A Finance and Accounting Risk Management KPI Dashboard is an Excel-based tool that helps finance teams monitor various risk-related KPIs such as compliance rates, audit findings, variance metrics, fraud detection indicators, and more. It visualizes both monthly and yearly data, enabling proactive decision-making and risk mitigation.
Key Components of the Dashboard
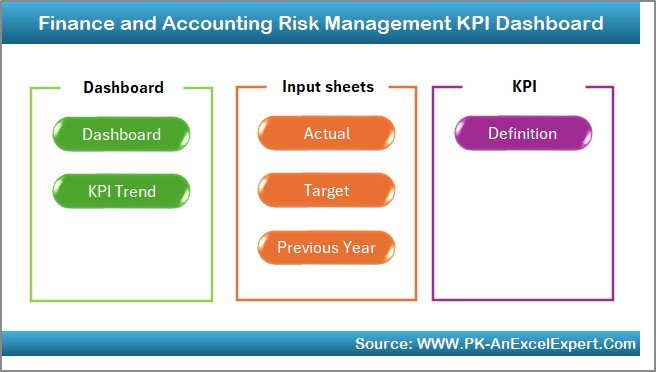
This powerful dashboard is divided into 7 structured worksheet tabs, each designed for a specific function:
Home Sheet
- Acts as an index page
- Contains 6 navigation buttons for easy access to other sheets
Dashboard Sheet
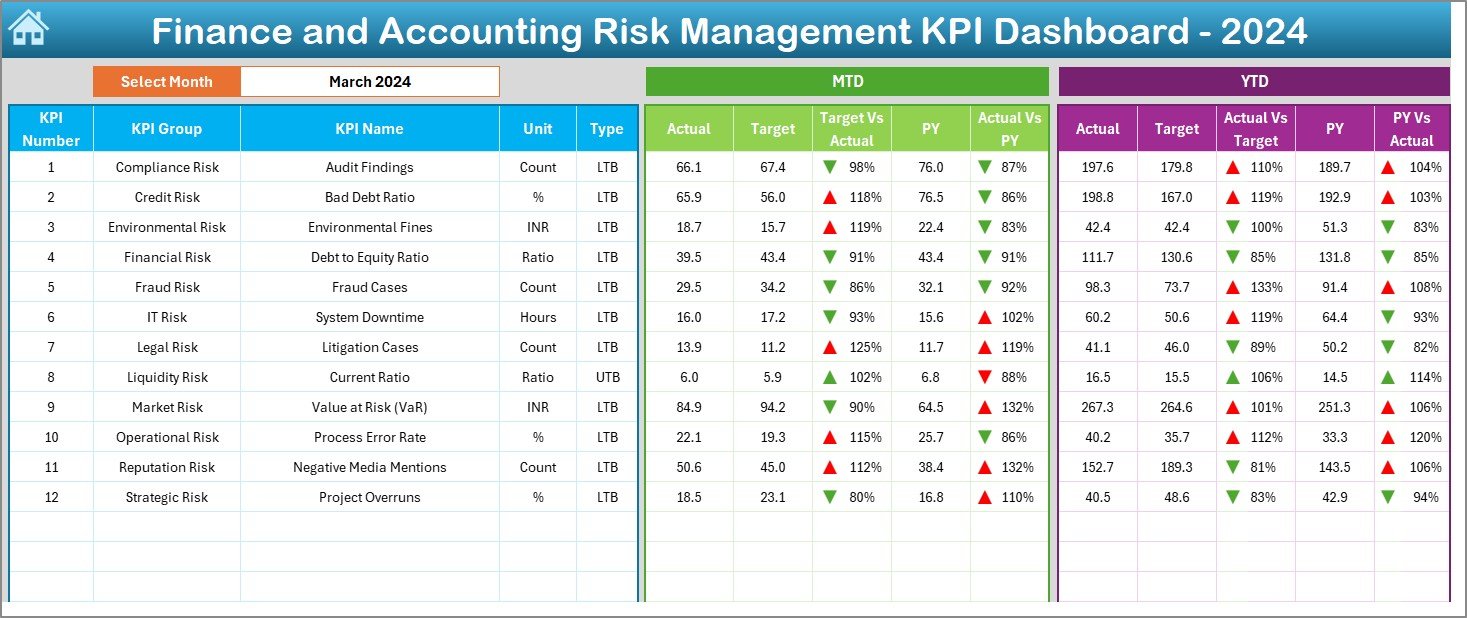
- The core visual interface for KPI monitoring
- Choose a month from a drop-down in cell D3
- Displays MTD (Month-to-Date) and YTD (Year-to-Date) values for:
- Actual
- Target
- Previous Year (PY)
- Includes conditional formatting with arrow indicators for performance trends
KPI Trend Sheet
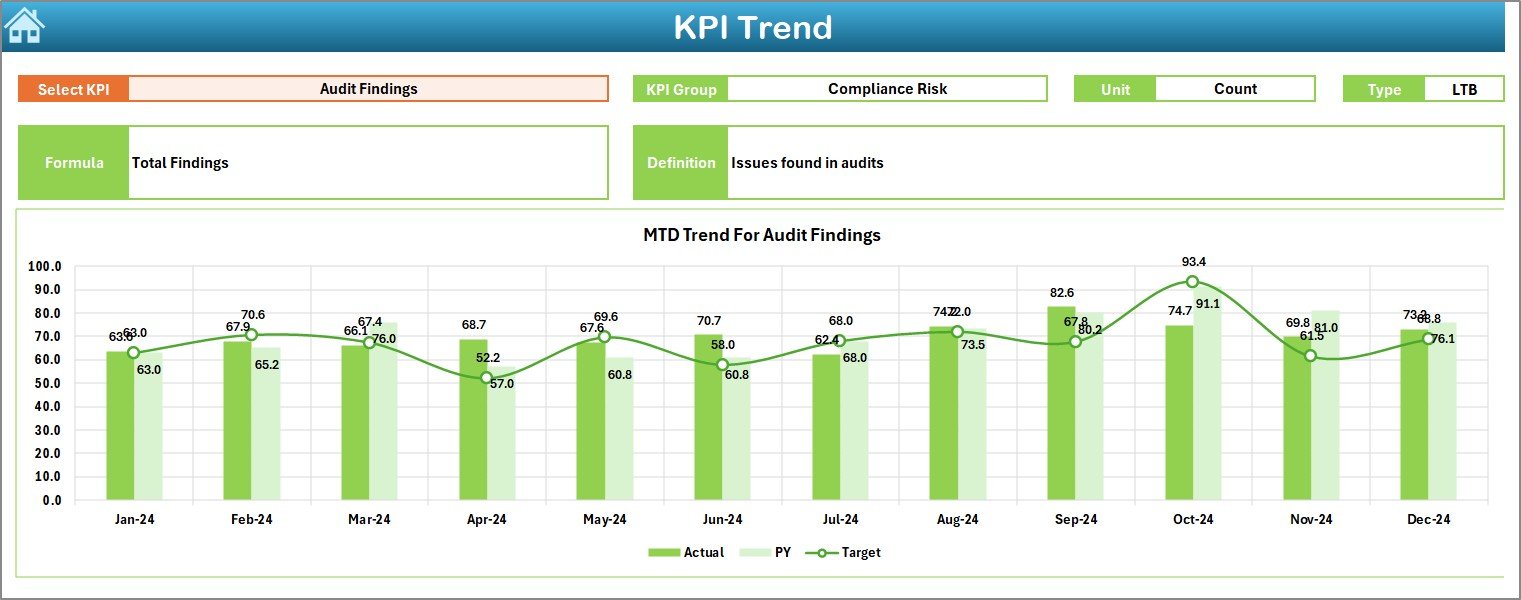
- Select the KPI from a drop-down in cell C3
- Displays:
- KPI Group
- Unit
- Type (UTB or LTB)
- Formula
- Definition
- Shows MTD and YTD trend charts comparing actual, target, and PY
Click to Purchases Finance and Accounting Risk Management KPI Dashboard in Excel
Actual Numbers Input Sheet
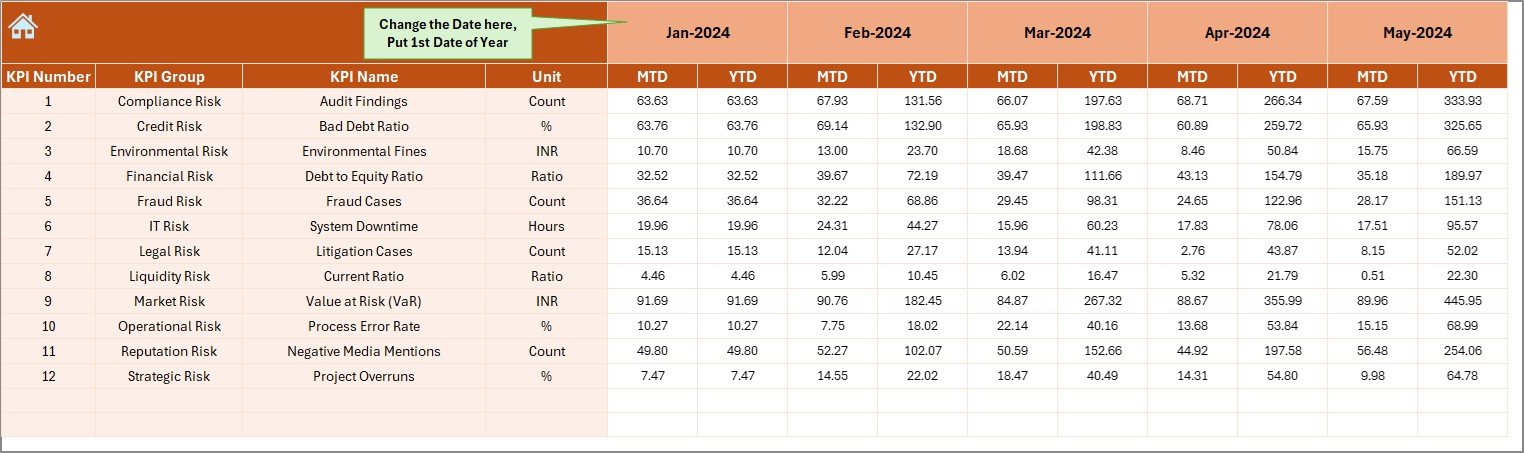
- Input actual MTD and YTD numbers
- Change the base month using cell E1
Target Sheet
- Enter monthly MTD and YTD targets for each KPI
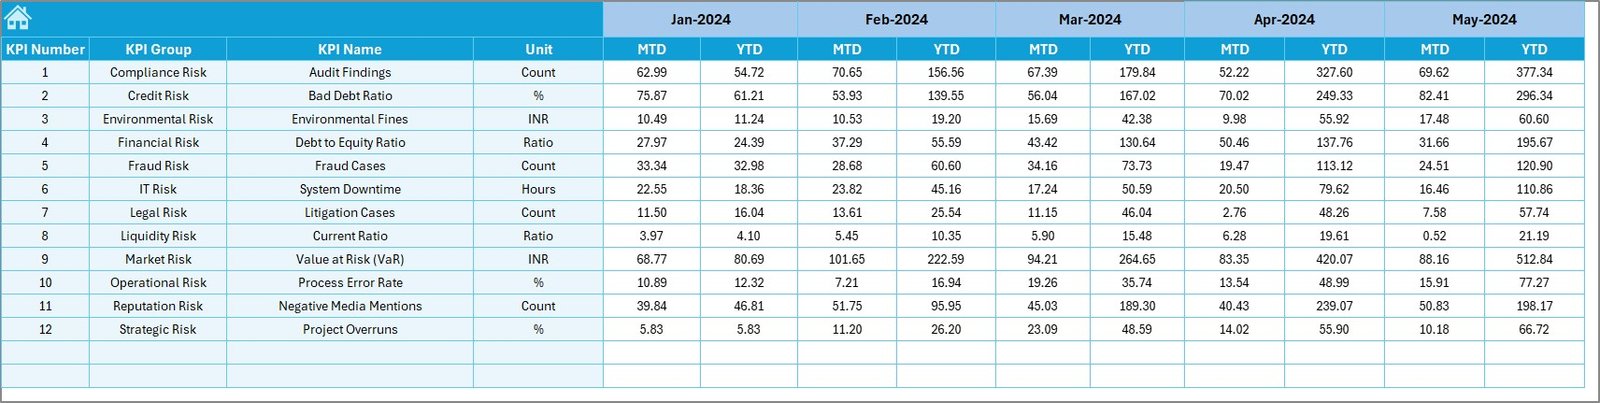
Previous Year Numbers Sheet
- Enter last year’s MTD and YTD values to compare performance over time
KPI Definition Sheet
- Document each KPI with:
- KPI Name
- KPI Group
- Unit
- Formula
- Definition
Advantages of Using a Risk Management KPI Dashboard
✅ Real-Time Visibility
Stay updated on risk-related KPIs with month-wise and year-to-date metrics.
✅ Data-Driven Decisions
With trends and comparison charts, make informed decisions faster and more confidently.
✅ Time Efficiency
Automated data inputs and visuals save hours of manual reporting work.
✅ Improved Risk Control
Track anomalies, fraud indicators, and compliance gaps proactively.
✅ Customization Flexibility
Easily adapt KPI formulas, target ranges, and visualization types to fit your needs.
Best Practices for Using the Dashboard
✉️ Keep KPIs Relevant
Only include KPIs directly related to finance and risk management such as:
- Budget Variance
- Audit Finding Rates
- Days Payable Outstanding (DPO)
- Fraud Detection Rate
📝 Maintain Monthly Updates
Update the Actual Numbers Input and Target Sheet regularly for meaningful insights.
⚙️ Use Drop-downs Effectively
Utilize the dropdown selectors to dynamically shift focus between KPIs or months.
✨ Avoid Overcrowding
Stick to 10–15 well-defined KPIs to avoid clutter and ensure clarity.
✏️ Document Everything
Maintain complete and clear documentation in the KPI Definition sheet for team understanding and audits.
Common KPIs to Track in Finance and Risk Management
- Budget Variance (%) – Measures deviation from planned budgets
- Compliance Rate (%) – Percentage of compliant operations
- Fraud Detection Rate – Number of fraud incidents identified
- Audit Finding Rate – Issues identified during internal audits
- Debt-to-Equity Ratio – Financial leverage of the company
- Cash Flow at Risk – Measures risk to liquidity from cash flow volatility
- Credit Risk Exposure – Total value at risk from credit defaults
- Days Sales Outstanding (DSO) – Efficiency of revenue collection
🔹 Why Excel for Risk KPI Dashboards?
While Power BI or Tableau are popular tools, Excel remains a go-to because:
- Most finance teams already use it
- It offers formulas, charts, conditional formatting, and VBA
- No learning curve for most users
- Easy to share via email or cloud
- Cost-effective solution for SMEs
🌐 How to Build the Dashboard from Scratch
- Create a Home Sheet with hyperlinks or buttons to each tab
- Define KPIs in a structured table with formulas and descriptions
- Prepare Input Sheets for actual, target, and previous year values
- Insert Pivot Tables for MTD and YTD summaries
- Build Dashboard Charts based on those pivots
- Use Slicers or Drop-downs to filter by month/KPI
- Apply Conditional Formatting for visual cues (up/down arrows)
🎡 Tips to Enhance the Visual Appeal
- Use color-coded indicators for LTB and UTB KPIs
- Add icons for alerts (like red flags for fraud metrics)
- Use line or bar charts for trend analysis
- Add KPI Cards with icons and large fonts for dashboard summary
💼 Who Can Use This Dashboard?
This dashboard is perfect for:
- CFOs and Finance Managers
- Risk & Compliance Officers
- Audit Teams
- Internal Control Teams
- Finance Analysts
Whether you’re from a startup, mid-size company, or enterprise, this dashboard helps standardize reporting.
Real-Life Use Case
Scenario: A financial controller in a mid-size company wants to review the variance in compliance and budget across the last 6 months.
Using this dashboard:
- They select “Compliance Rate” from the KPI Trend tab
- Review the MTD and YTD trend against targets
- Spot a sudden dip in March
- Drill down into the Actual Input Sheet and see that a new branch failed an audit
- Take corrective action within days
🌐 Future Improvements to Consider
- Add macro-based alerts if KPI falls below thresholds
- Link Excel to live databases using Power Query
- Automate monthly email reports using VBA
- Integrate Power BI layer for advanced dashboards
Conclusion
Managing financial risks doesn’t have to be overwhelming. With the Finance and Accounting Risk Management KPI Dashboard in Excel, your team can track essential metrics, improve compliance, and make confident, data-backed decisions. Plus, Excel’s familiarity and flexibility make this solution both powerful and accessible.
If you’re looking to strengthen your finance function and reduce risks, adopting this dashboard is a no-brainer.
❓ Frequently Asked Questions (FAQs)
❌ What if I want to track more than 12 KPIs?
You can easily expand the dashboard by adding more rows in the KPI Definition and Data sheets. Just ensure charts and formulas accommodate the additions.
🤔 Is Excel enough for managing complex risk KPIs?
Yes, for most SMEs. However, larger enterprises may eventually scale to Power BI or ERP-integrated dashboards.
💼 Who should maintain the dashboard?
Typically, a Finance Analyst or Risk Officer updates it monthly and reviews it with senior management.
📒 Can I use this dashboard for compliance audits?
Absolutely. With proper data entry and definitions, this dashboard works well for both internal and external audits.
Click to Purchases Finance and Accounting Risk Management KPI Dashboard in Excel
Visit our YouTube channel to learn step-by-step video tutorials