In today’s rapidly urbanizing world, effective data-driven decision-making has become a cornerstone for planning and managing cities. Governments, developers, and real estate planners must evaluate numerous metrics — from project costs and budgets to profitability and housing growth — to ensure sustainable development.
The Housing & Urban Development Dashboard in Power BI is a ready-to-use digital solution that brings all these performance insights into one interactive, visually rich platform. Built using Microsoft Power BI, this dashboard helps stakeholders analyze housing data, monitor project performance, and make timely, data-backed decisions.
Click to Purchases Housing & Urban Development Dashboard in Power BI
In this article, we’ll explore everything about this dynamic dashboard — from its structure and key features to its advantages, best practices, and FAQs.
What Is a Housing & Urban Development Dashboard in Power BI?
A Housing & Urban Development Dashboard in Power BI is an interactive tool designed to visualize and analyze data related to housing projects, budgets, profits, and urban development trends. It converts raw housing and municipal project data into easy-to-understand visuals that help planners, managers, and policymakers track performance efficiently.
Rather than depending on static reports or spreadsheets, users can interact with slicers, filters, and dynamic charts to instantly view data for any department, city type, or time period. The dashboard combines multiple pages — each dedicated to specific insights — to deliver a comprehensive overview of urban development activities.
Key Features of the Housing & Urban Development Dashboard
This dashboard has five interactive pages, each focusing on a specific analytical perspective. Every page includes slicers and dynamic visualizations to allow users to filter and explore the data intuitively.
Let’s go through each page in detail.
1️⃣ Overview Page
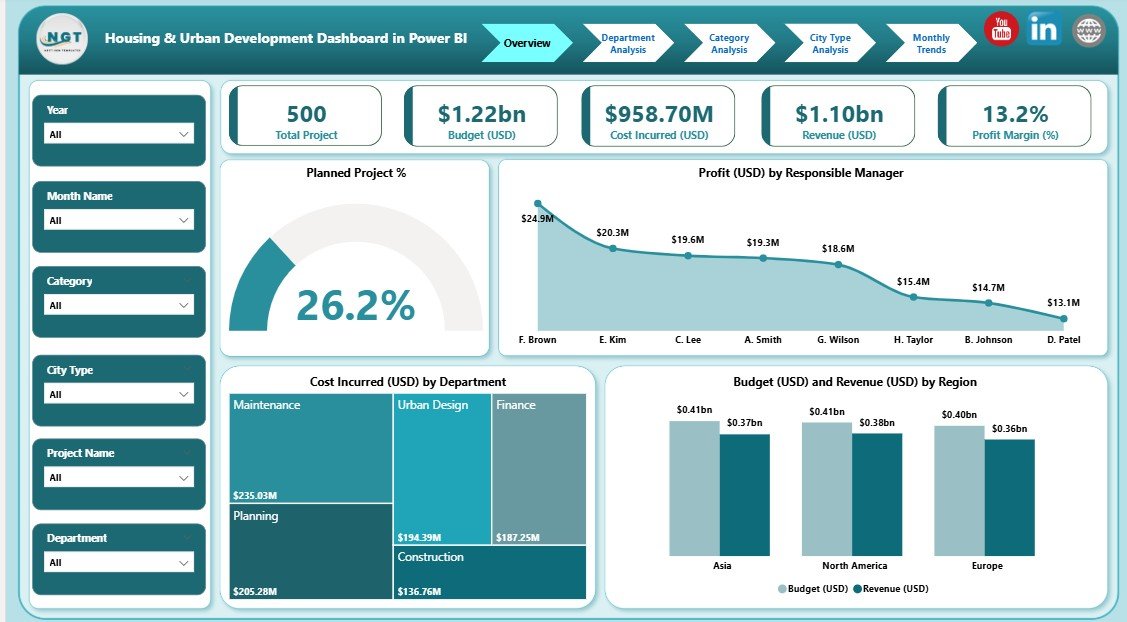
The Overview Page acts as the control center of the dashboard. It provides an at-a-glance summary of overall performance across all departments, regions, and projects.
Key Components:
-
Slicers for Filtering: Users can select filters such as time period, region, or department to view specific insights.
Performance Cards:
- Planned Project %
- Profit (USD) by Responsible Manager
- Cost Incurred (USD) by Department
- Budget (USD)
- Revenue (USD) by Region
Purpose:
The Overview Page offers a comprehensive summary of housing and urban development activities, highlighting whether the organization is staying on track with its financial and operational goals.
2️⃣ Department Analysis Page
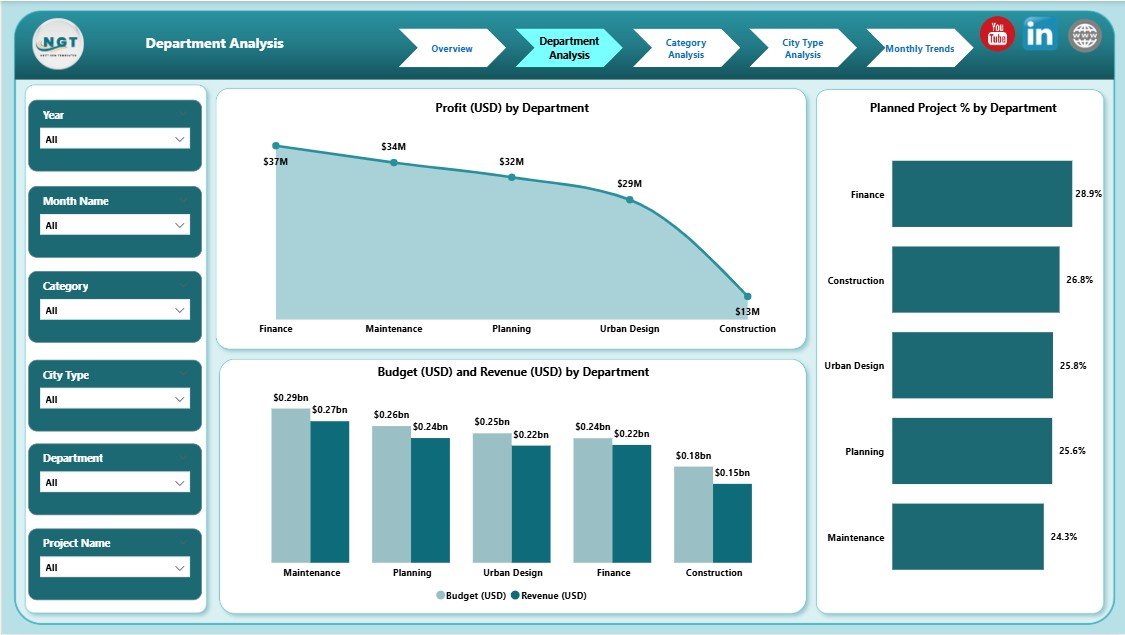
The Department Analysis Page focuses on evaluating departmental efficiency and contribution to the overall performance.
Key Visuals:
-
Profit (USD) by Department
-
Budget (USD) by Department
-
Revenue (USD) by Department
-
Planned Project % by Department
How It Helps:
This page helps managers understand which departments are driving profitability and which ones need budget optimization. By comparing planned projects against actuals, departments can take corrective actions quickly.
For example, if the “Urban Infrastructure” department consistently overshoots its budget, the dashboard instantly highlights it — prompting managers to review costs or reallocate resources.
3️⃣ Category Analysis Page
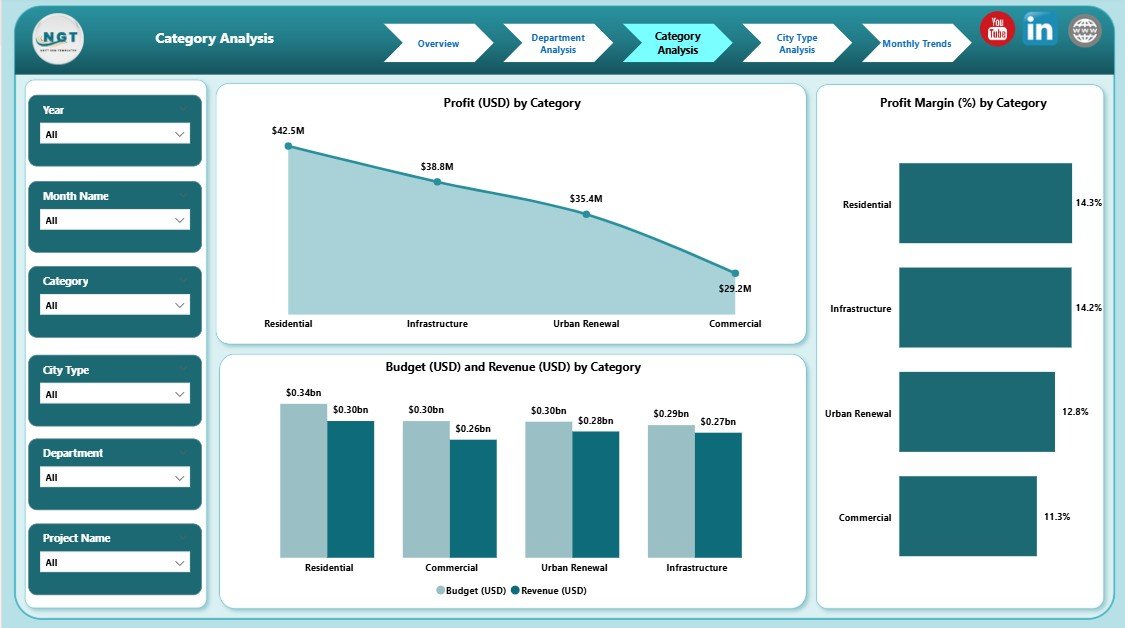
Every urban development project falls into categories such as residential, commercial, infrastructure, or mixed-use. The Category Analysis Page offers a clear breakdown of performance based on these categories.
Visual Insights Include:
-
Profit (USD) by Category
-
Budget (USD) by Category
-
Revenue (USD) by Category
-
Profit Margin % by Category
Why It Matters:
This page helps identify which types of projects deliver the highest returns. For instance, if residential projects have higher margins than commercial ones, the dashboard visually confirms that, enabling management to focus investments in the most profitable areas.
With this level of insight, planners can make better investment decisions and develop balanced portfolios that support both profitability and social development.
Click to Purchases Housing & Urban Development Dashboard in Power BI
4️⃣ City Type Analysis Page
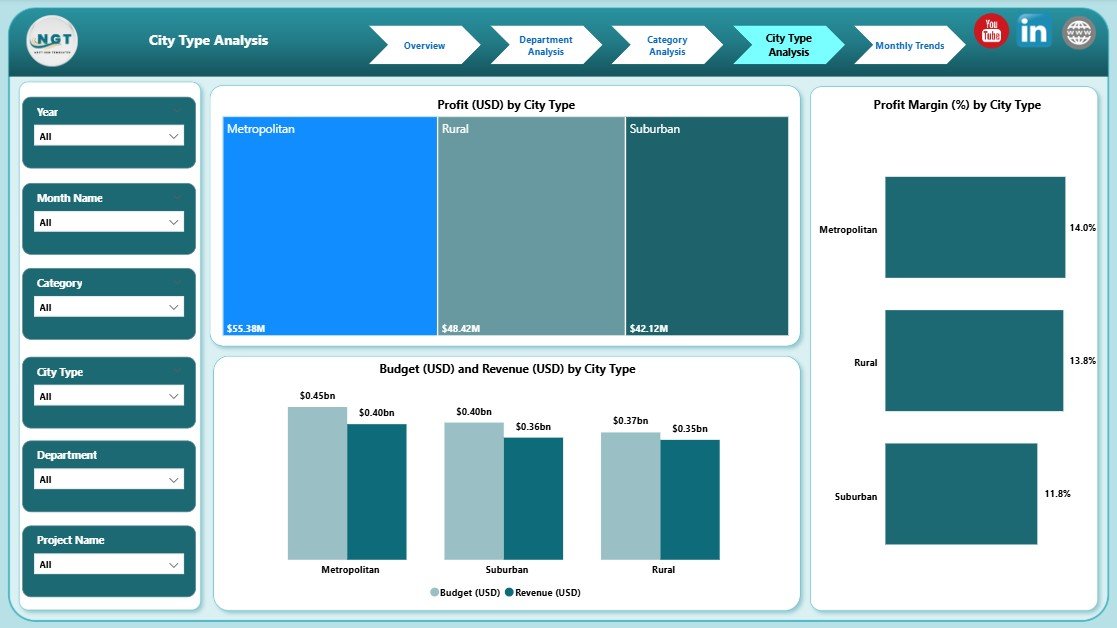
Urban development strategies differ by city type — metropolitan, suburban, or rural. The City Type Analysis Page in this dashboard allows stakeholders to analyze performance based on these urban classifications.
Visuals Displayed:
-
Profit (USD) by City Type
-
Budget (USD) by City Type
-
Revenue (USD) by City Type
-
Profit Margin % by City Type
Use Case Example:
A regional development authority can use this view to compare profitability between Tier 1 and Tier 2 cities. If rural housing projects show a lower revenue-to-cost ratio, planners can review policies, subsidies, or project execution strategies to improve results.
Impact:
This page empowers data-driven planning for regional and local governments by clarifying where investments yield the best outcomes.
5️⃣ Monthly Trends Page
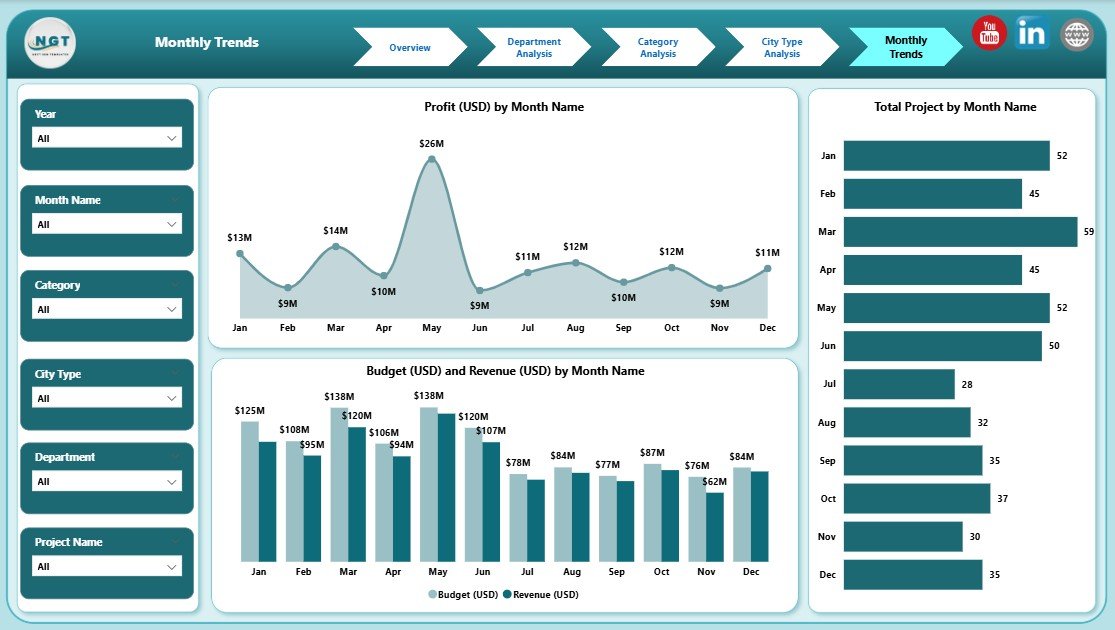
Time-based trends are crucial for long-term planning. The Monthly Trends Page displays key financial metrics across months, providing a historical performance view.
Charts Displayed:
-
Profit (USD) by Month
-
Budget (USD) by Month
-
Revenue (USD) by Month
-
Total Projects by Month
Why It’s Important:
This page enables project managers and analysts to identify seasonal performance fluctuations. For example, revenue peaks may align with specific quarters, while costs may rise during construction-heavy months.
With these insights, financial controllers can adjust forecasts, resource allocation, and project schedules more accurately.
🧩 Why Choose Power BI for Housing & Urban Development Analysis?
Power BI is one of the most powerful business intelligence tools available today. It integrates seamlessly with Excel, SQL databases, and cloud data sources to produce interactive visualizations and real-time insights.
Key Benefits of Using Power BI:
-
Data Consolidation: Combines housing, financial, and regional datasets in one view.
-
Real-Time Visualization: Automatically updates data dashboards with each refresh.
-
User-Friendly Interface: Enables even non-technical users to create and view reports.
-
Custom Filters and Slicers: Let users drill down to any detail — department, city, project, or timeline.
-
Cloud Accessibility: Power BI dashboards can be shared across teams and accessed anytime.
This makes it an ideal platform for public sector agencies, real estate developers, and policy planners managing large volumes of urban data.
🌆 Advantages of Housing & Urban Development Dashboard in Power BI
1️⃣ Centralized Data Management
The dashboard aggregates data from multiple departments, eliminating the need to switch between files or systems. This centralized approach saves time and ensures data consistency.
2️⃣ Real-Time Performance Monitoring
Instead of waiting for monthly or quarterly reports, decision-makers can view real-time KPIs like project costs, profitability, and budgets. This quick visibility helps them make informed decisions instantly.
3️⃣ Enhanced Transparency and Accountability
Every department’s financial and operational performance is visible in one place, ensuring transparency. Stakeholders can easily identify which departments or cities meet targets and which fall behind.
4️⃣ Improved Resource Allocation
By visualizing cost, profit, and project completion data, managers can allocate funds and resources where they generate the highest value.
5️⃣ Data-Driven Policy Formulation
Government authorities can use the dashboard’s insights to design urban policies backed by solid data rather than assumptions.
6️⃣ Simplified Communication
Dashboards convert complex numerical data into charts, graphs, and visuals — making it easier for leaders to communicate insights to the public or other stakeholders.
💼 Real-World Applications of the Dashboard
The Housing & Urban Development Dashboard in Power BI can be used in various contexts:
-
Municipal Corporations: Track urban infrastructure, housing projects, and city-level budgets.
-
Government Housing Boards: Monitor low-income and affordable housing schemes.
-
Real Estate Developers: Evaluate profitability across different projects and cities.
-
Construction Firms: Analyze cost, profit margins, and project timelines.
-
Urban Planners and Consultants: Measure development impact and align with sustainable city goals.
By providing actionable intelligence, the dashboard bridges the gap between data and decision-making.
⚙️ Best Practices for Using the Housing & Urban Development Dashboard
Click to Purchases Housing & Urban Development Dashboard in Power BI
To gain the most from this dashboard, follow these proven best practices:
✅ 1. Keep Data Sources Updated
Ensure that data sources such as project spreadsheets or financial databases are refreshed regularly to maintain accuracy.
✅ 2. Use Consistent KPI Definitions
Define metrics like “Profit Margin %” or “Planned Project %” clearly to avoid confusion across departments.
✅ 3. Leverage Filters and Slicers
Use slicers to compare performance between time periods, departments, or cities. This helps reveal hidden trends and outliers.
✅ 4. Automate Data Refresh
Schedule automatic data refresh in Power BI Service to ensure real-time analytics.
✅ 5. Customize Visuals for Stakeholders
Different users need different insights. Customize visuals — for instance, summary cards for executives and detailed charts for analysts.
✅ 6. Track Performance Over Time
Review monthly trends regularly to identify performance dips early. This helps in timely intervention and course correction.
✅ 7. Maintain Data Security
Use Power BI’s role-based access control to ensure sensitive data is accessible only to authorized users.
🏗️ How to Get Started with the Dashboard
Getting started with the Housing & Urban Development Dashboard in Power BI is simple:
-
Download the Template: Get the ready-to-use Power BI dashboard from NextGenTemplates.com.
-
Import Data: Connect your data sources like Excel sheets or SQL databases.
-
Refresh and Customize: Adjust slicers, visuals, and filters according to your organization’s needs.
-
Share Reports: Publish to Power BI Service and share interactive reports across departments.
This setup process requires no coding — making it ideal for both technical and non-technical professionals.
🧠 Tips to Improve Urban Development Analysis
-
Combine Power BI with GIS (Geographical Information Systems) for spatial insights.
-
Create performance scorecards for city managers to rank cities or departments.
-
Use AI insights in Power BI to predict future trends like housing demand or budget overrun risk.
-
Integrate Excel data directly for seamless updates.
-
Enable Power BI mobile access so leaders can review insights on the go.
🧩 Conclusion
The Housing & Urban Development Dashboard in Power BI is a transformative tool for modern planners and decision-makers. It empowers governments, real estate developers, and public institutions to convert complex data into actionable insights — improving planning, budgeting, and accountability.
With its interactive visuals, real-time analytics, and customizable design, this dashboard is not just a reporting tool but a strategic advantage for driving sustainable urban growth.
💡 Download this dashboard today from NextGenTemplates.com and take your housing and urban development analytics to the next level.
❓ Frequently Asked Questions (FAQs)
1️⃣ What is the main purpose of a Housing & Urban Development Dashboard in Power BI?
The primary goal is to visualize housing and urban development data in real time. It helps decision-makers track budgets, profits, and project progress efficiently.
2️⃣ Who can use this dashboard?
Government agencies, real estate developers, construction firms, and urban planners can all use this dashboard to analyze and monitor performance metrics.
3️⃣ Can I customize this dashboard for my region or city?
Yes. Power BI allows full customization. You can add new visuals, KPIs, or filters according to your data and requirements.
4️⃣ How does this dashboard help in policy-making?
It provides clear insights into urban performance, helping policymakers base their decisions on data instead of assumptions.
5️⃣ Is coding knowledge required to use this dashboard?
No. The template is fully interactive and requires no programming. Users can simply connect their data and begin analyzing.
6️⃣ Can the dashboard be shared with others?
Absolutely. Once published to the Power BI Service, reports can be securely shared across departments and teams.
7️⃣ How frequently should I refresh the data?
It depends on your data sources. For active projects, a daily or weekly refresh ensures real-time accuracy.
Visit our YouTube channel to learn step-by-step video tutorials
Click to Purchases Housing & Urban Development Dashboard in Power BI