Monitoring supplier performance is crucial for ensuring a smooth supply chain, reducing risks, and improving procurement efficiency. An Excel-based Supplier
Managing customer follow-ups effectively is crucial for businesses looking to maintain strong relationships and ensure timely communication. A Customer Follow-up
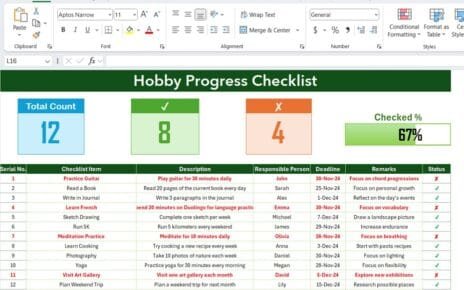
Hobbies are more than just leisure activities. They offer a unique opportunity for personal growth, skill development, and relaxation. Whether