In the fast-paced world of business operations, managing inventory efficiently is crucial to the success of any organization. With the advent of tools like Power BI, businesses can now monitor their inventory in real-time, gain deeper insights, and make data-driven decisions faster. This article will walk you through everything you need to know about an Inventory Management Dashboard in Power BI, from key features and advantages to best practices and a detailed explanation of each component.
Click to Purchases Inventory Management Dashboard in Power BI
What is an Inventory Management Dashboard in Power BI?
An Inventory Management Dashboard in Power BI is a dynamic tool that helps organizations track and manage their inventory in real-time. It provides comprehensive insights into stock levels, order statuses, warehouse performance, supplier data, and much more—all in a visually appealing, easy-to-understand format. Powered by data stored in Excel, the dashboard transforms raw data into actionable insights, helping businesses reduce overstocking, prevent stockouts, and optimize supply chain processes.
Key Features of an Inventory Management Dashboard in Power BI
The Inventory Management Dashboard in Power BI includes five essential pages, each focused on a specific aspect of inventory management. Below is an overview of each page:
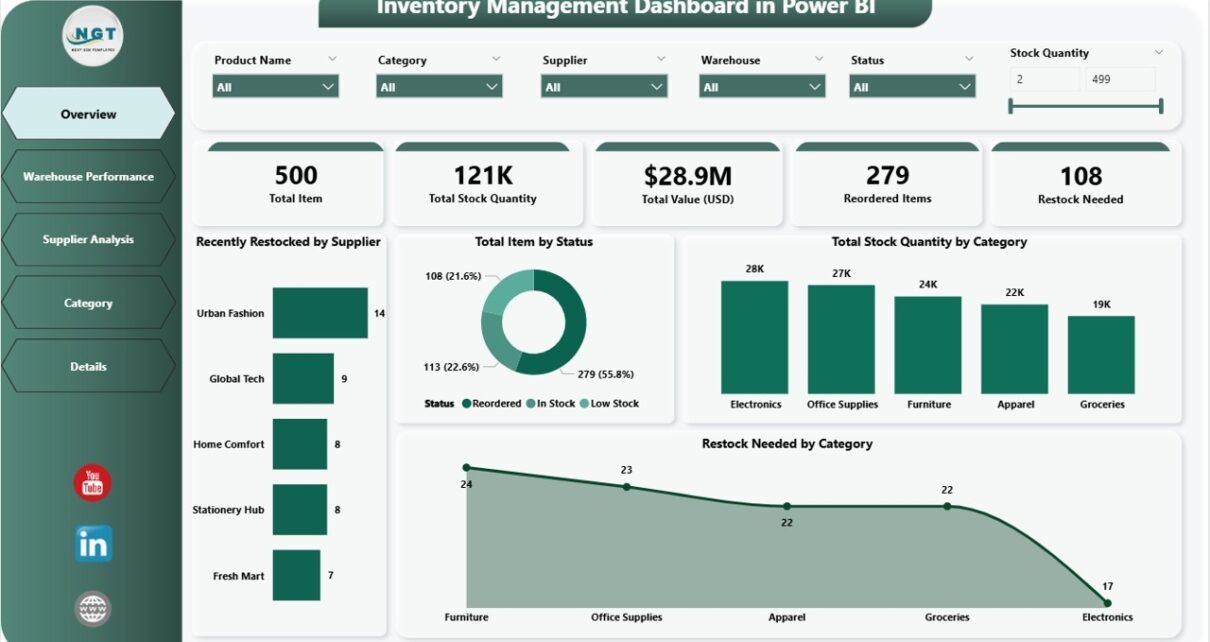
Overview Page
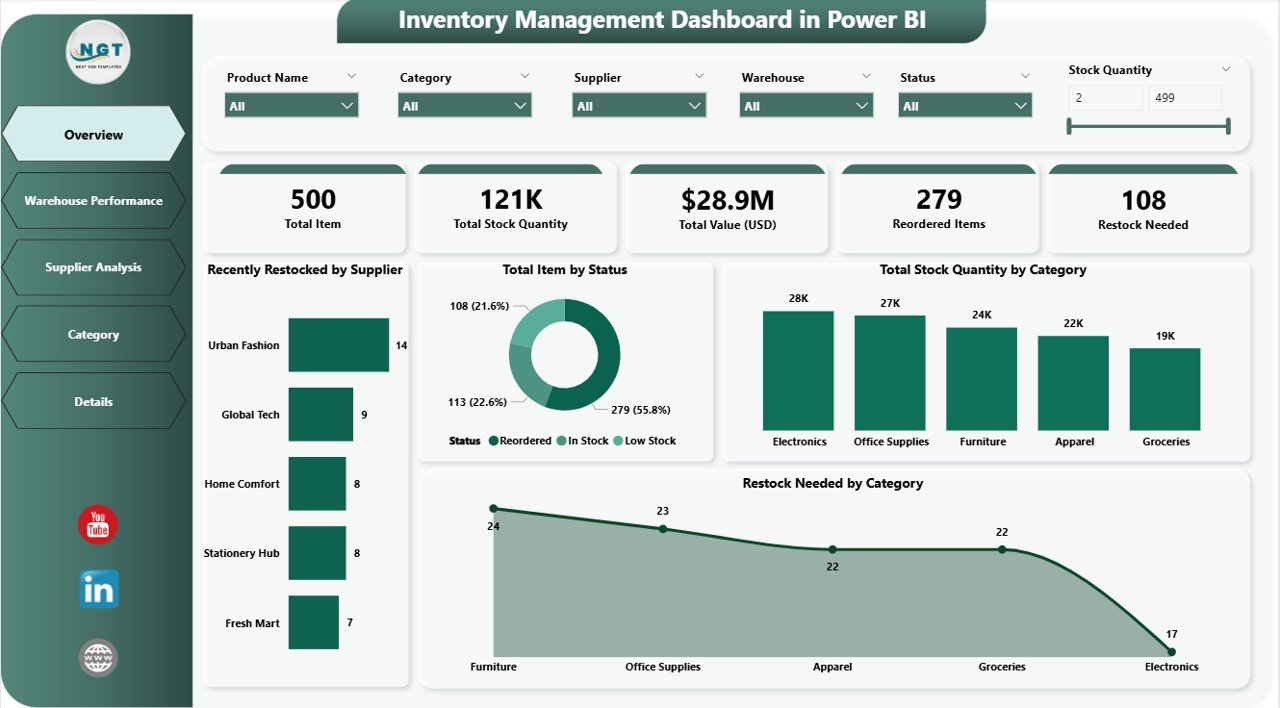
The Overview Page is the main page of the dashboard, providing a snapshot of the entire inventory management process. It features the following key elements:
-
6 Silencers: These are filters or slicers that allow you to view specific data by criteria such as supplier, category, or warehouse.
5 Cards: These cards display high-level data points, such as:
- Recently Restocked by Supplier
- Total Item by Status
- Total Stock Quantity by Category
- Restock Needed by Category
These visual elements make it easy to get a quick overview of the inventory status, enabling decision-makers to take immediate action.
Warehouse Performance Page
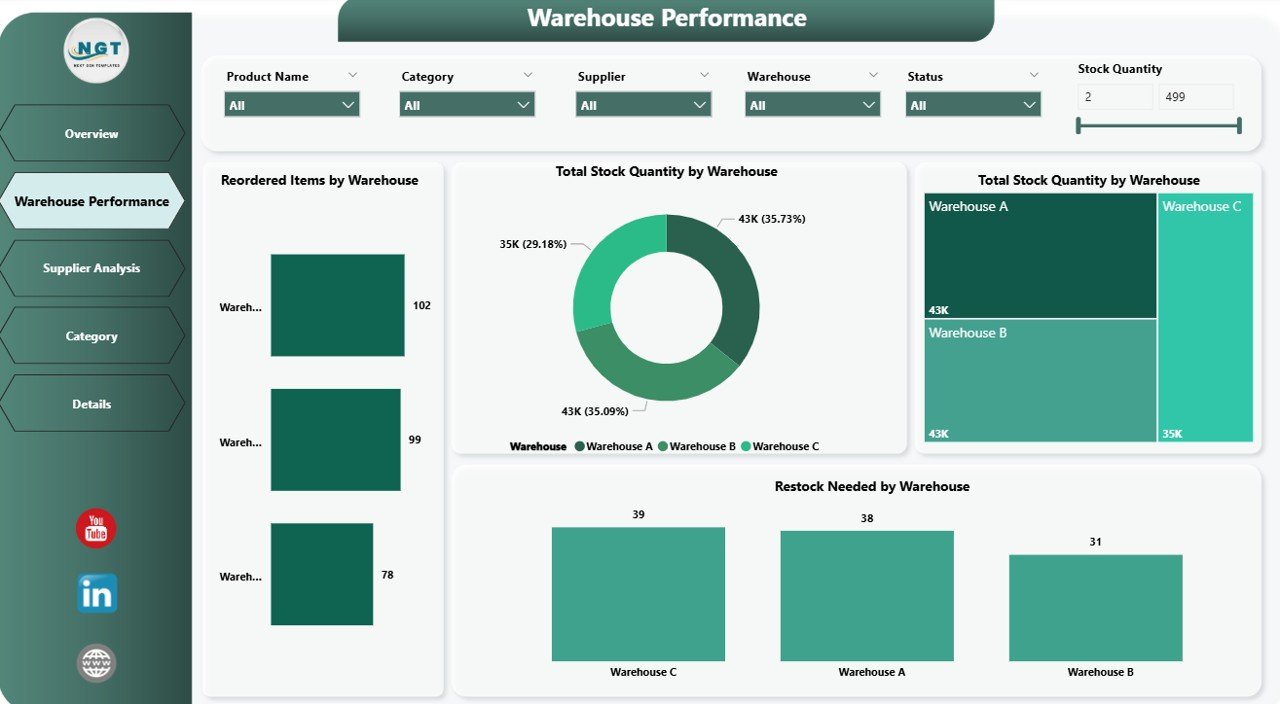
The Warehouse Performance page offers insights into the performance of different warehouses. Key features include:
-
6 Silencers: These filters allow users to drill down into data by warehouse location or other criteria.
Click to Purchases Inventory Management Dashboard in Power BI
4 Charts: These visualizations highlight:
- Recently Restocked by Warehouse
- Total Item by Warehouse
- Total Stock Quantity by Warehouse
- Restock Needed by Warehouse
These charts help track how well each warehouse is performing in terms of inventory management, identifying which warehouses may need more attention or resources.
Supplier Analysis Page
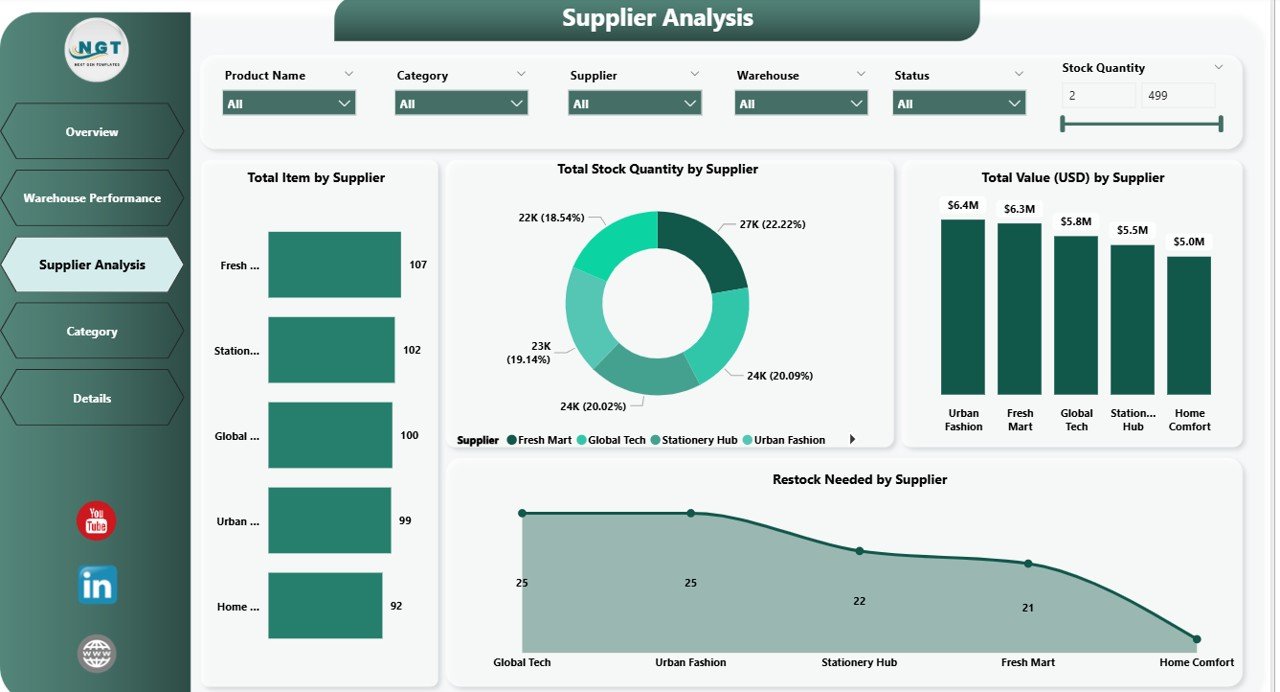
The Supplier Analysis page provides detailed insights into suppliers’ inventory data. This page features:
-
6 Silencers: Filters for narrowing down supplier data.
4 Charts: These charts focus on:
- Recently Restocked by Supplier
- Total Item by Supplier
- Total Stock Quantity by Supplier
- Restock Needed by Supplier
This page helps businesses evaluate supplier performance, ensuring that stock levels are replenished in a timely manner.
Category Page
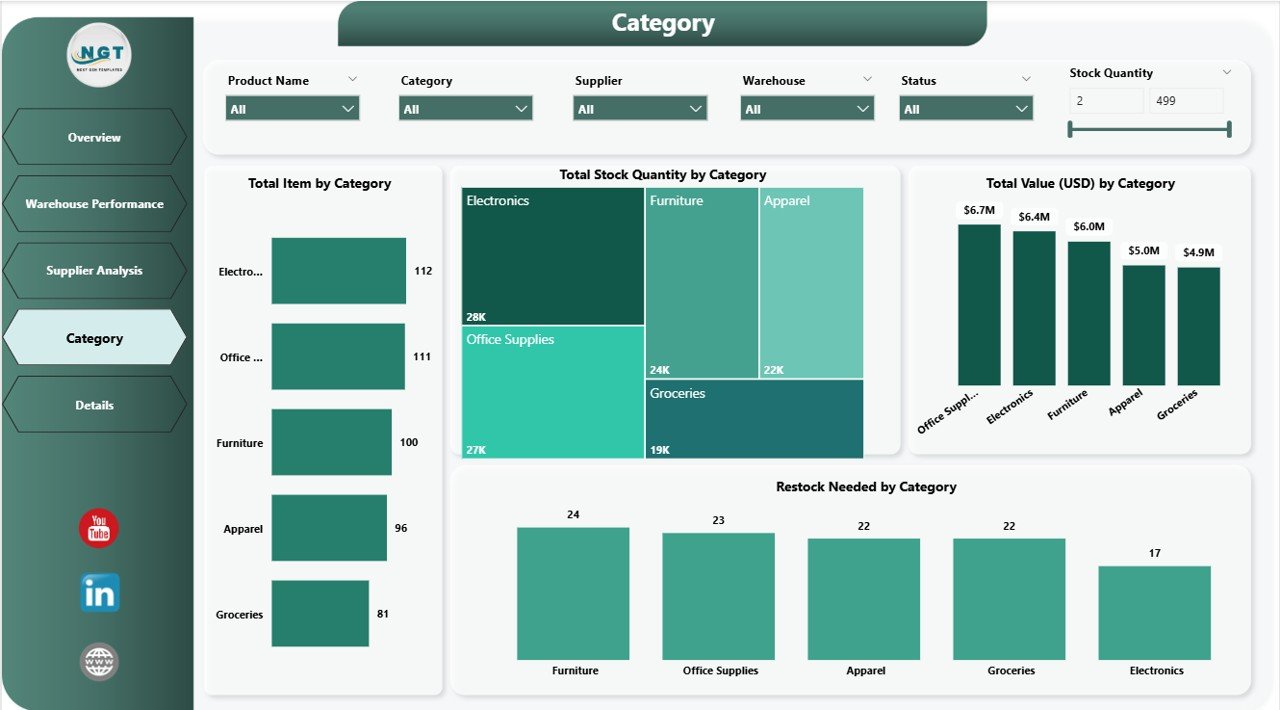
The Category Page offers a breakdown of inventory by product categories. It features:
-
6 Silencers: Filters to explore inventory data by specific categories.
4 Charts: These charts display:
- Recently Restocked by Category
- Total Item by Category
- Total Stock Quantity by Category
- Restock Needed by Category
This page helps organizations monitor which categories of products are well-stocked and which ones need replenishment.
Details Page
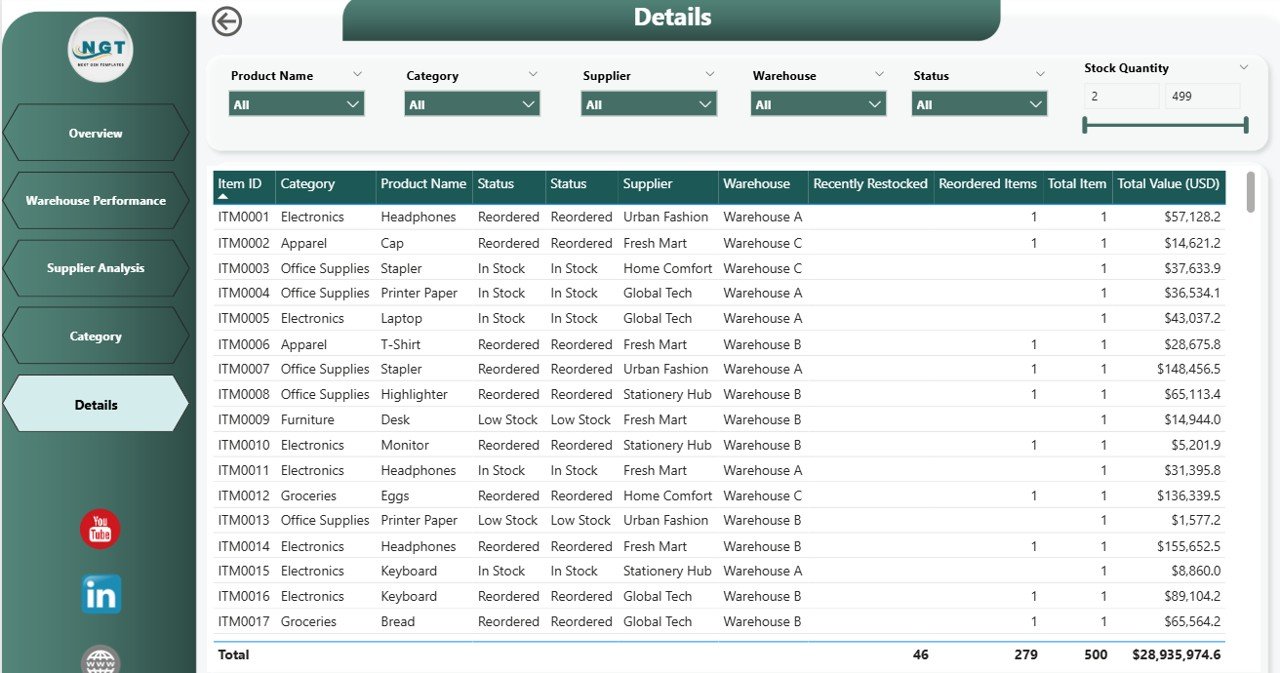
The Details Page is the final page in the dashboard and provides in-depth analysis. Key features include:
-
6 Silencers: Filters for a deeper dive into the data.
-
Detailed View: This page offers a detailed breakdown of the data, allowing users to drill down further and understand the underlying inventory trends.
Advantages of Using an Inventory Management Dashboard in Power BI
Using an Inventory Management Dashboard in Power BI brings several advantages to businesses, especially in terms of efficiency, decision-making, and data visualization.
1. Real-Time Inventory Tracking
One of the biggest advantages is the ability to track inventory in real-time. By integrating Power BI with Excel, businesses can instantly view updates on stock levels, orders, and restocking needs. This helps ensure that inventory decisions are always based on the most current data.
2. Improved Decision Making
The dashboard provides clear, actionable insights that help business leaders make informed decisions. Whether it’s identifying stockouts, tracking warehouse performance, or evaluating supplier efficiency, the dashboard helps streamline decision-making and enhances operational efficiency.
3. Customizable Visualizations
Power BI offers a wide range of customizable charts, graphs, and slicers, allowing users to tailor the dashboard to meet their unique needs. With visual tools, even complex data becomes easy to understand and analyze, reducing the need for extensive data training.
4. Increased Operational Efficiency
With all inventory data in one place, companies can optimize their inventory management processes, reducing waste, minimizing the risk of overstocking, and ensuring that the right products are always available at the right time.
5. Cost Savings
By closely monitoring stock levels and warehouse performance, businesses can identify areas where they are spending too much or where inefficiencies are occurring. This helps cut unnecessary costs and improve overall profitability.
Best Practices for Using an Inventory Management Dashboard in Power BI
While Power BI provides a powerful tool for managing inventory, following best practices ensures that businesses get the most out of their dashboards. Here are some tips to maximize the effectiveness of your Inventory Management Dashboard:
1. Regularly Update Your Data
Ensure that the data being used to update the dashboard is regularly refreshed. Accurate, up-to-date information is key to making informed decisions and keeping inventory management efficient.
2. Use Dynamic Filters and Slicers
Leverage the dynamic filters and slicers available in Power BI to allow users to customize the data they want to view. This helps decision-makers focus on the most relevant information without feeling overwhelmed by unnecessary data.
3. Monitor Supplier Performance
Track supplier performance regularly. Ensure that suppliers are restocking items on time and meeting your inventory needs. If a supplier is consistently late or failing to meet expectations, the dashboard can help you quickly identify and address the issue.
4. Set Alerts for Low Stock Levels
Use Power BI’s alerting features to notify users when stock levels are running low. This ensures that stockouts are avoided and products are restocked in a timely manner.
5. Train Your Team
To get the best results from the dashboard, ensure that all team members involved in inventory management are properly trained on how to use Power BI. This includes understanding how to use filters, charts, and how to interpret the data effectively.
Frequently Asked Questions (FAQs)
What is the main benefit of using an Inventory Management Dashboard in Power BI?
The main benefit is that it provides real-time insights into inventory status, warehouse performance, and supplier efficiency. This helps businesses make informed decisions, reduce stockouts, and optimize supply chain processes.
Can the Inventory Management Dashboard be customized?
Yes, the dashboard is highly customizable. Power BI allows you to tailor the visuals, slicers, and charts to meet the specific needs of your business.
How do I integrate Power BI with Excel for inventory management?
To integrate Power BI with Excel, simply import your Excel file into Power BI. From there, you can create dynamic visualizations and dashboards that update in real time as the Excel data changes.
Is Power BI easy to use for inventory management?
Yes, Power BI is user-friendly, especially for individuals familiar with Excel. Its drag-and-drop interface and customizable features make it easy to design and manage inventory dashboards.
How can I ensure the accuracy of the data in my dashboard?
To ensure accuracy, regularly update your data, validate data sources, and ensure that your data entry process is consistent and error-free. You can also set up data alerts for discrepancies.
Conclusion
An Inventory Management Dashboard in Power BI is an invaluable tool for businesses looking to streamline their inventory management process. With its powerful features, real-time tracking, and customizable visualizations, Power BI allows businesses to make informed decisions, improve operational efficiency, and save costs. By following the best practices outlined in this guide, you can optimize your inventory processes and stay ahead of the competition.
Visit our YouTube channel to learn step-by-step video tutorials