Managing multiple projects at once can be challenging, especially when dealing with various deadlines, budgets, and team members. Whether you’re a project manager, department head, or business owner, staying on top of all your ongoing projects is essential for success. Luckily, an Excel-based Multiple Projects Management Dashboard can help streamline your project management tasks. In this article, we will take an in-depth look at how this dashboard works and how it can simplify your project management process.
What is a Multiple Projects Management Dashboard in Excel?
A Multiple Projects Management Dashboard in Excel is a powerful tool designed to help you monitor and manage various aspects of multiple ongoing projects in one place. This ready-to-use dashboard allows you to visualize key metrics such as budget, project completion percentage, milestones, and performance metrics in a clear, easy-to-understand format. By using Excel, you can have all your data in one place, accessible, customizable, and ready to be analyzed.
Key Features of the Multiple Projects Management Dashboard
This dashboard is built with several tabs and slicers to give you full control over your projects. Here’s a breakdown of each sheet and how it contributes to your project management process:
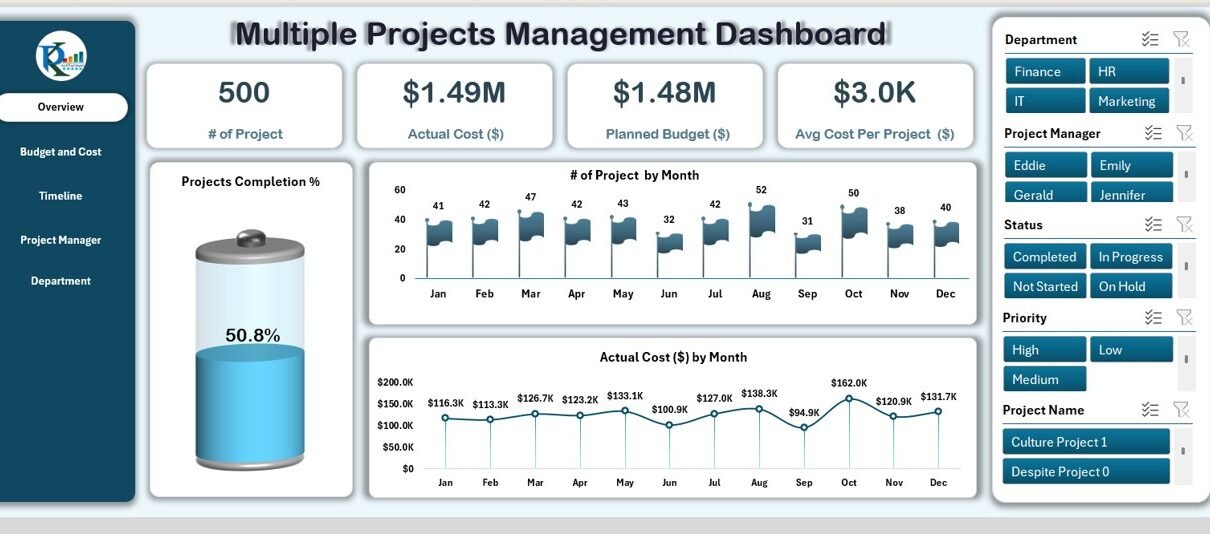
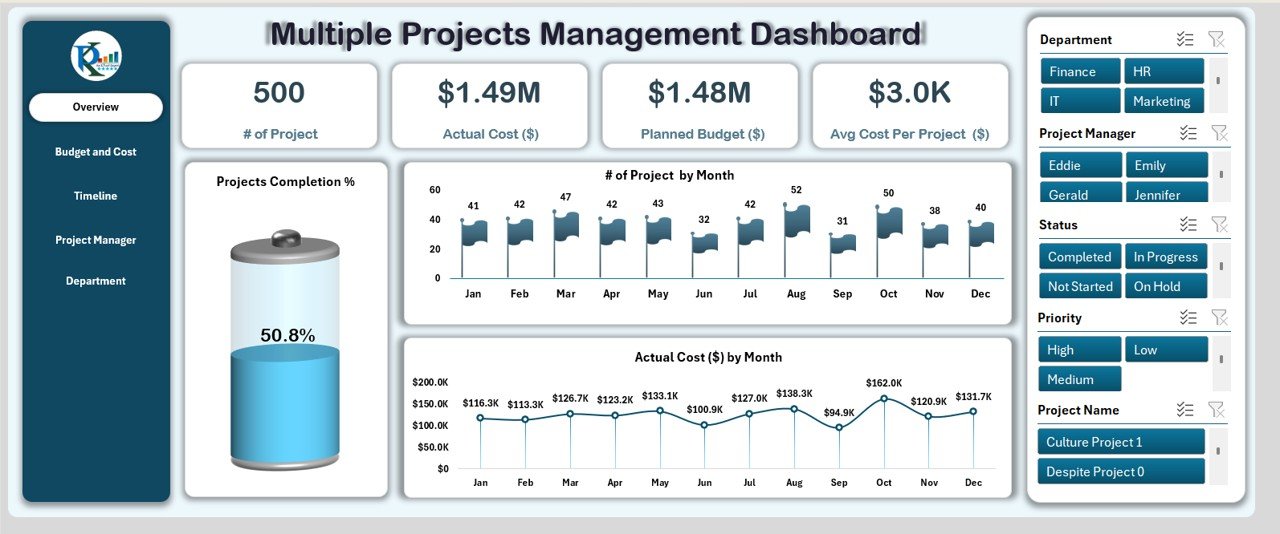
1. Overview Sheet Tab
The Overview Sheet provides a snapshot of your entire portfolio of projects. It includes various cards and charts that highlight the most critical project data.
Cards:
- # of Projects: Displays the total number of active projects.
- Actual Cost ($): Shows the total actual cost of all ongoing projects.
- Planned Budget ($): The planned budget for all projects combined.
- Average Cost Per Project ($): The average cost of all projects.
Charts:
- Projects Completion % (Battery Chart): A visual representation of how many projects are completed.
- # of Projects by Month (Flag Chart): A chart showing the distribution of projects across different months.
- Actual Cost ($) by Month (Line Chart): Displays the actual costs of projects month by month.
Click to buy Multiple Projects Management Dashboard in Excel
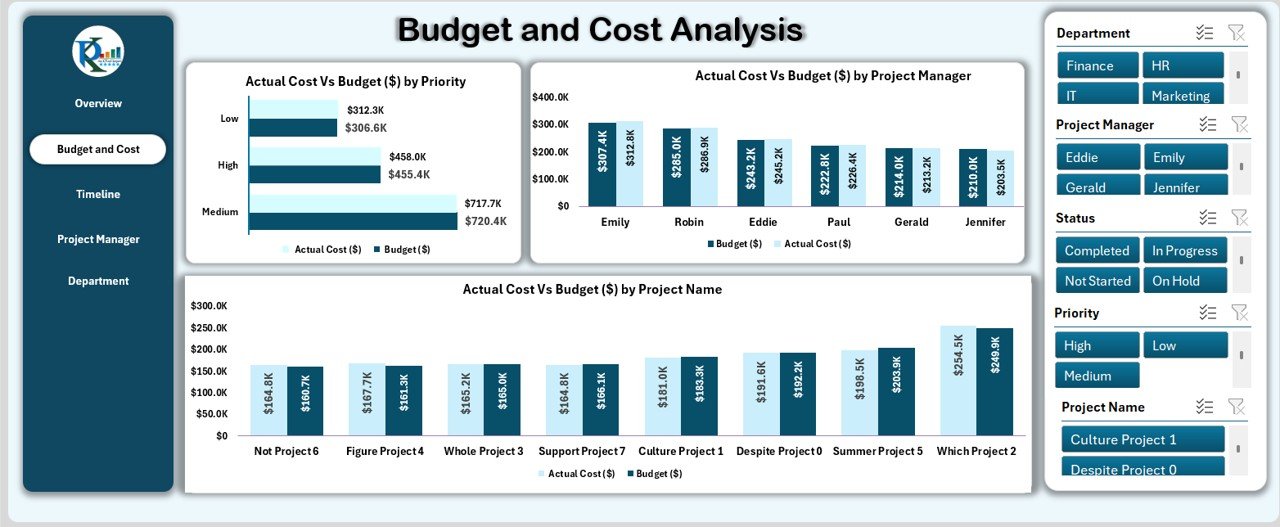
2. Budget and Cost Analysis Sheet Tab
The Budget and Cost Analysis Sheet dives deeper into the financial aspects of the projects, breaking them down into categories like priority and project manager.
Charts:
- Actual Cost ($) by Priority (Bar Chart): Shows how much budget has been spent on projects based on their priority.
- Actual Cost ($) by Project Manager (Column Chart): Displays how much budget has been spent by each project manager.
- Planned Budget ($) by Project Name (Column Chart): Displays the planned budget allocated for each project.
Click to buy Multiple Projects Management Dashboard in Excel
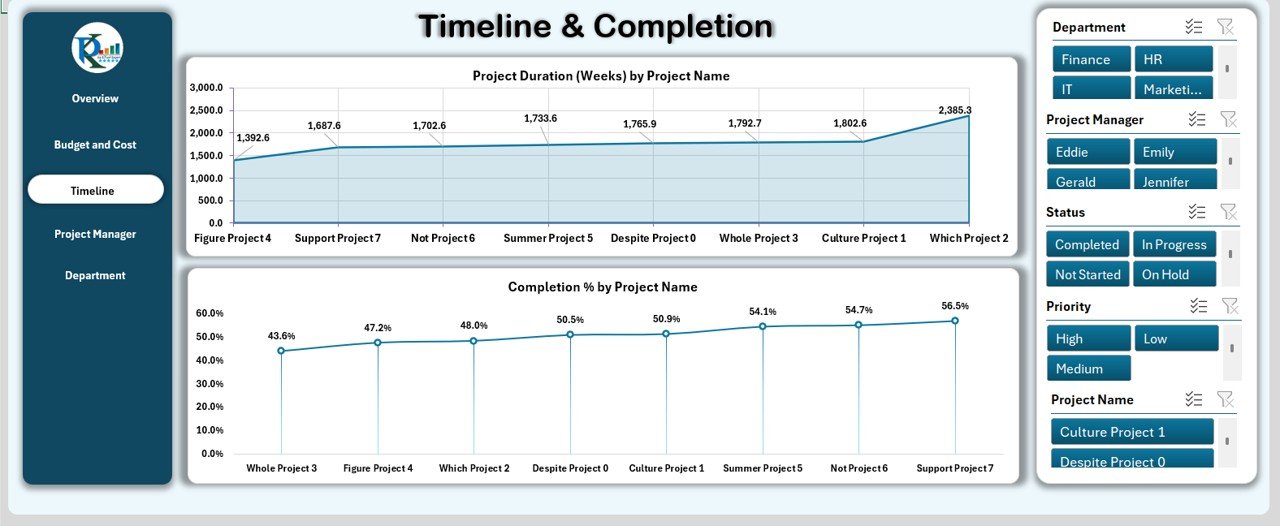
3. Timeline & Completion Sheet Tab
The Timeline & Completion Sheet focuses on the progress of each project, showing project durations and completion percentages.
Charts:
- Project Duration (Weeks) by Project Name (Area Chart): Displays the timeline for each project.
- Completion % by Project Name (Line Chart): Shows the completion percentage of each project.
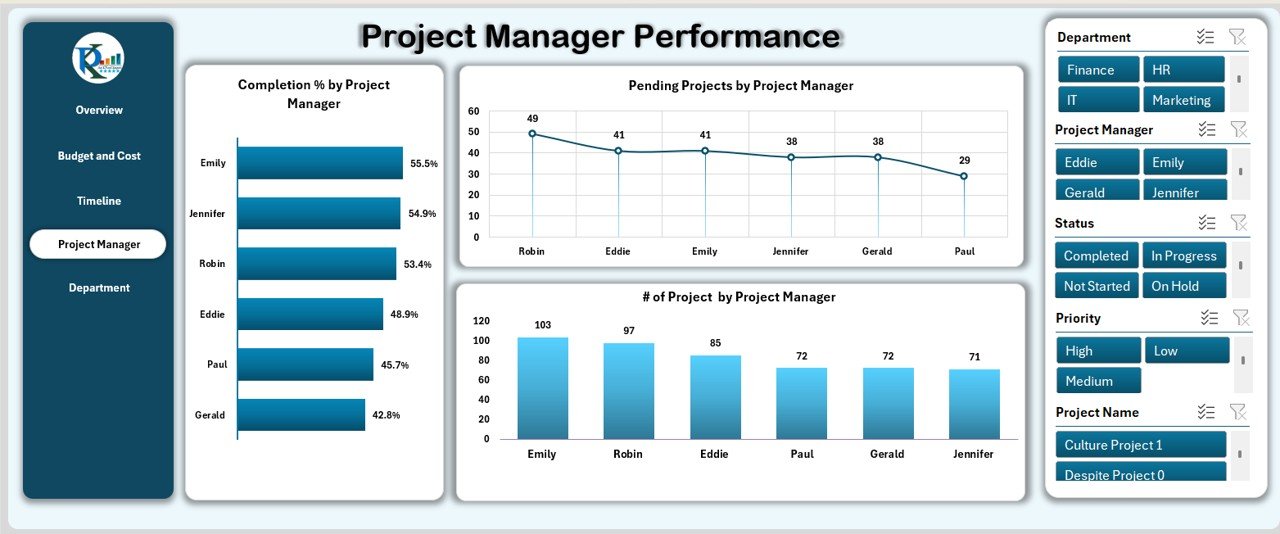
4. Project Manager Performance Sheet Tab
This sheet allows you to evaluate the performance of each project manager across various projects.
Charts:
- Completion % by Project Manager (Bar Chart): Displays the completion percentage for each project manager.
- Pending Projects by Project Manager (Line Chart): Tracks the number of pending projects per manager.
- # of Projects by Project Manager (Column Chart): Displays the number of projects managed by each individual.
Click to buy Multiple Projects Management Dashboard in Excel
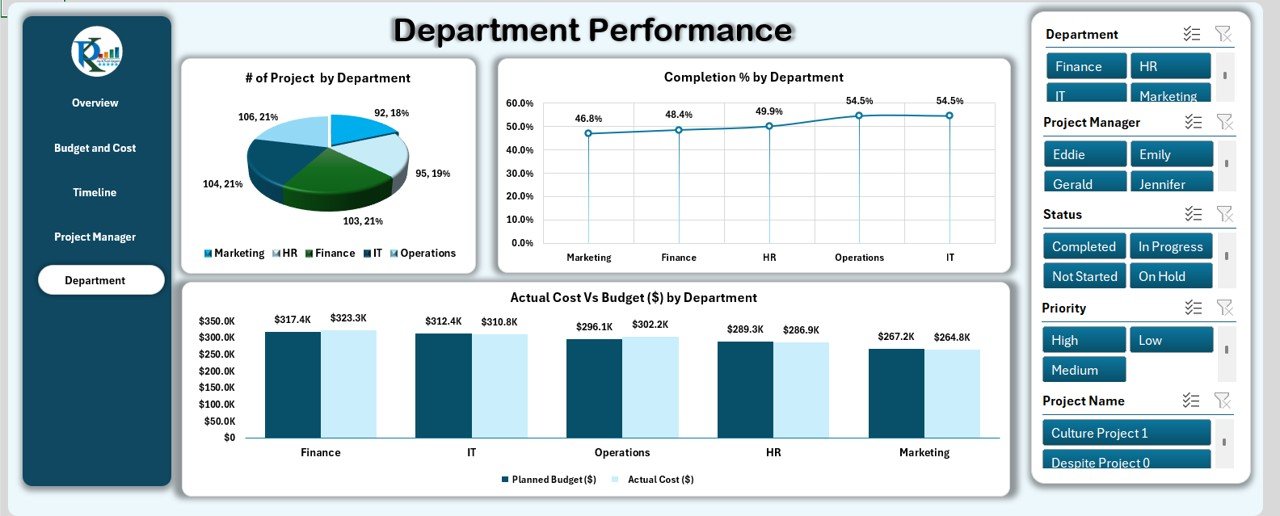
5. Department Performance Sheet Tab
This tab evaluates the performance of different departments in managing their projects.
Charts:
- # of Projects by Department (Pie Chart): Displays the distribution of projects across different departments.
- Completion % by Department (Line Chart): Shows the completion percentage of projects for each department.
- Actual Cost ($) by Department (Column Chart): Displays the actual costs of projects per department.
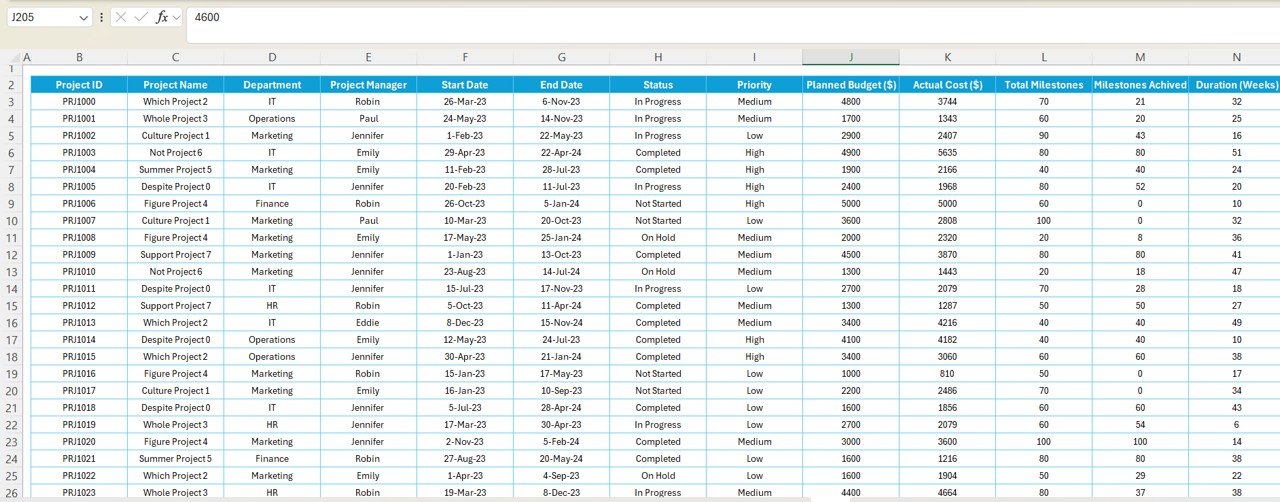
6. Data Sheet Tab
The Data Sheet serves as the input sheet where all project-related data is stored. It includes the following fields:
This tab is essential as it stores all the data that drives the charts and cards in the other tabs.
Click to buy Multiple Projects Management Dashboard in Excel
Advantages of the Multiple Projects Management Dashboard in Excel
Using an Excel-based Multiple Projects Management Dashboard comes with several advantages:
- Centralized Project Monitoring; You can keep track of all your projects in one place, saving you time and effort. Instead of jumping between multiple documents or tools, everything is in your dashboard, making project monitoring much easier.
- Visual Data Representation: With various charts and slicers, the dashboard visually represents key metrics. You can quickly understand the progress, budget health, and performance of each project through charts such as battery charts, line charts, pie charts, and column charts.
- Customizable and Flexible; Since it’s in Excel, you have the ability to customize the dashboard to fit your specific project management needs. Whether you need to track additional metrics or change the way the data is visualized, you can tailor the dashboard to your preferences.
- Real-time Tracking: The dashboard enables real-time tracking of project data. As new data is entered in the Data Sheet tab, all related metrics and visualizations update automatically, helping you stay up-to-date.
- Improved Decision-Making: With easy access to key performance indicators (KPIs) such as project completion percentage, cost analysis, and project timelines, you can make informed decisions that help keep your projects on track.
Opportunities for Improvement in the Multiple Projects Management Dashboard
While this dashboard offers many benefits, there are also opportunities for improvement:
- Automated Data Entry: One potential improvement is integrating the dashboard with project management tools or other data sources. This would allow for automatic data entry, reducing manual effort and the risk of errors.
- Mobile-Friendly Interface; As more people rely on mobile devices for work, making the dashboard mobile-responsive would increase accessibility and usability for project managers on the go.
- Enhanced Data Analysis Features: Integrating advanced analytics features, such as forecasting tools or predictive analytics, could further enhance the dashboard’s functionality, providing deeper insights into project trends.
Best Practices for Managing Multiple Projects with the Dashboard
Click to buy Multiple Projects Management Dashboard in Excel
To maximize the efficiency of the Multiple Projects Management Dashboard, follow these best practices:
- Regular Data Updates: Make sure to update the data sheet regularly to ensure that the dashboard reflects the most accurate and up-to-date information.
- Customize for Specific Needs; Customize the dashboard to reflect your specific project management needs. This includes adding new data fields, adjusting charts, or changing slicer filters.
- Set Clear KPIs: Establish clear KPIs (Key Performance Indicators) for your projects, such as budget variance, completion percentage, and milestones achieved. Monitor these regularly to ensure projects stay on track.
- Use Conditional Formatting; Utilize conditional formatting to highlight key areas that need attention, such as projects that are over budget or behind schedule.
- Collaborate with Stakeholders: Make sure that relevant stakeholders (team members, department heads, etc.) have access to the dashboard. This ensures that everyone is on the same page and can collaborate effectively.
Conclusion
The Multiple Projects Management Dashboard in Excel is an invaluable tool for managing multiple projects simultaneously. It consolidates key project data in one place and provides visual insights through various charts and slicers. By using this dashboard, you can track your project’s performance, stay on top of budgets, and make informed decisions.
Frequently Asked Questions (FAQs)
Click to buy Multiple Projects Management Dashboard in Excel
What is the best way to use the Multiple Projects Management Dashboard?
The best way to use the dashboard is by regularly updating the data sheet and monitoring key performance metrics such as completion percentages, budget variance, and project timelines.
Can I customize the dashboard for my specific project management needs?
Yes, the dashboard is fully customizable. You can add new fields, modify existing charts, and adjust slicers to fit your specific requirements.
Is it possible to integrate the dashboard with other project management tools?
While the current version of the dashboard is Excel-based, it is possible to integrate it with other project management tools using data export/import functionality or automated scripts.
How can I improve the performance of my dashboard?
To improve the performance, regularly remove unnecessary data, ensure that the formulas are optimized, and limit the use of volatile functions in Excel.
Visit our YouTube channel to learn step-by-step video tutorials
Watch the step-by-step video Demo:
Click to buy Multiple Projects Management Dashboard in Excel