Online education has become a major industry in recent years, with various platforms offering courses to millions of students worldwide. To manage and optimize the performance of these platforms, key performance indicators (KPIs) are crucial for measuring progress, student engagement, and overall success. In this article, we will explore how an Online Education KPI Dashboard in Power BI can help institutions track and analyze their performance. We will also discuss how the integration of Power BI and Excel makes it easier to manage KPIs and monitor important metrics.
Table of Contents
ToggleClick to Purchases Online Education KPI Dashboard in Power BI
What is an Online Education KPI Dashboard in Power BI?
An Online Education KPI Dashboard in Power BI is a ready-to-use tool designed to track and visualize the performance of online educational platforms. This dashboard aggregates data from various sources, most notably from an Excel file, to provide real-time insights into key metrics such as course completion rates, student satisfaction, and progress toward set targets. By utilizing Power BI, users can interact with the data, drill down for more information, and make informed decisions based on the insights provided.
Key Features of the Online Education KPI Dashboard in Power BI
The Online Education KPI Dashboard consists of several pages designed to provide a comprehensive overview of the performance metrics. Here are the main features:
Summary Page
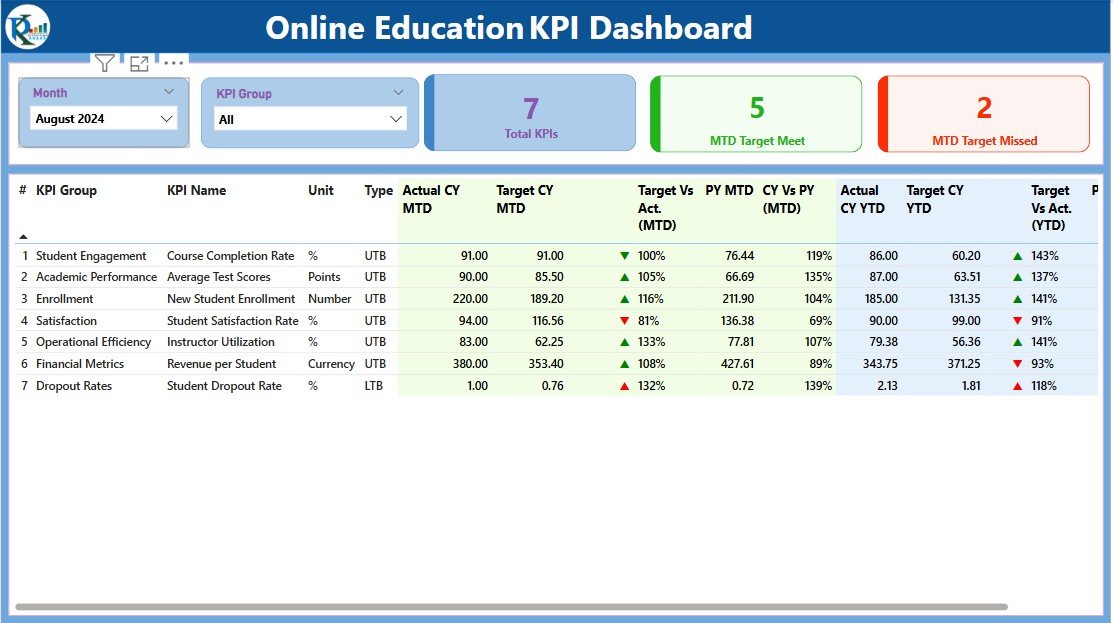
The Summary Page serves as the central hub of the dashboard, giving an overview of the key KPIs and their performance. This page includes:
-
Month and KPI Group Slicer: Filters the data based on the month and specific KPI group.
-
KPIs Cards: Displays the Total KPIs Count, MTD Target Met Count, and MTD Target Missed Count, offering a quick summary of the performance status.
Detailed Table: Provides a detailed breakdown of each KPI, including the following columns:
- KPI Number: Sequence number for each KPI.
- KPI Group: The category or group of the KPI.
- KPI Name: The name of the KPI being tracked.
- Unit: Unit of measurement for the KPI.
- Type: Indicates whether the KPI is LTB (Lower the Better) or UTB (Upper the Better).
- Actual CY MTD: The Actual Current Year MTD (Month-to-Date) number for the KPI.
- Target CY MTD: The Target Current Year MTD value.
- MTD Icon: Visual indicators (green and red arrows) showing whether the target for MTD has been met.
- Target vs Act. (MTD): Percentage comparison of Actual vs Target for MTD.
- PY MTD: MTD data from the Previous Year.
- CY Vs PY (MTD): A percentage comparison of Current Year MTD vs Previous Year MTD.
- Actual CY YTD: Current year Actual YTD (Year-to-Date) value.
- Target CY YTD: Target YTD for the current year.
- YTD Icon: Visual indicators showing whether the target for YTD has been met.
- Target vs Act. (YTD): Percentage comparison of Actual vs Target for YTD.
- PY YTD: YTD value from the Previous Year.
- CY Vs PY (YTD): A percentage comparison of Current Year YTD vs Previous Year YTD.
Click to Purchases Online Education KPI Dashboard in Power BI
KPI Trend Page
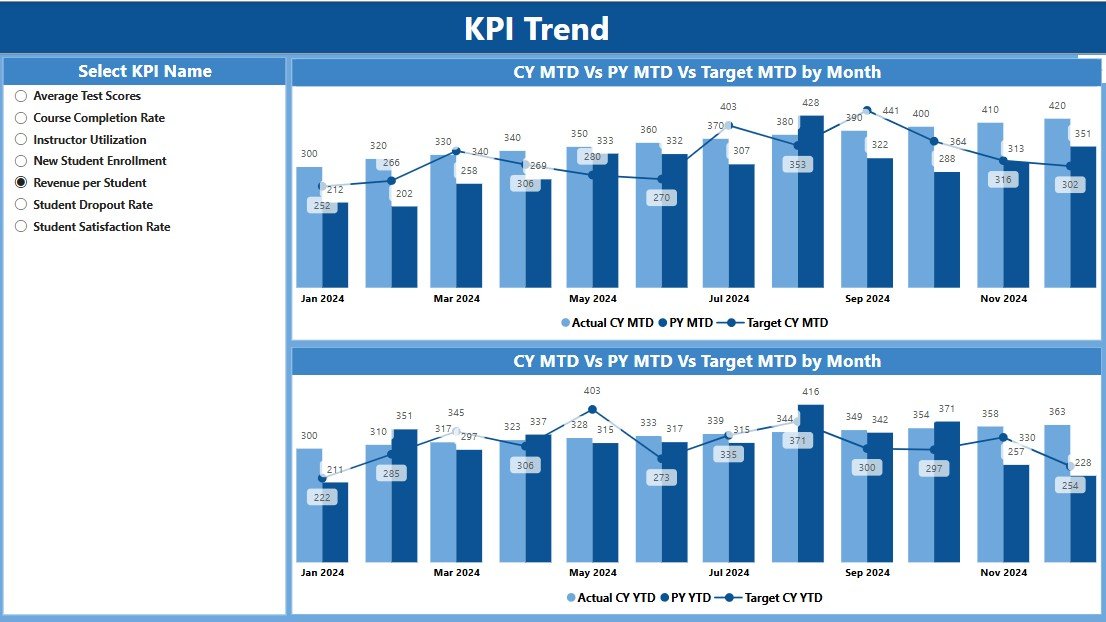
The KPI Trend Page provides a visual representation of the MTD and YTD performance for the current year, the previous year, and the target values. The page includes:
-
Combo Charts: Two combo charts display the performance trends for both MTD and YTD, showing the Actual Numbers for the Current Year, Previous Year, and Targets.
-
KPI Slicer: A slicer is provided to allow users to select specific KPI names and view their trends.
KPI Definition Page
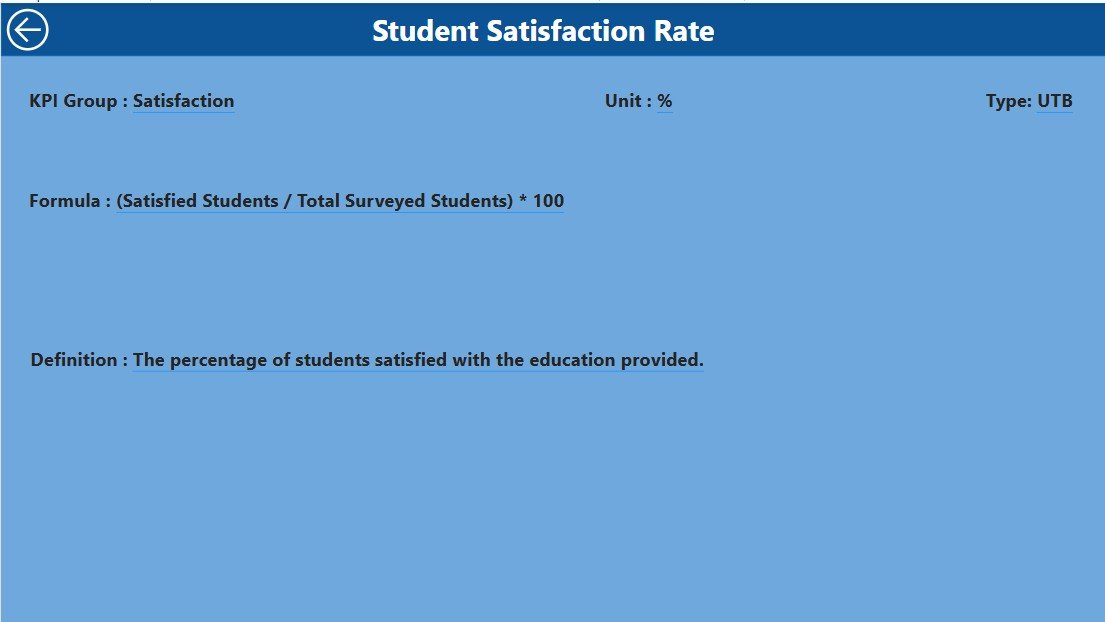
The KPI Definition Page offers a detailed drill-through feature for users to understand the underlying formulas and definitions for each KPI. It is hidden by default but can be accessed by drilling through from the Summary Page.
-
Formula and Definition: Shows the formula and definition for each KPI, providing clarity on how the metrics are calculated.
-
Back Button: A button is available to return to the Summary Page.
Click to Purchases Online Education KPI Dashboard in Power BI
Data Management in Excel
The data for the Online Education KPI Dashboard is managed using Excel. The dashboard is designed to work seamlessly with three Excel worksheets that contain the following data:
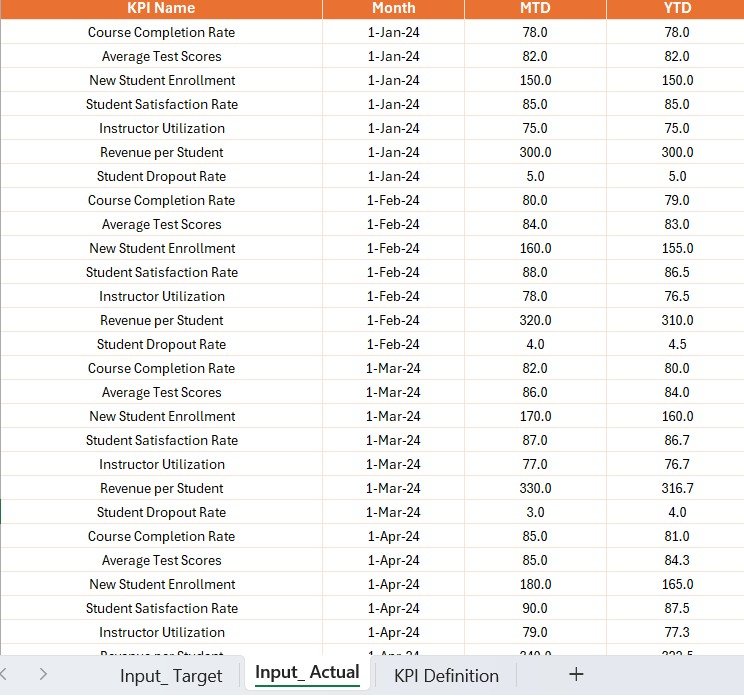
Input_Actual Sheet Tab
This worksheet stores the Actual KPI Numbers for the current month and year. Here, users input the following data:
-
KPI Name
-
Month (Enter the first date of the month)
-
MTD Number (Month-to-Date actual value)
-
YTD Number (Year-to-Date actual value)
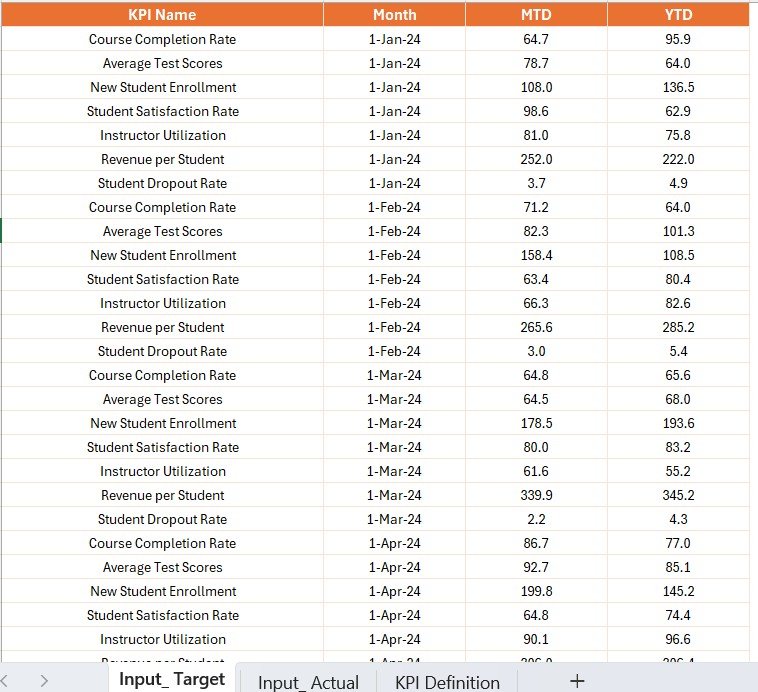
Input_Target Sheet Tab
This worksheet holds the Target KPI Numbers for comparison against the actual values. The data entered includes:
-
KPI Name
-
Month (First date of the month)
-
MTD Number (Target Month-to-Date value)
-
YTD Number (Target Year-to-Date value)
KPI Definition Sheet Tab
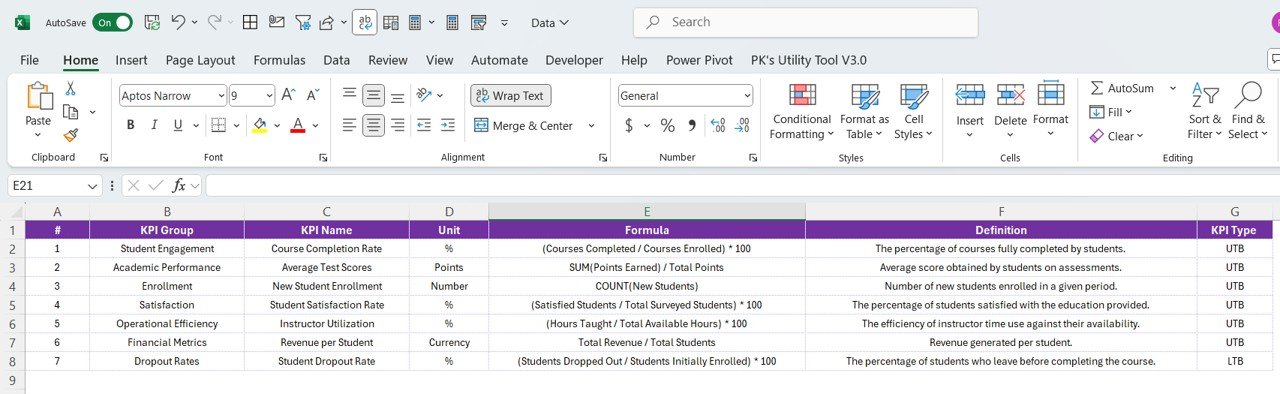
In this sheet, users define each KPI by providing:
-
KPI Number
-
KPI Group
-
KPI Name
-
Unit
-
Formula
-
Definition
-
Type (LTB or UTB)
Advantages of the Online Education KPI Dashboard in Power BI
The Online Education KPI Dashboard in Power BI offers several advantages for institutions and education providers looking to optimize their performance tracking. Here are some key benefits:
1) Real-Time Data Insights
With this dashboard, you can monitor the MTD and YTD performance of key metrics in real time. The Power BI platform allows for seamless integration and updating of data, ensuring that you always have access to the latest insights.
2) Easy Data Visualization
The combo charts and icons used to visualize KPI data make it easy to understand trends and performance at a glance. Power BI’s interactive features allow you to drill deeper into the data and focus on specific KPIs as needed.
3) Simplified Data Management
By leveraging Excel as the data source, institutions can manage their KPI data with ease. Excel is a familiar tool for most users, making it easy to input, update, and maintain KPI values without complex systems.
4) Comparison Across Time Periods
The dashboard allows for easy comparisons between Current Year and Previous Year data, giving you the ability to track progress and identify trends over time.
Best Practices for the Online Education KPI Dashboard in Power BI
To maximize the effectiveness of the Online Education KPI Dashboard, follow these best practices:
1) Ensure Accurate and Consistent Data Entry
Always ensure that data entered into the Excel sheets is accurate and consistent. Regularly update the MTD and YTD values to ensure the dashboard reflects the most current performance metrics.
2) Use Clear and Actionable KPIs
Choose KPIs that are relevant to your educational goals and can drive actionable insights. Avoid tracking too many metrics, as this can overwhelm users and dilute the focus.
3) Leverage Power BI’s Interactive Features
Take full advantage of Power BI’s interactive features such as slicers, drill-through, and dynamic charts. These features make the dashboard more flexible and user-friendly, allowing you to gain deeper insights into your data.
4) Regularly Review and Update KPI Targets
As your online education platform evolves, revisit and update your KPI targets to ensure they remain aligned with your current goals and objectives.
Conclusion
The Online Education KPI Dashboard in Power BI is a powerful tool for tracking and optimizing the performance of online educational platforms. By integrating Power BI with Excel, this dashboard provides real-time insights into key metrics, helping institutions make informed decisions based on data. Whether you’re a school, university, or e-learning platform, this dashboard offers valuable tools to track progress and improve performance.
Frequently Asked Questions (FAQs)
1) What is an Online Education KPI Dashboard in Power BI?
An Online Education KPI Dashboard in Power BI is a tool designed to help online education platforms track and visualize key performance metrics such as student engagement, course completion rates, and overall progress towards targets.
2) How does Power BI help in managing KPIs for online education?
Power BI allows you to integrate data from various sources, including Excel, and visualize it in interactive charts, tables, and slicers. It enables real-time monitoring of KPIs and helps institutions make data-driven decisions.
3) Can I customize the KPIs in the dashboard?
Yes, the Online Education KPI Dashboard can be customized to fit the specific needs of your institution. You can add or remove KPIs, adjust targets, and configure the dashboard to suit your performance tracking requirements.
4) Is this dashboard suitable for small online education platforms?
Yes, this dashboard is flexible and scalable, making it suitable for both small and large online education platforms. It allows you to track important KPIs regardless of the size of your institution.
5) How do I update the data in the Excel file?
The Excel file used as the data source is simple to update. You can enter the Actual and Target values for MTD and YTD directly into the relevant worksheets, and the dashboard will automatically refresh with the new data.
Visit our YouTube channel to learn step-by-step video tutorials