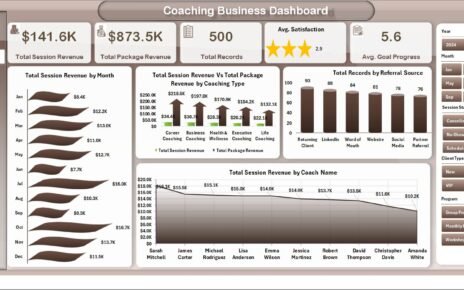
Copywriting teams and content creators handle many tasks every day. They plan ideas, write drafts, create visuals, review content, track deadlines, and manage performance. Because of this, it becomes difficult to monitor productivity and measure the real impact of the content. A Copywriting & Content Creation Dashboard in Excel solves this problem in a simple and organized way.
This dashboard helps you understand how your content performs, how much time you invest, and how efficiently your team works. It also gives you real-time visibility into views, clicks, content types, categories, and monthly progress. In this article, I explain each part of the dashboard in detail so you can use it with full clarity.
Click to buy Copywriting & Content Creation Dashboard in Excel
What Is a Copywriting & Content Creation Dashboard in Excel?
A Copywriting & Content Creation Dashboard in Excel is a ready-to-use Excel tool that tracks content performance and team productivity. It gives you insights into engagement, workload, efficiency, and content output across multiple content formats, categories, and platforms. You can measure views, clicks, estimated hours, actual hours, word count, and publishing status in one place.
With this dashboard, you improve your planning, reduce delays, and track your team’s progress with more accuracy.
What Does the Copywriting & Content Creation Dashboard Include?
This dashboard includes several sheet tabs that show all important insights. Each tab focuses on a different part of the content lifecycle, which helps you understand how your team performs and how your content works across channels.
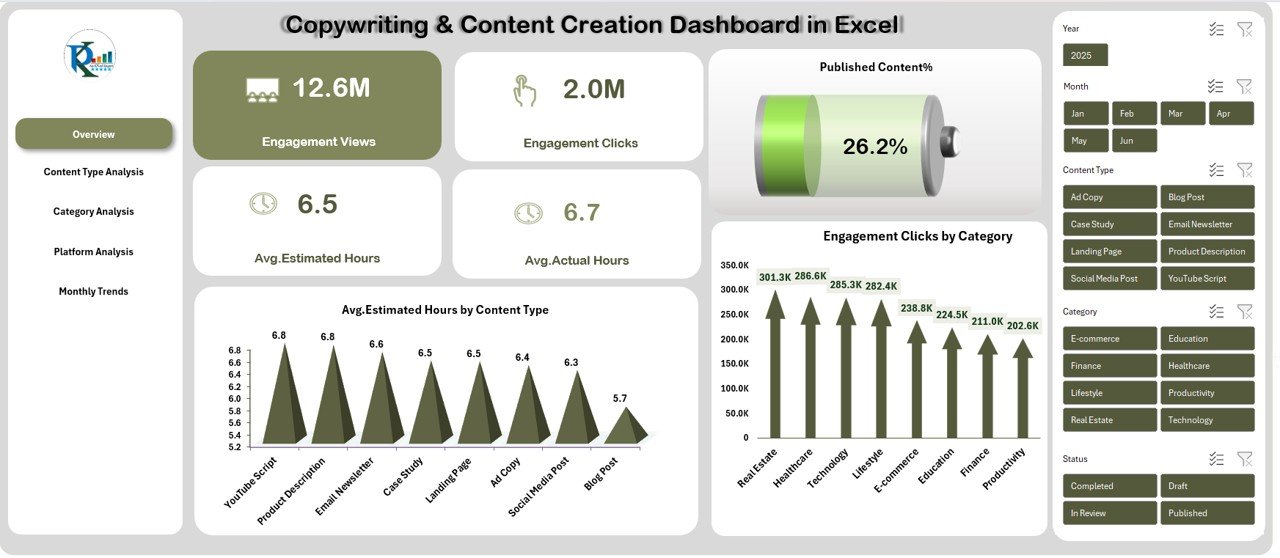
Overview Sheet Tab – What Does It Show?
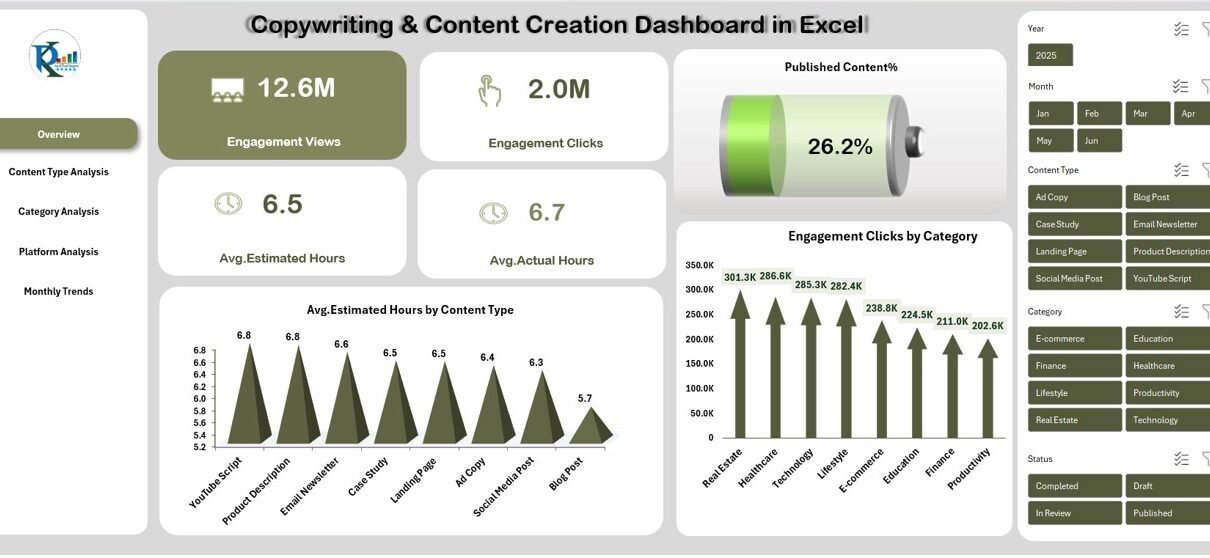
The Overview page gives a clear and simple snapshot of content performance. You see the most important KPIs without moving to other sheets.
Key Metrics on the Overview Page
- Engagement Views
- Engagement Clicks
- Average Estimated Hours
- Average Actual Hours
- Published Content %
Visuals on the Overview Page
- Avg. Estimated Hours by Content Type – Helps you see which content takes more planning time.
- Engagement Clicks by Category – Shows which category attracts the highest engagement.
This tab helps you understand the big picture instantly.
Click to buy Copywriting & Content Creation Dashboard in Excel
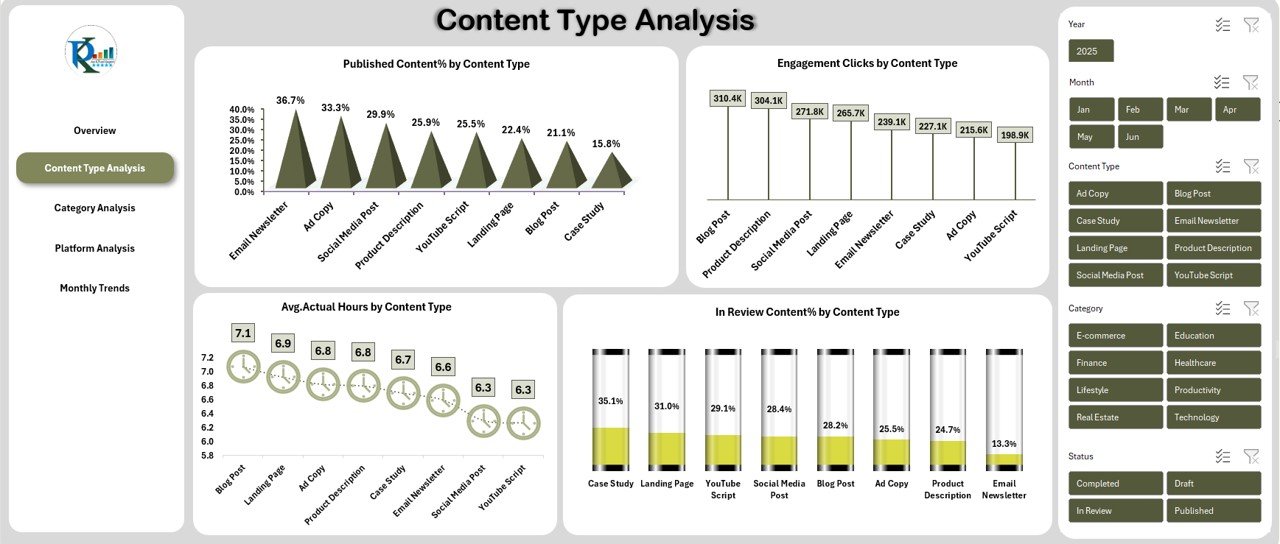
Content Type Analysis – Why Is It Useful?
This tab focuses on content formats such as blogs, videos, social media posts, reels, newsletters, or ads.
Insights You Get
- Published Content % by Content Type – Helps you know how efficiently each content type moves to publishing.
- Avg. Actual Hours by Content Type – Shows how long different content formats take to complete.
- Engagement Clicks by Content Type – Helps you identify content that performs the best.
- In Review Content % by Content Type – Shows how much content remains in the approval stage.
With these visuals, you improve your team’s workload distribution.
Click to buy Copywriting & Content Creation Dashboard in Excel
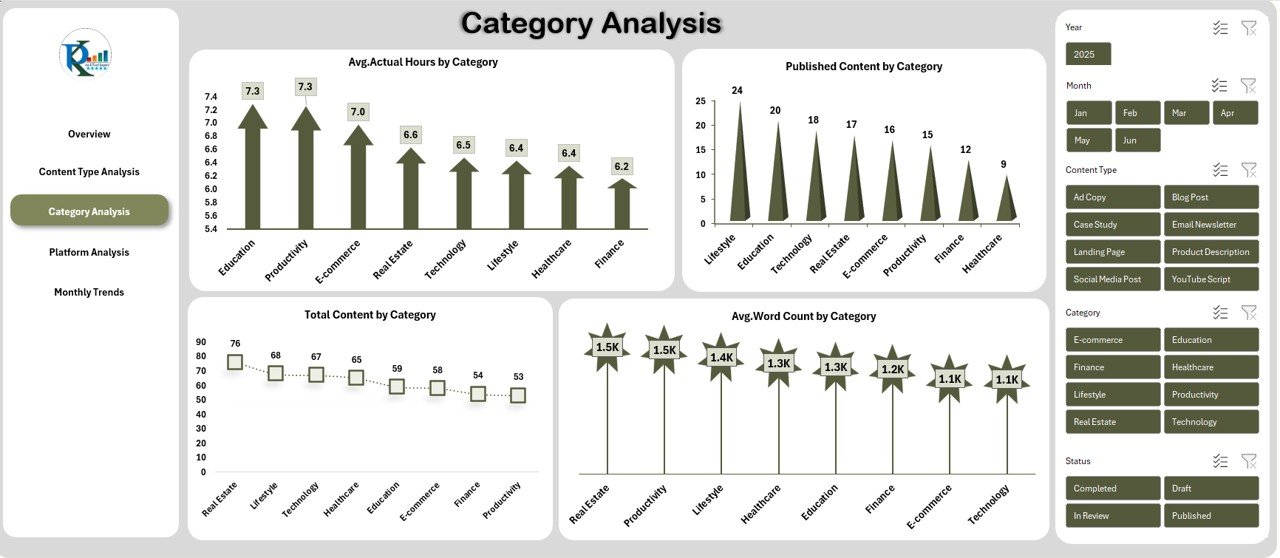
Category Analysis – What Can You Learn?
Content categories may include Marketing, Sales, Education, Training, Product, Design, Thought Leadership, etc.
Key Insights in This Tab
- Avg. Actual Hours by Category
- Total Content by Category
- Avg. Word Count by Category
This helps you understand which categories require more time, which categories deliver more content, and how the writing style changes based on topics.
Click to buy Copywriting & Content Creation Dashboard in Excel
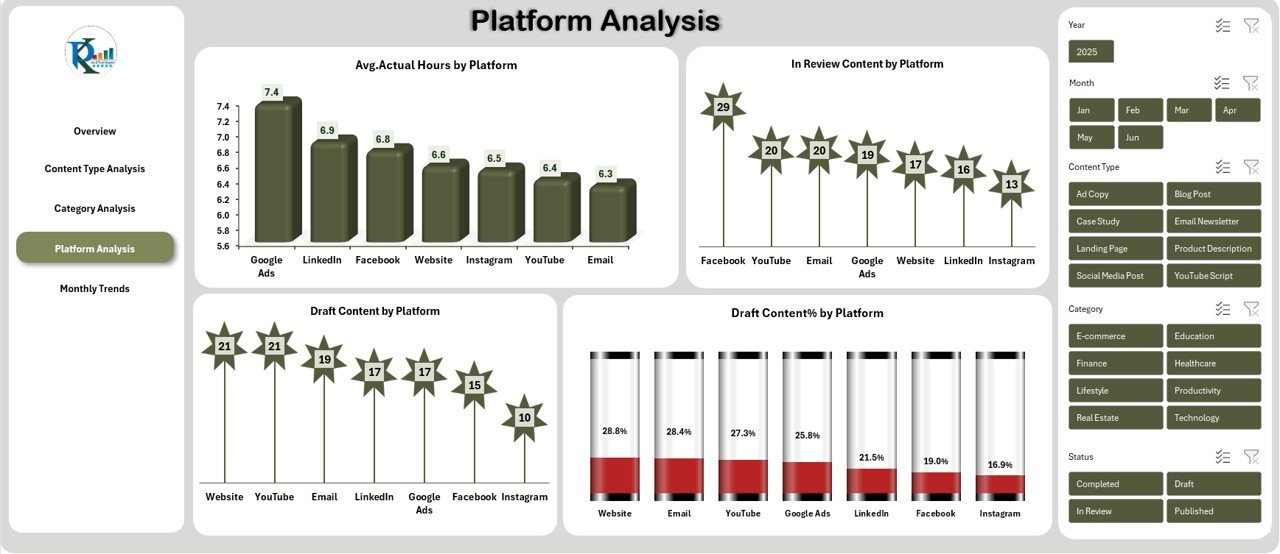
Platform Analysis – How Does It Help You?
Every platform performs differently. For example, LinkedIn may bring more engagement, while Instagram may deliver more reach.
Insights in This Tab
- Avg. Actual Hours by Platform
- Draft Content by Platform
- In Review Content by Platform
- Draft Content % by Platform
This analysis helps you choose the right platform for each content type.
Click to buy Copywriting & Content Creation Dashboard in Excel
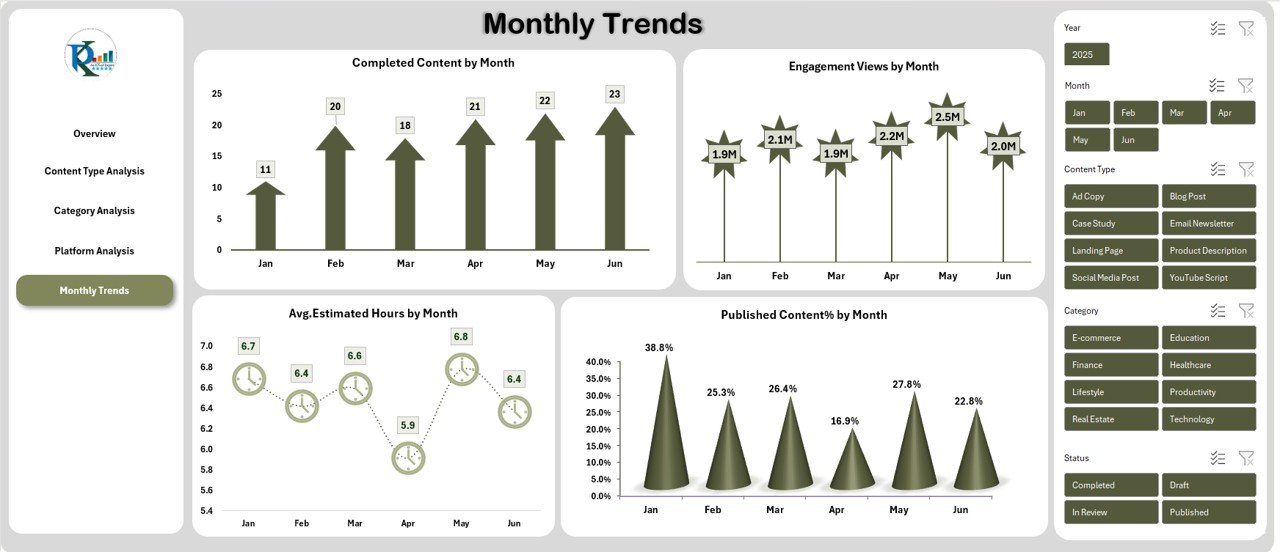
Monthly Trends – Why Should You Track Them?
Monthly trends help you understand progress over time. You can track improvements, content volume, and engagement patterns.
Metrics You See
- Completed Content by Month
- Avg. Estimated Hours by Month
- Engagement Views by Month
- Published Content % by Month
This tab helps you plan future content calendars more effectively.
Click to buy Copywriting & Content Creation Dashboard in Excel
Advantages of the Copywriting & Content Creation Dashboard in Excel
Using this dashboard gives you many benefits that improve your workflow and content performance.
Clear Visibility of Team Productivity
You get instant clarity on estimated hours, actual hours, drafts, review status, and completed tasks.
Better Content Planning
You compare content types, categories, and platforms easily. This helps you plan smarter and faster.
Faster Decision-Making
Since the dashboard provides real-time insights, you take decisions quickly and manage deadlines easily.
Improved Content Performance
You track views, clicks, and publishing rates, which helps you optimize your content strategy.
Useful for All Types of Teams
Marketing teams, agencies, freelancers, and corporate content teams can use this dashboard seamlessly.
Best Practices for the Copywriting & Content Creation Dashboard
Use these simple tips to get the best results from your dashboard.
Update the data weekly or monthly
This keeps your insights fresh and accurate.
Maintain clean and structured input sheets
Clean data gives cleaner and more reliable analysis.
Compare Estimated Hours vs Actual Hours regularly
It helps you improve efficiency and manage deadlines better.
Use category and platform insights to refine content strategy
Focus more on content types and platforms that drive results.
Track publishing percentage every month
This shows how your content pipeline performs over time.
Conclusion
A Copywriting & Content Creation Dashboard in Excel helps you track your entire content process in a simple and clear way. You get insights on engagement, workload, categories, platforms, and monthly performance. When you use this dashboard regularly, you improve productivity, reduce delays, and create better content faster.
Frequently Asked Questions (FAQs)
- Who should use this dashboard?
Content writers, marketing teams, agencies, freelancers, and social media teams benefit the most from this dashboard.
- Can I customize the dashboard based on my workflow?
Yes, you can modify categories, content types, platforms, and KPIs based on your needs.
- Do I need advanced Excel skills to use it?
No, the dashboard uses simple formulas, slicers, and charts. Anyone with basic Excel knowledge can use it.
- Does the dashboard support large content teams?
Yes, it works well for small and large teams. You can add unlimited content records.
- Can I track engagement trends over time?
Yes, the Monthly Trends sheet shows engagement views and clicks by month.
Visit our YouTube channel to learn step-by-step video tutorials
Watch the step-by-step video tutorial:
Click to buy Copywriting & Content Creation Dashboard in Excel