Managing tax advisory services demands accuracy, speed, and constant performance tracking. However, many tax firms still rely on scattered Excel files, manual reports, and delayed reviews. As a result, decision-makers often miss critical insights. This is exactly where a Tax Advisory KPI Dashboard in Power BI becomes an essential strategic tool.
In this comprehensive guide, you will learn what a Tax Advisory KPI Dashboard in Power BI is, how it works, why it matters, its key features, advantages, best practices, and frequently asked questions. Moreover, this article explains everything in simple language, so you can apply it immediately in real-world tax advisory operations.
Click to buy Tax Advisory KPI Dashboard in Power BI
What Is a Tax Advisory KPI Dashboard in Power BI?
A Tax Advisory KPI Dashboard in Power BI is a ready-to-use analytical solution designed to track, monitor, and evaluate key performance indicators related to tax advisory services. Instead of reviewing static reports, this dashboard provides dynamic visuals, real-time comparisons, and drill-through insights.
Because Power BI connects seamlessly with Excel, this dashboard uses structured Excel sheets as the data source. As you update actuals and targets monthly, the dashboard refreshes automatically. Consequently, tax leaders can analyze performance without technical complexity.
What Makes This Dashboard Unique?
- It centralizes all tax advisory KPIs in one place
- It compares Actual vs Target vs Previous Year
- It tracks MTD (Month-to-Date) and YTD (Year-to-Date) metrics
- It uses visual indicators for faster decision-making
Why Do Tax Advisory Firms Need a KPI Dashboard?
Tax advisory firms handle multiple compliance activities, advisory engagements, timelines, and client expectations. Therefore, manual tracking always leads to inefficiencies.
A Tax Advisory KPI Dashboard in Power BI helps firms:
- Track advisory performance continuously
- Identify overperforming and underperforming KPIs
- Improve compliance timelines and quality
- Make data-driven decisions quickly
Additionally, because tax rules change frequently, firms must react faster. This dashboard supports proactive adjustments rather than reactive corrections.
How Does the Tax Advisory KPI Dashboard in Power BI Work?
This dashboard pulls structured data from Excel and transforms it into interactive Power BI visuals. As a result, users get actionable insights without writing code.
Data Flow Overview
- Data entry happens in Excel
- Power BI connects to Excel worksheets
- KPIs calculate automatically
- Dashboards update instantly
Because of this flow, even non-technical users can maintain the dashboard smoothly.
Pages Included in the Tax Advisory KPI Dashboard in Power BI
This dashboard includes three powerful pages, each designed for a specific analytical purpose.
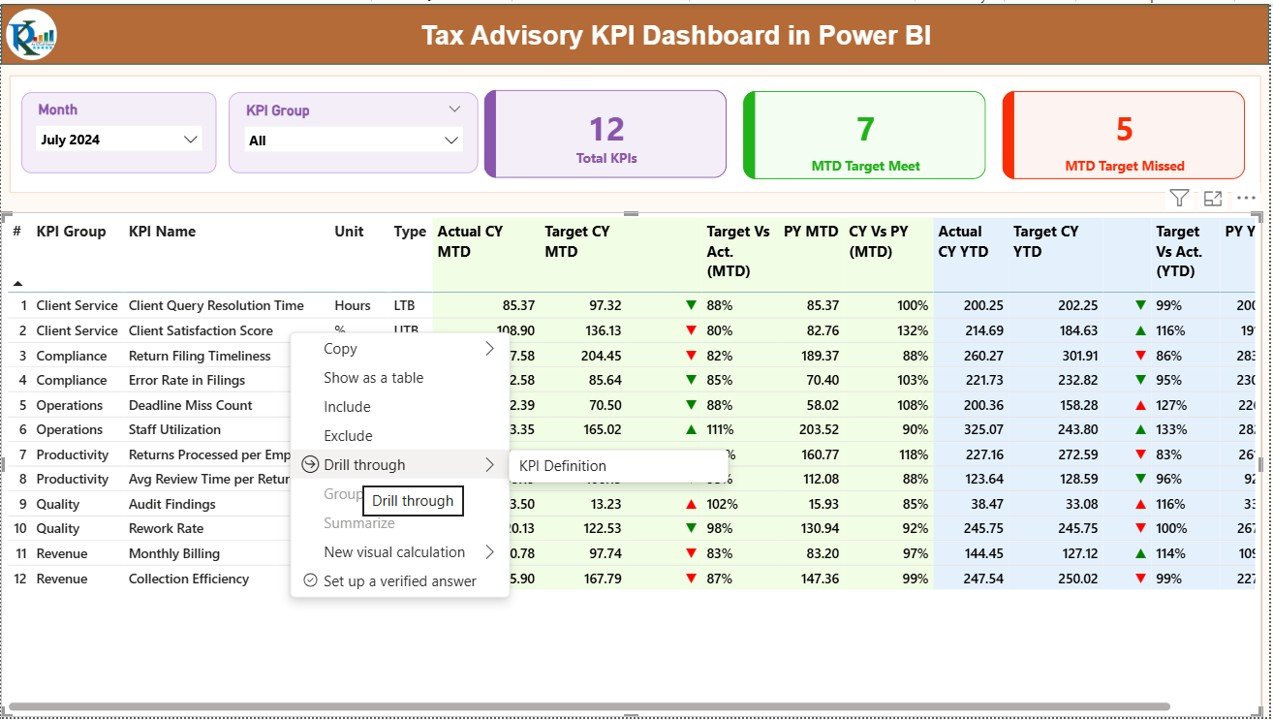
the Summary Page
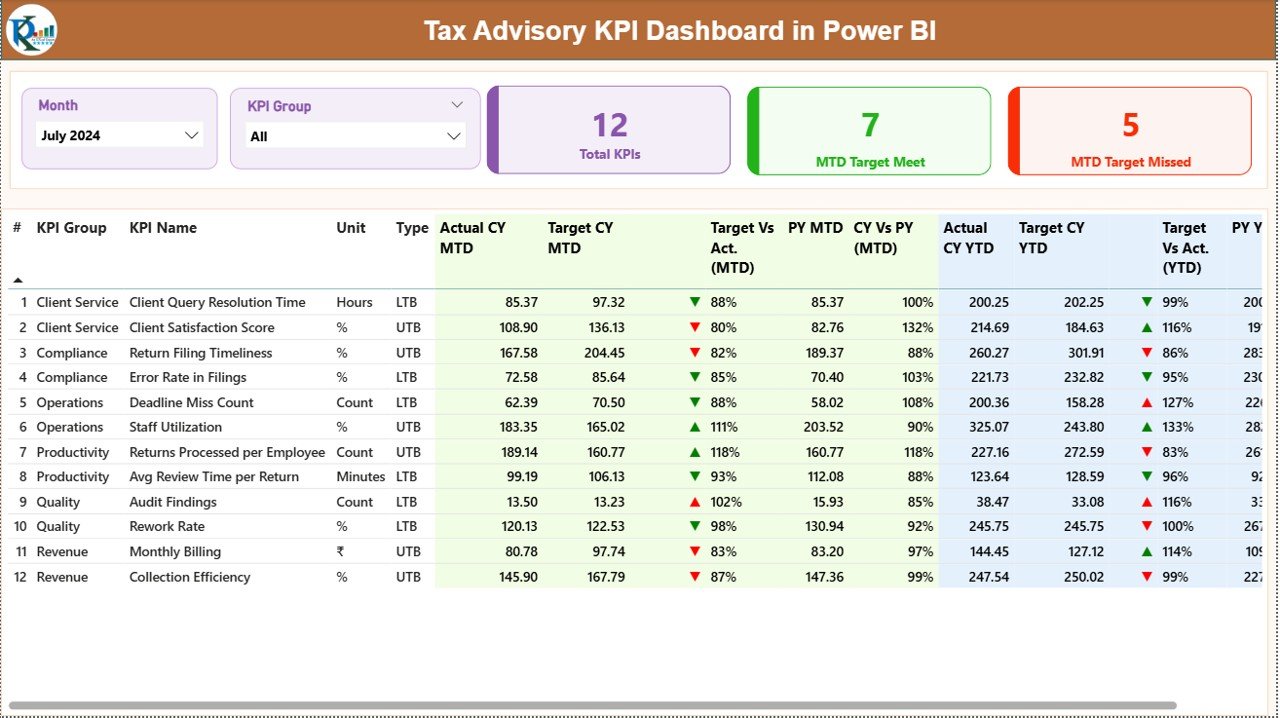
The Summary Page acts as the main control center for tax performance monitoring.
Key Elements on the Summary Page
- Slicers for Easy Filtering
At the top of the dashboard, you get:
- Month slicer
- KPI Group slicer
These slicers allow you to analyze performance for a specific period and KPI category instantly.
- KPI Performance Cards
The dashboard displays three key cards:
- Total KPIs Count
- MTD Target Meet Count
- MTD Target Missed Count
Therefore, you can assess overall performance status at a glance.
- Detailed KPI Table
Below the cards, a detailed table displays crucial KPI metrics such as:
- KPI Number
- KPI Group
- KPI Name
- Unit
- KPI Type (LTB or UTB)
- Actual CY MTD
- Target CY MTD
- MTD Status Icons
- Target vs Actual % (MTD)
- Previous Year MTD
- CY vs PY % (MTD)
- Actual CY YTD
- Target CY YTD
- YTD Status Icons
- Target vs Actual % (YTD)
- PY YTD
- CY vs PY % (YTD)
Because of conditional formatting, red and green arrows instantly highlight KPI status.
Why Are MTD and YTD KPIs Important in Tax Advisory?
MTD and YTD tracking ensures continuous control over tax engagements.
- MTD KPIs show short-term performance
- YTD KPIs highlight long-term trends
Together, they provide a balanced performance view.
Click to buy Tax Advisory KPI Dashboard in Power BI
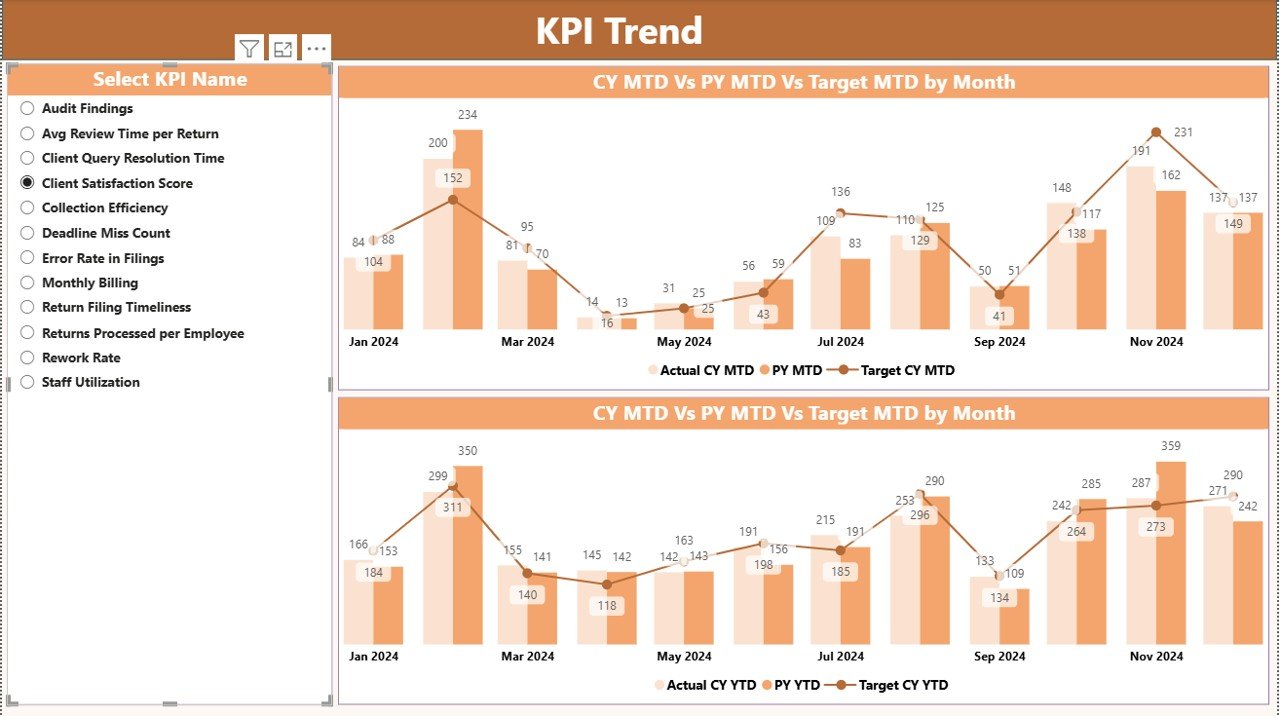
the KPI Trend Page .
The KPI Trend Page helps users analyze performance movement over time.
Key Features of the KPI Trend Page
- Two Combo Charts for MTD and YTD
- Chart comparison for:
- Current Year Actual
- Previous Year Actual
- Target
- KPI Name slicer on the left
Because trend analysis plays a major role in forecasting, this page supports better planning decisions.
Click to buy Tax Advisory KPI Dashboard in Power BI
Why Should You Analyze KPI Trends?
Trend analysis helps tax leaders:
- Predict compliance risks
- Identify recurring delays
- Adjust monthly targets
- Improve client satisfaction
Hence, trend charts transform raw numbers into strategic signals.
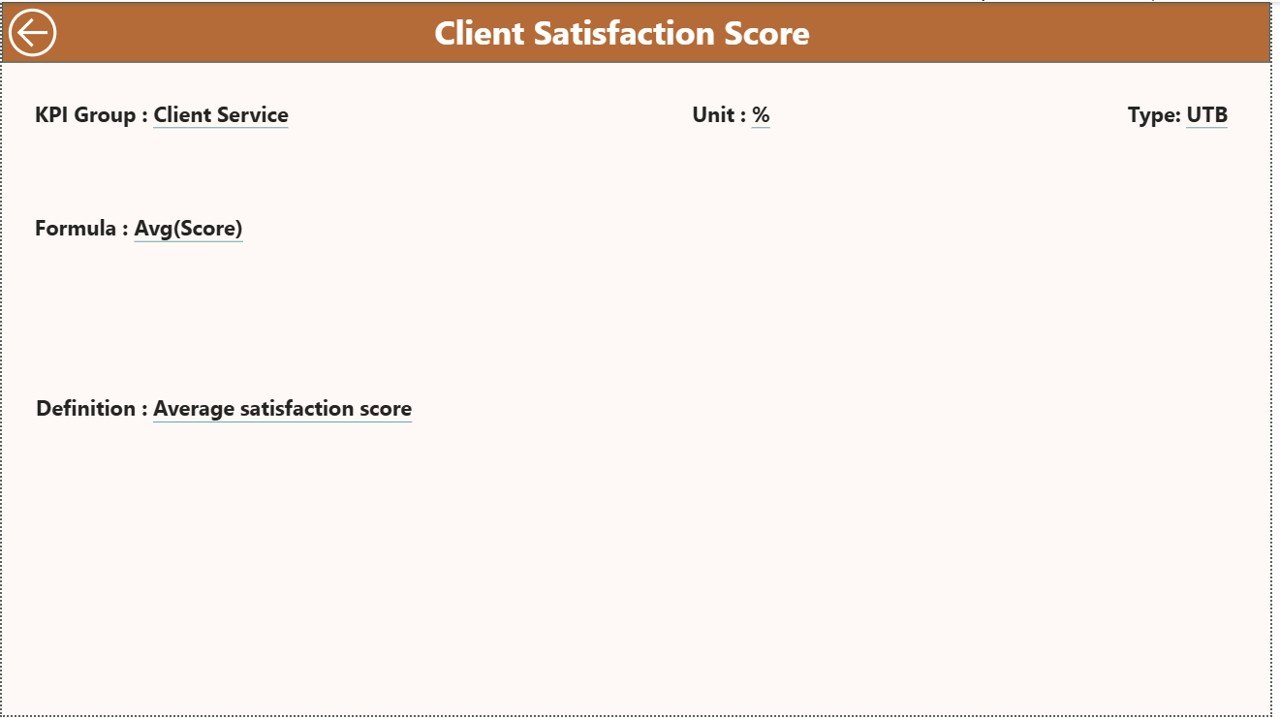
KPI Definition Page.
The KPI Definition Page acts as a hidden drill-through page.
Purpose of the KPI Definition Page
- Displays KPI formula
- Explains KPI definition
- Clarifies KPI intent
From the Summary Page, you can drill through any KPI to understand it better. After reviewing details, simply click the Back button at the top-left corner to return to the main page.
This design keeps the dashboard clean while offering deeper insights when required.
Click to buy Tax Advisory KPI Dashboard in Power BI
Excel Data Structure Behind the Dashboard
This dashboard uses Excel as its data source, which keeps data entry simple and transparent.
Excel Sheets Used in This Dashboard
Input_Actual Sheet
In this sheet, users enter:
- KPI Name
- Month (first date of the month)
- MTD Actual Values
- YTD Actual Values
Because the structure stays consistent, Power BI reads the data accurately.
Input_Target Sheet
Here, users enter:
- KPI Name
- Month
- MTD Target Values
- YTD Target Values
Targets serve as benchmarks for evaluating actual performance.
Click to buy Tax Advisory KPI Dashboard in Power BI
KPI Definition Sheet
This sheet stores master KPI data:
- KPI Number
- KPI Group
- KPI Name
- Unit
- Formula
- Definition
- KPI Type (LTB or UTB)
Because definitions stay centralized, KPI interpretation remains consistent.
Advantages of Tax Advisory KPI Dashboard in Power BI
Using this dashboard delivers multiple operational and strategic benefits.
Centralized KPI Monitoring
All tax advisory KPIs appear in one dashboard, which eliminates confusion.
Faster Decision-Making
Visual indicators highlight issues instantly, so leaders act faster.
Improved Accuracy
Automated calculations reduce manual errors significantly.
Better Compliance Control
MTD and YTD analysis helps firms meet deadlines consistently.
Historical Performance Comparison
CY vs PY analysis reveals improvement areas clearly.
Scalable and Flexible
You can add new KPIs and months without redesigning the dashboard.
Best Practices for the Tax Advisory KPI Dashboard in Power BI
Following best practices ensures long-term dashboard success.
Define KPIs Clearly
Always maintain accurate formulas and definitions within the KPI Definition sheet.
Update Data Regularly
Monthly updates keep insights relevant and actionable.
Use Logical KPI Groups
Grouping KPIs improves analysis clarity and navigation.
Review Trends Monthly
Trend analysis helps detect risks before they escalate.
Protect Excel Structure
Avoid changing column names and formats to prevent data errors.
Who Can Use This Dashboard?
This dashboard suits:
- Tax advisory firms
- Accounting professionals
- Finance consultants
- Compliance teams
- Tax managers and partners
Because the system requires no coding, any Excel and Power BI user can manage it confidently.
How Does This Dashboard Improve Client Satisfaction?
When tax firms track performance properly:
- Response times improve
- Compliance accuracy increases
- Missed deadlines reduce
- Advisory quality improves
As a result, client trust and retention grow consistently.
How Is This Dashboard Different from Traditional Tax Reports?
Traditional reports remain static and outdated quickly. In contrast:
- Power BI dashboards update automatically
- Visuals reveal trends instantly
- Drill-through pages add depth
- Slicers allow customized views
Therefore, dashboards deliver far superior insights.
Conclusion
A Tax Advisory KPI Dashboard in Power BI empowers tax professionals to track performance with clarity, accuracy, and speed. Instead of relying on fragmented spreadsheets, this dashboard centralizes KPI monitoring, improves decision-making, and supports long-term advisory excellence.
Moreover, because it integrates Excel with Power BI, the solution remains both powerful and easy to maintain. If you want full visibility into tax advisory performance, this dashboard provides the perfect foundation.
Frequently Asked Questions (FAQs)
- What is the main purpose of a Tax Advisory KPI Dashboard in Power BI?
The dashboard helps tax firms track performance, meet targets, and analyze trends using visual insights.
- Do I need advanced Power BI skills to use this dashboard?
No. Basic Power BI knowledge and Excel updates work perfectly.
- Can I customize KPIs in this dashboard?
Yes. You can add or edit KPIs through the KPI Definition sheet.
- How often should I update the data?
You should update data monthly for accurate MTD and YTD analysis.
- Can this dashboard handle large datasets?
Yes. Power BI handles large datasets efficiently.
- Does this dashboard support drill-through analysis?
Yes. You can drill through KPIs to view definitions and formulas.
- Is Excel mandatory as a data source?
This design uses Excel, although you can later extend it to databases if required.
Visit our YouTube channel to learn step-by-step video tutorials
Watch the step-by-step video tutorial:
Click to buy Tax Advisory KPI Dashboard in Power BI