In today’s competitive business environment, companies depend heavily on indirect and multi-channel sales models. Because organizations sell through distributors, partners, resellers, and direct channels, tracking performance becomes complex and time-consuming. As a result, many sales leaders struggle with scattered reports, delayed insights, and unclear profitability across channels.
That is exactly where a Channel Sales Dashboard in Power BI becomes essential.
A Channel Sales Dashboard in Power BI provides a centralized, interactive, and visual analytics solution that helps businesses monitor channel performance, sales trends, costs, profit margins, and customer segments in real time. Instead of relying on manual Excel reports or static MIS files, decision-makers gain instant visibility into what drives revenue and profitability.
In this in-depth guide, you will learn what a Channel Sales Dashboard in Power BI is, how it works, why it matters, what pages it includes, its advantages, best practices, real-world use cases, and frequently asked questions. Moreover, this article explains how organizations benefit from better channel insights and faster decision-making.
Click to Purchases Channel Sales Dashboard in Power BI
What Is a Channel Sales Dashboard in Power BI?
A Channel Sales Dashboard in Power BI is an interactive business intelligence report designed to analyze and monitor sales performance across different sales channels using Microsoft Power BI.
Instead of reviewing separate reports for distributors, retailers, online platforms, or direct sales teams, this dashboard consolidates all channel-related data into a single visual platform. Therefore, sales managers, channel managers, and executives can quickly understand:
-
Which channels generate the highest revenue
-
Which channels deliver the best profit margins
-
How costs impact overall channel profitability
-
How performance varies across regions, products, and customer segments
Because Power BI supports slicers, filters, interactive charts, and drill-downs, users can easily explore data from different perspectives without technical skills.
Why Do Businesses Need a Channel Sales Dashboard?
Managing channel sales without analytics often leads to blind decision-making. While raw data exists in ERP or CRM systems, it rarely provides actionable insights. Consequently, businesses face several challenges.
Common Challenges Without a Channel Sales Dashboard
-
Sales data scattered across multiple systems
-
Limited visibility into channel profitability
-
Delayed monthly or quarterly reporting
-
No clarity on high-performing and low-performing channels
-
Difficulty comparing regions, products, and customer segments
However, a Channel Sales Dashboard in Power BI solves these challenges by delivering real-time, structured, and visual insights.
How Does a Channel Sales Dashboard in Power BI Work?
A Channel Sales Dashboard works by connecting raw sales data to Power BI and transforming it into meaningful visuals.
Step-by-Step Working Process
-
Data Collection
Sales, cost, profit, and customer data is captured in Excel, ERP, CRM, or databases. -
Data Modeling
Power BI cleans, transforms, and creates relationships between tables such as sales, channels, products, regions, and customers. -
KPI Calculation
Measures like Gross Sales, Net Sales, Total Cost, Profit, and Profit Margin % are calculated using DAX. -
Visualization
Data is displayed using cards, charts, and tables for easy understanding. -
Interaction
Users apply slicers to filter data by time, region, channel type, product category, or customer segment.
As a result, management teams can move from raw numbers to meaningful insights in seconds.
Click to Purchases Channel Sales Dashboard in Power BI
Key Features of the Channel Sales Dashboard in Power BI
This Channel Sales Dashboard is built with five powerful pages, each designed to answer specific business questions.
What Happens on the Overview Page of the Channel Sales Dashboard?
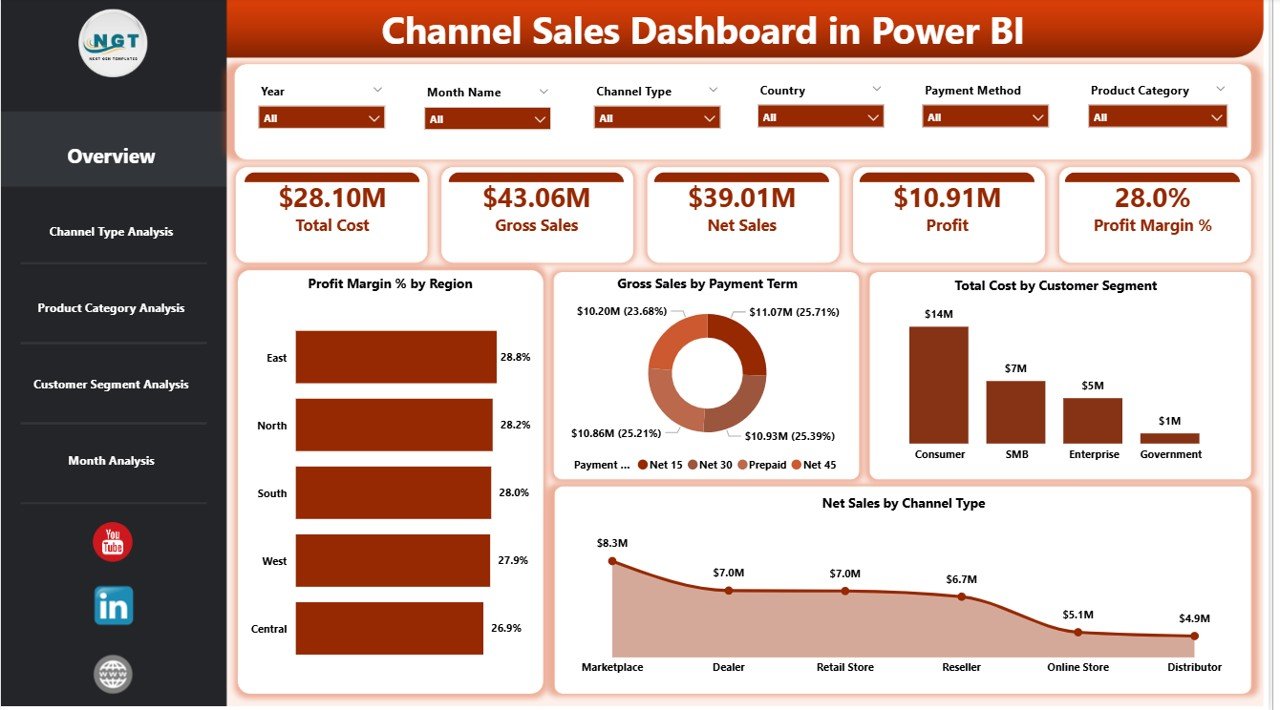
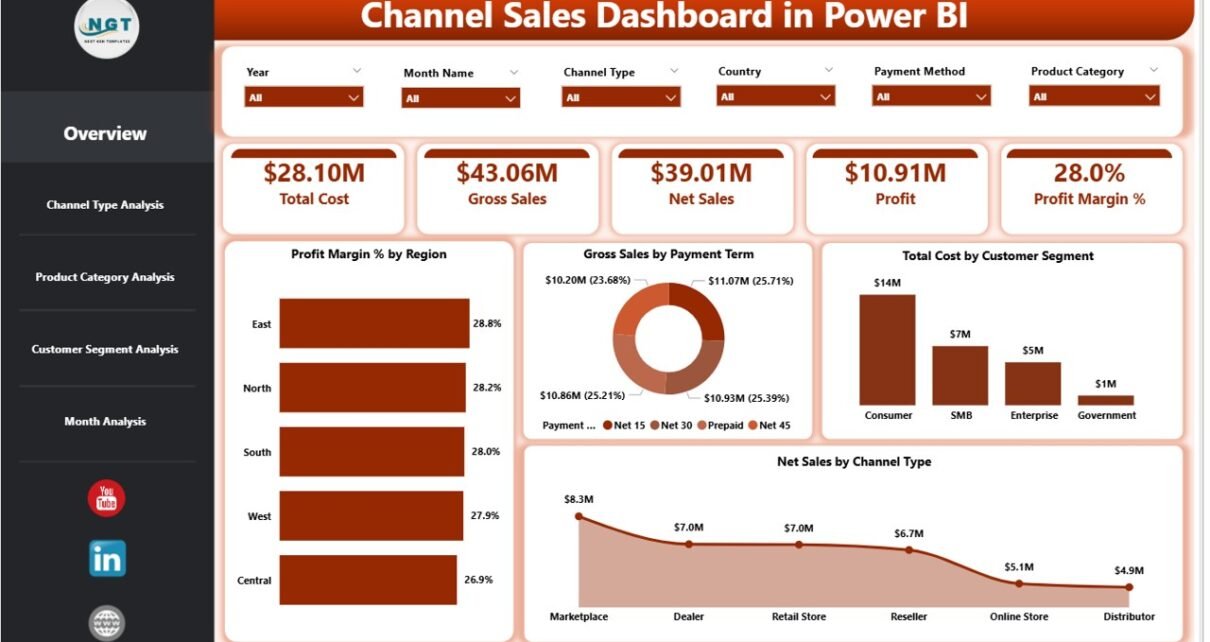
The Overview Page serves as the executive summary of channel sales performance. Because top management needs quick insights, this page highlights high-level KPIs and critical metrics.
Key Elements of the Overview Page
KPI Cards
-
Total KPIs at a glance
-
Quick visibility into overall performance
Charts Included
-
Profit Margin % by Region
Shows how profit margins vary across different regions, helping leaders identify high-margin markets. -
Gross Sales by Payment Term
Highlights how payment terms influence sales volume and customer behavior. -
Total Cost by Customer Segment
Displays cost distribution across different customer groups. -
Net Sales by Channel Type
Compares direct, distributor, online, and reseller channel performance.
Because slicers are available on this page, users can instantly filter results by month, region, or channel type.
How Does Channel Type Analysis Help Decision-Making?
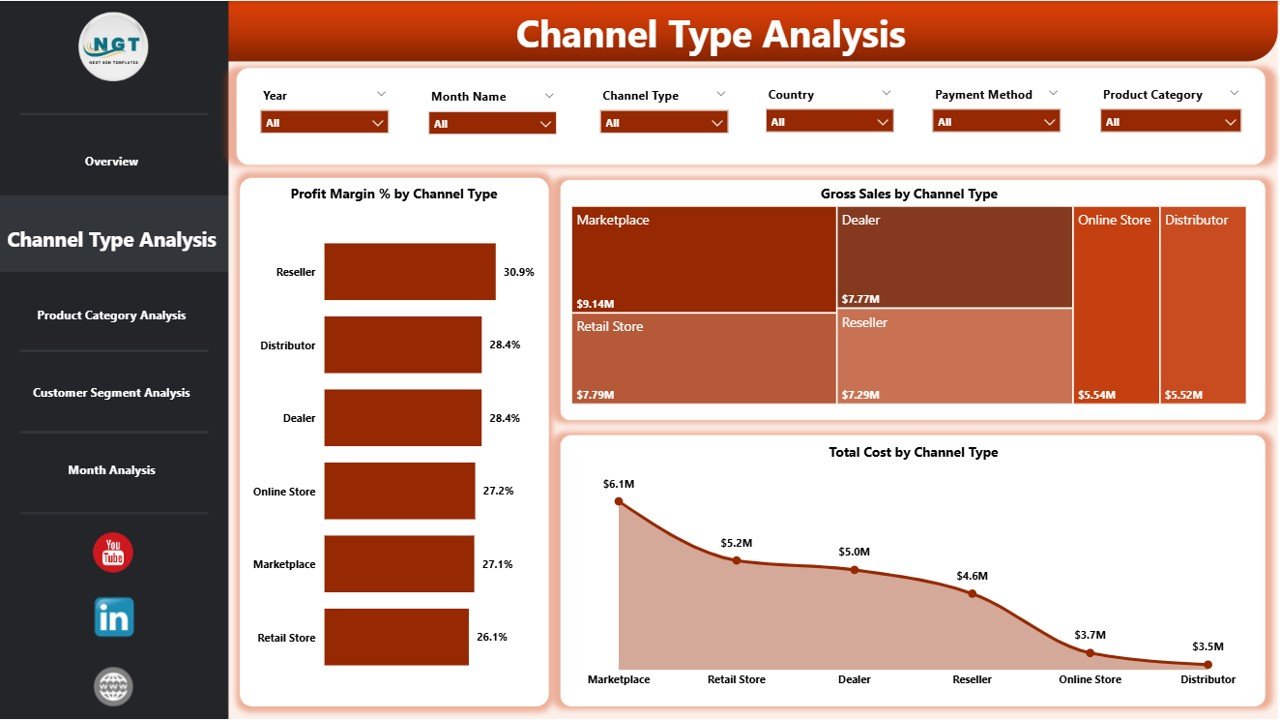
The Channel Type Analysis Page focuses on comparing performance across channel categories. Since every channel behaves differently, this page helps businesses allocate resources more effectively.
Charts on Channel Type Analysis Page
-
Profit Margin % by Channel Type
Identifies which channels deliver higher profitability. -
Gross Sales by Channel Type
Compares revenue generation across channel partners. -
Total Cost by Channel Type
Reveals cost-intensive channels that may reduce margins.
Consequently, sales leaders can quickly decide whether to expand, optimize, or discontinue specific channels.
Why Is Product Category Analysis Important in Channel Sales?
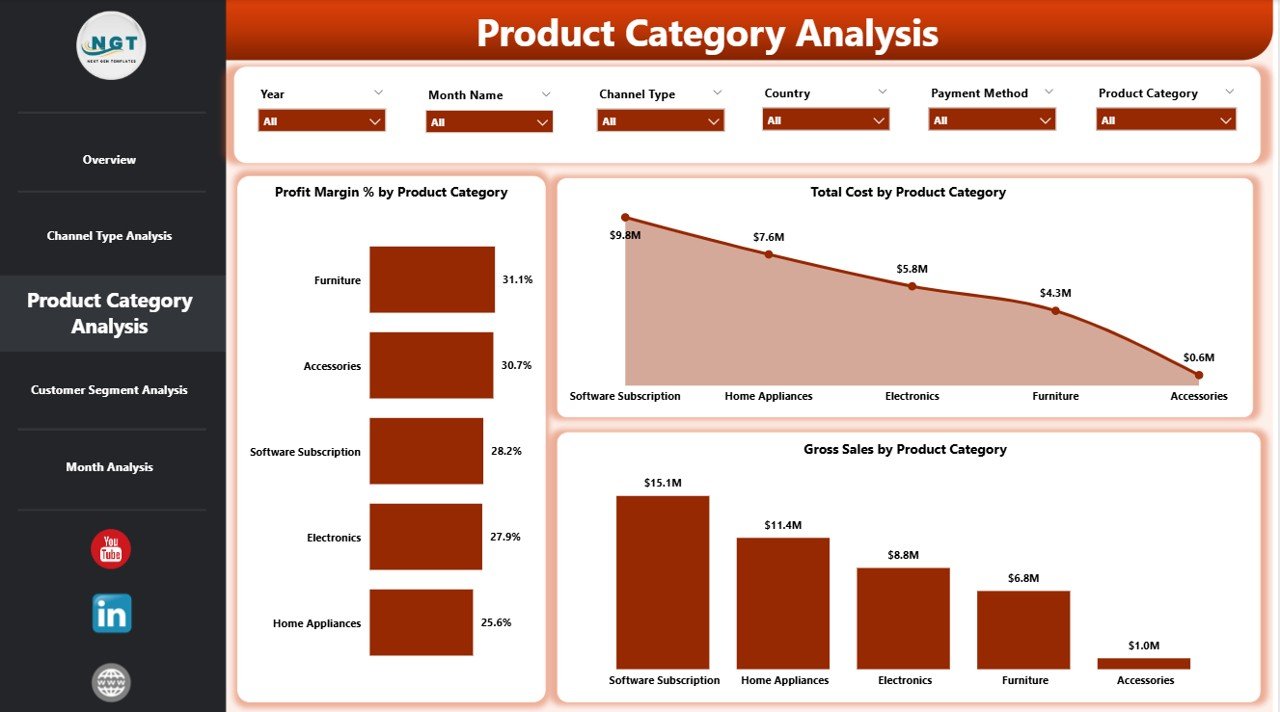
Product mix heavily influences channel performance. Therefore, understanding how different products perform across channels becomes crucial.
Product Category Analysis Page Metrics
-
Profit Margin % by Product Category
Highlights which product categories deliver the best margins. -
Gross Sales by Product Category
Shows revenue contribution of each category. -
Total Cost by Product Category
Identifies high-cost product lines that impact pricing strategies.
With this clarity, businesses can refine pricing, promotions, and channel-product alignment.
Click to Purchases Channel Sales Dashboard in Power BI
How Does Customer Segment Analysis Improve Profitability?
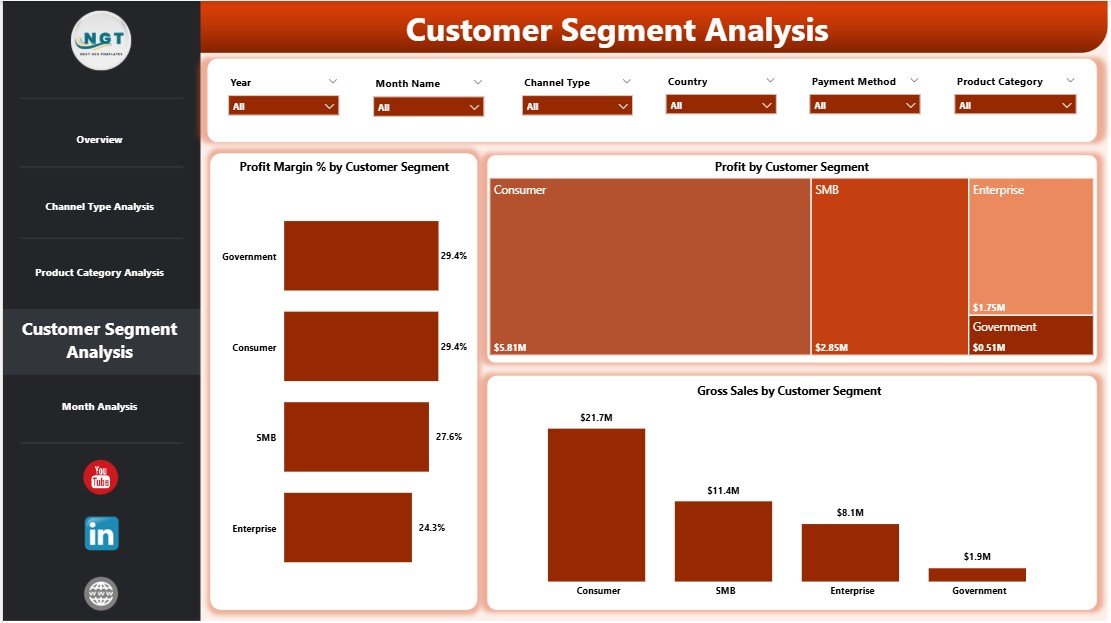
Different customer segments respond differently to pricing, discounts, and channel strategies. As a result, a Customer Segment Analysis Page becomes vital.
Customer Segment Analysis Charts
-
Profit Margin % by Customer Segment
Helps identify high-value customer groups. -
Gross Sales by Customer Segment
Displays revenue distribution by customer type. -
Profit by Customer Segment
Highlights which segments drive overall profitability.
Using this data, companies can design targeted sales strategies and optimize discounts.
What Insights Does the Monthly Trends Page Provide?
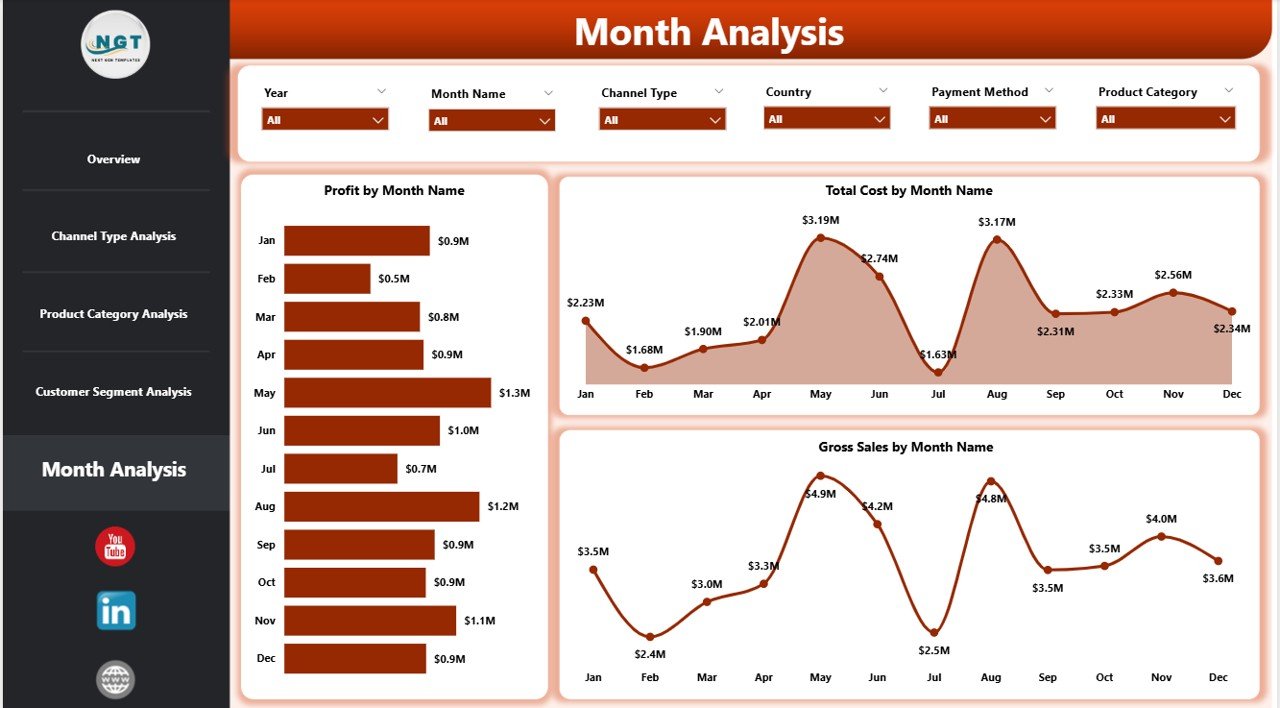
The Monthly Trends Page focuses on time-based performance analysis. Because trends reveal patterns, this page helps forecast and plan effectively.
Monthly Trend Charts
-
Profit by Month
Tracks profit fluctuations over time. -
Gross Sales by Month
Identifies seasonality and growth patterns. -
Total Cost by Month
Highlights cost spikes and operational inefficiencies.
Therefore, businesses can proactively manage risks and prepare for future demand.
Advantages of Channel Sales Dashboard in Power BI
Implementing a Channel Sales Dashboard delivers measurable business benefits.
✅ Improved Visibility
-
Complete view of channel sales in one place
-
Clear profit and cost insights
✅ Faster Decision-Making
-
Real-time data access
-
No dependency on manual reports
✅ Better Channel Strategy
-
Identify high-performing and underperforming channels
-
Optimize partner management
✅ Data-Driven Resource Allocation
-
Focus marketing and sales investments on profitable channels
✅ Scalability & Flexibility
-
Easily add new channels, regions, or products
-
Adapt dashboards as business grows
Opportunities for Improvement in Channel Sales Analytics
While dashboards provide powerful insights, businesses should continuously enhance them.
-
Add predictive forecasting models
-
Include target vs actual KPIs
-
Integrate CRM and ERP data in real time
-
Use role-based dashboards for managers and executives
These improvements further increase dashboard value and adoption.
Best Practices for the Channel Sales Dashboard in Power BI
Click to Purchases Channel Sales Dashboard in Power BI
To maximize impact, organizations should follow proven best practices.
✅ Keep KPIs Simple and Relevant
Focus only on metrics that drive decisions, such as profit margin, sales, and cost.
✅ Use Consistent Definitions
Ensure that sales, cost, and profit calculations remain consistent across reports.
✅ Design for Business Users
Use clear labels, intuitive visuals, and logical layouts.
✅ Use Slicers Wisely
Too many slicers confuse users; therefore, keep them purposeful.
✅ Refresh Data Regularly
Schedule automatic refreshes to maintain accuracy.
✅ Document Dashboard Logic
Maintain documentation for KPI formulas and assumptions.
Who Should Use a Channel Sales Dashboard in Power BI?
This dashboard benefits multiple stakeholders.
-
Channel Sales Managers
-
Sales Directors and VPs
-
Business Analysts
-
Finance Teams
-
Marketing Leaders
-
Strategy and Planning Teams
Because insights remain visual and interactive, even non-technical users can work confidently with data.
Real-World Use Cases of Channel Sales Dashboard
Retail & FMCG
Track distributor and retailer performance region-wise.
Technology & SaaS
Analyze partner channel revenue and cost efficiency.
Manufacturing
Monitor dealer networks and product category sales.
Wholesale & Distribution
Optimize margins and reduce channel conflicts.
Conclusion
A Channel Sales Dashboard in Power BI transforms complex sales data into meaningful insights that drive smarter, faster, and more confident decisions. By consolidating channel, product, customer, and trend data into one centralized platform, businesses gain full control over revenue and profitability.
Moreover, with interactive visuals, real-time filtering, and scalable architecture, this dashboard becomes a long-term strategic asset—not just a reporting tool. When organizations follow best practices and continuously improve analytics, channel sales performance reaches a new level of maturity.
Frequently Asked Questions (FAQs)
What data sources can I use for a Channel Sales Dashboard in Power BI?
You can use Excel, ERP systems, CRM platforms, SQL databases, and cloud data sources.
Can I customize the Channel Sales Dashboard?
Yes, Power BI dashboards allow full customization, including new KPIs, charts, and filters.
Is Power BI suitable for small businesses?
Yes, Power BI works well for small, medium, and large organizations due to its scalability.
How often should the dashboard data be refreshed?
Ideally, schedule daily or real-time refresh based on business needs.
Do I need coding skills to use this dashboard?
No, end users only need basic dashboard interaction skills.
Can I share the dashboard with my team?
Yes, Power BI supports secure sharing through Power BI Service.
Visit our YouTube channel to learn step-by-step video tutorials