Asset management companies operate in a highly competitive, data-driven, and regulated environment. Therefore, tracking performance accurately becomes essential for growth, compliance, and investor confidence. However, when organizations rely on scattered Excel reports or manual tracking, they lose visibility and speed. That is why an Asset Management Companies KPI Dashboard in Power BI plays a vital role.
An Asset Management Companies KPI Dashboard in Power BI provides a centralized, interactive, and visual way to monitor operational, financial, and performance KPIs. Moreover, because this dashboard uses Excel as the data source and Power BI for visualization, it remains easy to maintain and powerful at the same time.
In this detailed article, you will learn what this dashboard is, why asset management companies need it, how it works, its structure, advantages, best practices, and common FAQs. In addition, the article uses clear language and practical explanations so that anyone can understand and implement it.
Click to Purchases Asset Management Companies KPI Dashboard in Power BI
What Is an Asset Management Companies KPI Dashboard in Power BI?
An Asset Management Companies KPI Dashboard in Power BI is a ready-to-use analytical dashboard designed to track, analyze, and visualize key performance indicators related to asset management operations.
Instead of reviewing multiple spreadsheets, reports, and emails, this dashboard brings all KPIs into one interactive Power BI report. As a result, stakeholders can monitor Month-to-Date (MTD) and Year-to-Date (YTD) performance with real-time insights.
Moreover, since the dashboard connects directly to Excel, users can update data easily without technical complexity. Once refreshed, Power BI automatically recalculates KPIs and updates visuals.
Why Do Asset Management Companies Need a KPI Dashboard?
Asset management firms deal with large portfolios, performance targets, regulatory expectations, and investor scrutiny. Therefore, they must track performance continuously and accurately.
An Asset Management Companies KPI Dashboard in Power BI helps organizations:
Monitor performance against defined targets
Compare current year results with previous year trends
Identify underperforming KPIs quickly
Improve transparency and accountability
Support data-driven strategic decisions
Additionally, Power BI dashboards allow leadership teams to explore data interactively instead of relying on static reports.
How Does the Asset Management Companies KPI Dashboard in Power BI Work?
The dashboard follows a simple yet structured approach using Excel as the backend and Power BI as the front-end visualization tool.
Step-by-Step Process
Enter KPI data in structured Excel sheets
Load the Excel file into Power BI
Refresh the dataset
Use slicers to filter Month, KPI Group, or KPI Name
Analyze MTD, YTD, targets, and trends
Drill through for KPI definitions
Because of this workflow, organizations can maintain accuracy while reducing reporting effort.
Click to Purchases Asset Management Companies KPI Dashboard in Power BI
What Are the Key Pages in the Asset Management Companies KPI Dashboard?
The dashboard contains three well-designed pages, each focusing on a specific type of analysis.
What Information Does the Summary Page Provide?

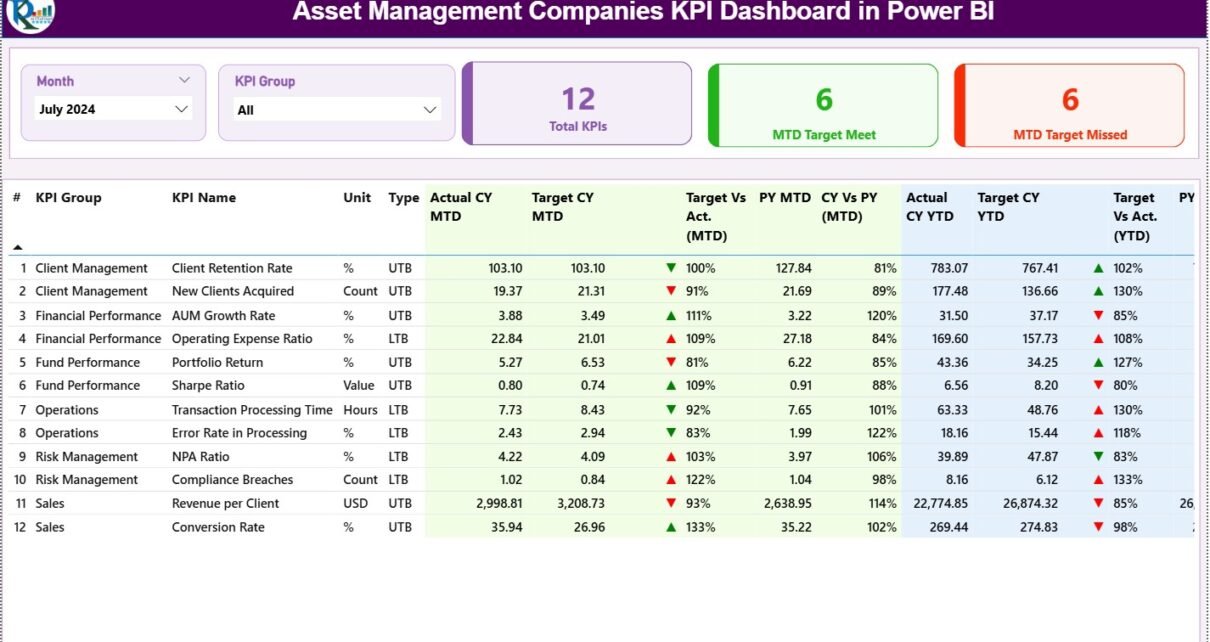
The Summary Page acts as the main control panel of the dashboard. It provides a quick overview as well as detailed KPI-level information.
Top Slicers on the Summary Page
Month Slicer – Change reporting month instantly
KPI Group Slicer – Filter KPIs by category
These slicers allow users to focus on relevant data quickly.
KPI Performance Cards
At the top of the Summary Page, three KPI cards display:
Total KPIs Count
MTD Target Meet Count
MTD Target Missed Count
These cards provide an instant snapshot of overall performance.
Detailed KPI Table Explanation
Below the cards, a detailed table presents complete KPI performance data.
Columns included in the table:
KPI Number – Unique sequence number of each KPI
KPI Group – Category or group of the KPI
KPI Name – Name of the KPI
Unit – Unit of measurement
Type – UTB (Upper the Better) or LTB (Lower the Better)
Actual CY MTD – Current Year Month-to-Date actual value
Target CY MTD – Current Year Month-to-Date target value
MTD Icon – ▲ or ▼ indicator with green/red color
Target vs Actual (MTD) – Actual ÷ Target percentage
PY MTD – Previous Year MTD value
CY vs PY (MTD) – CY MTD ÷ PY MTD comparison
Actual CY YTD – Current Year Year-to-Date actual
Target CY YTD – Current Year Year-to-Date target
YTD Icon – ▲ or ▼ indicator for YTD
Target vs Actual (YTD) – Actual ÷ Target YTD
PY YTD – Previous Year YTD value
CY vs PY (YTD) – CY YTD ÷ PY YTD comparison
Because of conditional formatting icons, users can immediately identify KPIs that need attention.
Click to Purchases Asset Management Companies KPI Dashboard in Power BI
How Does the KPI Trend Page Improve Performance Analysis?
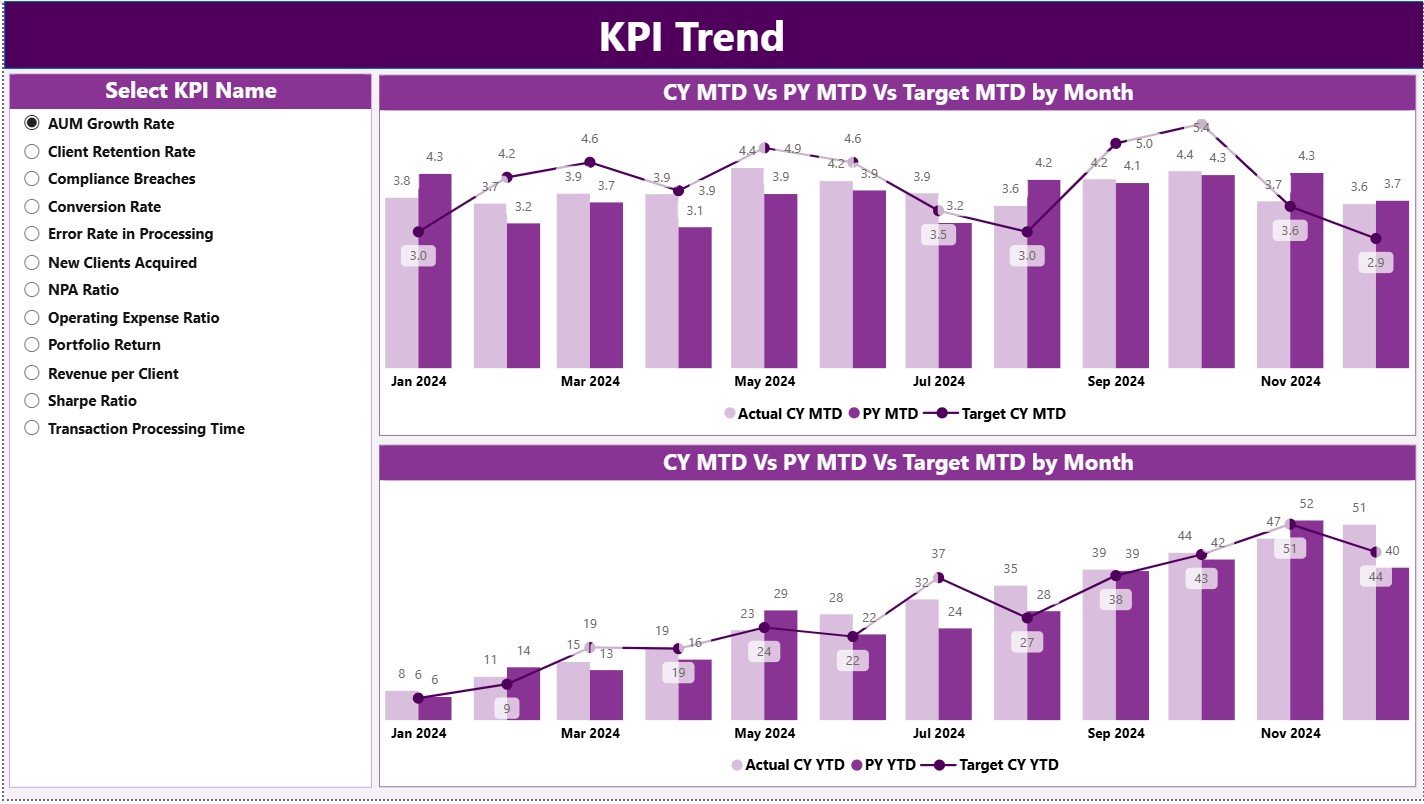
The KPI Trend Page focuses on understanding performance over time instead of just static values.
Key Elements of the KPI Trend Page
KPI Name Slicer on the left side
Two Combo Charts:
MTD Trend Chart (Actual CY, Actual PY, Target)
YTD Trend Chart (Actual CY, Actual PY, Target)
These charts clearly show performance direction, consistency, and improvement areas.
As a result, asset managers can identify trends early and take timely corrective actions.
What Is the Role of the KPI Definition Page?
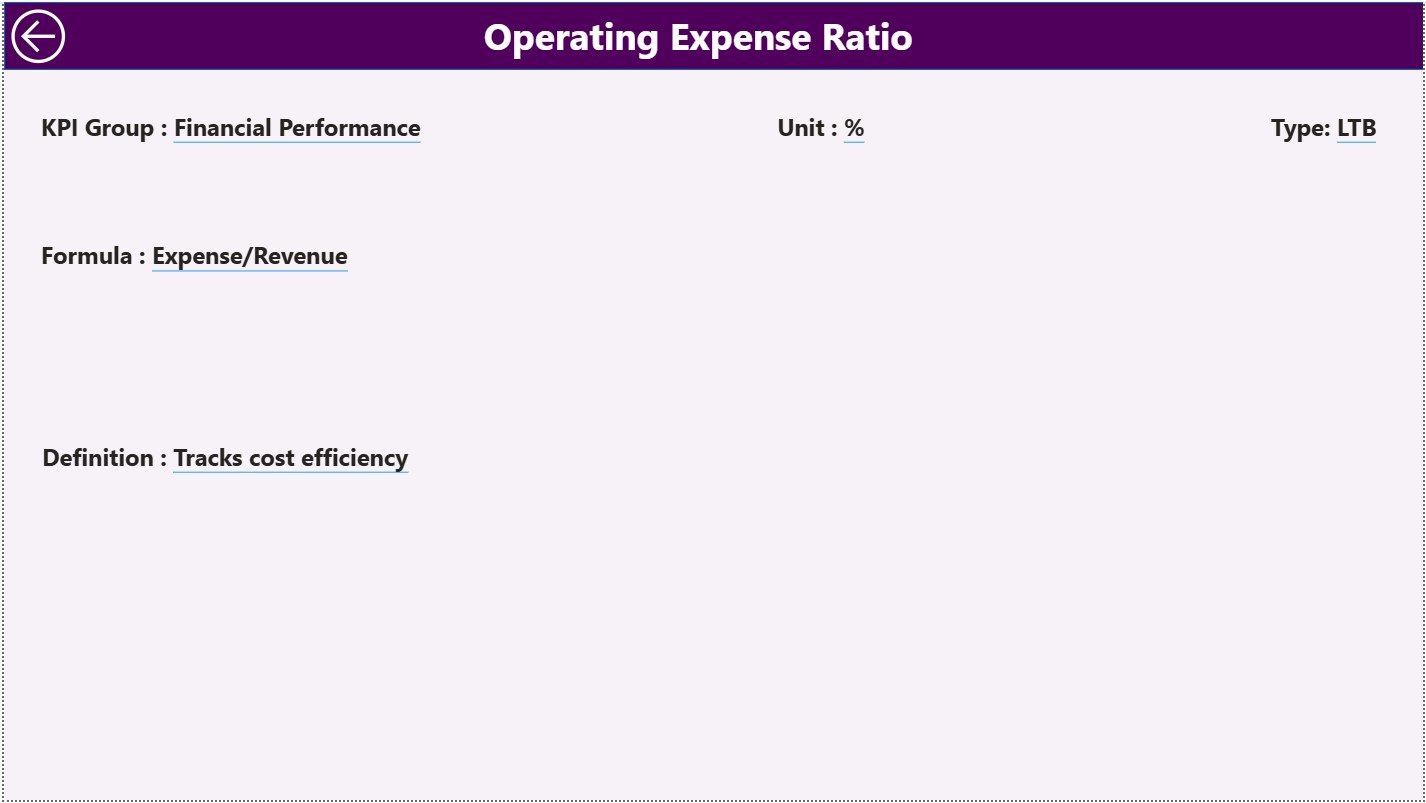
The KPI Definition Page ensures clarity and governance across the organization.
Key Features of the KPI Definition Page
Hidden drill-through page
Accessible from the Summary Page
Displays:
KPI Formula
KPI Definition
KPI Type (UTB or LTB)
This page eliminates confusion and ensures everyone understands KPIs in the same way.
Moreover, users can return to the main page easily using the Back Button available at the top-left corner.
How Is Excel Used as the Data Source?
The dashboard uses a structured Excel data model with three worksheets. This approach keeps data entry simple and controlled.
What Is the Purpose of the Input_Actual Sheet?
The Input_Actual sheet captures actual performance values.
Data to Be Entered
KPI Name
Month (use the first date of the month)
MTD Actual Value
YTD Actual Value
This sheet reflects real operational performance.
What Is the Purpose of the Input_Target Sheet?
The Input_Target sheet stores planned or expected KPI values.
Data to Be Entered
KPI Name
Month (use the first date of the month)
MTD Target Value
YTD Target Value
This structure enables accurate target comparisons.
What Information Is Stored in the KPI Definition Sheet?
The KPI Definition sheet acts as the master reference.
Columns Included
KPI Number
KPI Group
KPI Name
Unit
Formula
Definition
Type (LTB or UTB)
This sheet ensures consistency and governance.
Advantages of Asset Management Companies KPI Dashboard in Power BI
An Asset Management Companies KPI Dashboard in Power BI offers multiple strategic benefits.
Key Advantages
✅ Centralized KPI monitoring
✅ Clear MTD and YTD performance tracking
✅ Target vs actual comparison with visual indicators
✅ Previous year performance analysis
✅ Interactive slicers for flexible reporting
✅ Excel-based data entry for ease of use
✅ Improved transparency and accountability
✅ Faster and better decision-making
Because of these advantages, organizations move from reactive reporting to proactive performance management.
How Does This Dashboard Support Better Decision-Making?
This dashboard transforms raw data into actionable insights.
For example:
Leadership can identify underperforming KPIs instantly
Portfolio managers can monitor trends effectively
Compliance teams can track consistency
Strategy teams can evaluate long-term performance
As a result, decisions become faster, more accurate, and data-driven.
Best Practices for the Asset Management Companies KPI Dashboard in Power BI
To maximize dashboard value, organizations should follow best practices.
Best Practices You Should Follow
🔹 Define KPIs clearly before implementation
🔹 Maintain consistent KPI definitions
🔹 Update Excel data on a fixed schedule
🔹 Validate data before refreshing Power BI
🔹 Use UTB and LTB correctly
🔹 Limit KPIs to meaningful metrics
🔹 Review trends regularly, not occasionally
🔹 Train users on slicers and drill-through
Following these practices ensures reliability and long-term success.
Click to Purchases Asset Management Companies KPI Dashboard in Power BI
Who Can Use the Asset Management KPI Dashboard?
This dashboard suits a wide range of users.
Ideal Users
Asset Management Executives
Portfolio Managers
Performance Analysts
Finance and Operations Teams
Strategy and Planning Teams
Compliance and Reporting Teams
Because of its simplicity, both technical and non-technical users benefit.
Why Is Power BI Better Than Traditional Reporting?
Although Excel remains powerful, Power BI adds advanced capabilities.
Power BI Advantages
Interactive dashboards
Automated calculations
Visual indicators for performance
Drill-through analysis
Cleaner executive-level reporting
Therefore, Power BI enhances reporting quality significantly.
Conclusion
An Asset Management Companies KPI Dashboard in Power BI provides clarity, control, and confidence in performance management. It combines structured Excel data with powerful Power BI visuals to deliver actionable insights.
Moreover, it enables asset management firms to track what matters, improve performance continuously, and align operations with strategic goals. Instead of guessing outcomes, organizations rely on facts, trends, and comparisons.
In today’s data-driven asset management landscape, this dashboard becomes an essential strategic tool.
Click to Purchases Asset Management Companies KPI Dashboard in Power BI
Frequently Asked Questions (FAQs)
What is an Asset Management Companies KPI Dashboard in Power BI?
It is an interactive Power BI dashboard designed to track asset management KPIs using Excel as the data source.
Can non-technical users maintain this dashboard?
Yes, because data entry happens in Excel and Power BI handles visualization automatically.
How often should KPI data be updated?
Organizations should update KPI data monthly for accurate MTD and YTD tracking.
What do UTB and LTB mean?
UTB means Upper the Better, while LTB means Lower the Better.
Does the dashboard compare previous year performance?
Yes, it includes CY vs PY comparisons for both MTD and YTD.
Can KPIs be customized?
Yes, users can modify KPIs, formulas, and definitions in the KPI Definition sheet.
Is Excel mandatory as a data source?
In this model, Excel acts as the primary and easiest data source.
Click to Purchases Asset Management Companies KPI Dashboard in Power BI
Visit our YouTube channel to learn step-by-step video tutorials