The duty-free retail business operates in a fast-paced, highly competitive, and location-driven environment. Sales fluctuate by passenger traffic, seasonality, promotions, and product mix. Therefore, duty-free retailers must track performance continuously to stay profitable and competitive. However, when sales, inventory, and performance data remain scattered across multiple spreadsheets, monitoring KPIs becomes slow and inefficient.
That is exactly where a Duty-Free Retail KPI Dashboard in Excel becomes a practical, powerful, and cost-effective solution.
In this detailed, SEO-friendly article, you will learn what a Duty-Free Retail KPI Dashboard in Excel is, why it is essential, how it works, its worksheet-wise structure, key features, advantages, opportunities for improvement, best practices, and frequently asked questions. Moreover, the content uses simple language, active voice, and clear explanations so that retail managers and business owners can easily understand and use it.
Click to Purchases Duty-Free Retail KPI Dashboard in Excel
What Is a Duty-Free Retail KPI Dashboard in Excel?
A Duty-Free Retail KPI Dashboard in Excel is a ready-to-use analytical template that helps duty-free retailers track, analyze, and monitor key performance indicators from a single Excel file.
Instead of managing separate sheets for sales, targets, and historical data, this dashboard consolidates everything into a structured, interactive, and visual reporting system. As a result, users gain instant visibility into retail performance at both monthly and yearly levels.
Moreover, because this dashboard runs entirely in Excel, it remains easy to maintain, customize, and share without relying on expensive BI tools.
Why Do Duty-Free Retailers Need a KPI Dashboard?
Duty-free retail performance depends on multiple factors such as passenger volume, product category mix, pricing strategies, and promotional campaigns. Therefore, retailers must monitor KPIs regularly to make timely decisions.
Without a KPI dashboard:
-
Sales performance remains unclear
-
Target gaps go unnoticed
-
Year-over-year comparisons take too much time
-
Decision-making becomes reactive
However, with a Duty-Free Retail KPI Dashboard in Excel, retailers can:
-
Track MTD and YTD performance instantly
-
Compare Actual vs Target and Actual vs Previous Year
-
Identify underperforming KPIs early
-
Improve sales planning and inventory decisions
As a result, businesses move from guesswork to data-driven retail management.
How Does a Duty-Free Retail KPI Dashboard in Excel Work?
This dashboard follows a simple and logical structure.
First, users enter Actual, Target, and Previous Year numbers into dedicated input sheets. Then, the dashboard automatically calculates variances, trends, and KPI status using formulas and conditional formatting.
The workflow looks like this:
-
Enter Actual numbers
-
Enter Target numbers
-
Enter Previous Year numbers
-
Define KPIs clearly
-
Select the Month
-
Analyze performance instantly
Because of this design, even non-technical users can operate the dashboard easily.
Click to Purchases Duty-Free Retail KPI Dashboard in Excel
What Worksheets Are Included in the Duty-Free Retail KPI Dashboard in Excel?
This dashboard contains seven structured worksheets, each designed for a specific purpose.
1) Home Sheet – How Do You Navigate the Dashboard Easily?
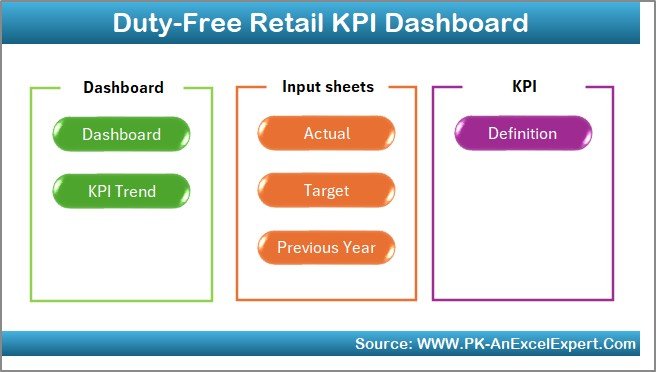
The Home Sheet acts as an index page.
Key Features of the Home Sheet
-
Six navigation buttons
-
One-click access to all major sheets
-
Clean and user-friendly layout
As a result, users can move across the dashboard quickly without searching for sheet tabs.
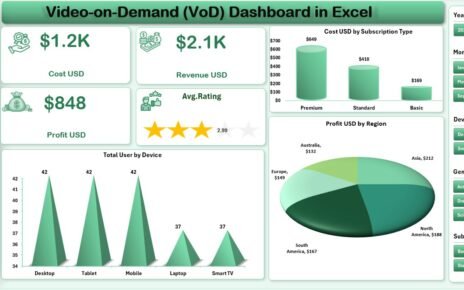
2) Dashboard Sheet – How Do You View Overall KPI Performance?
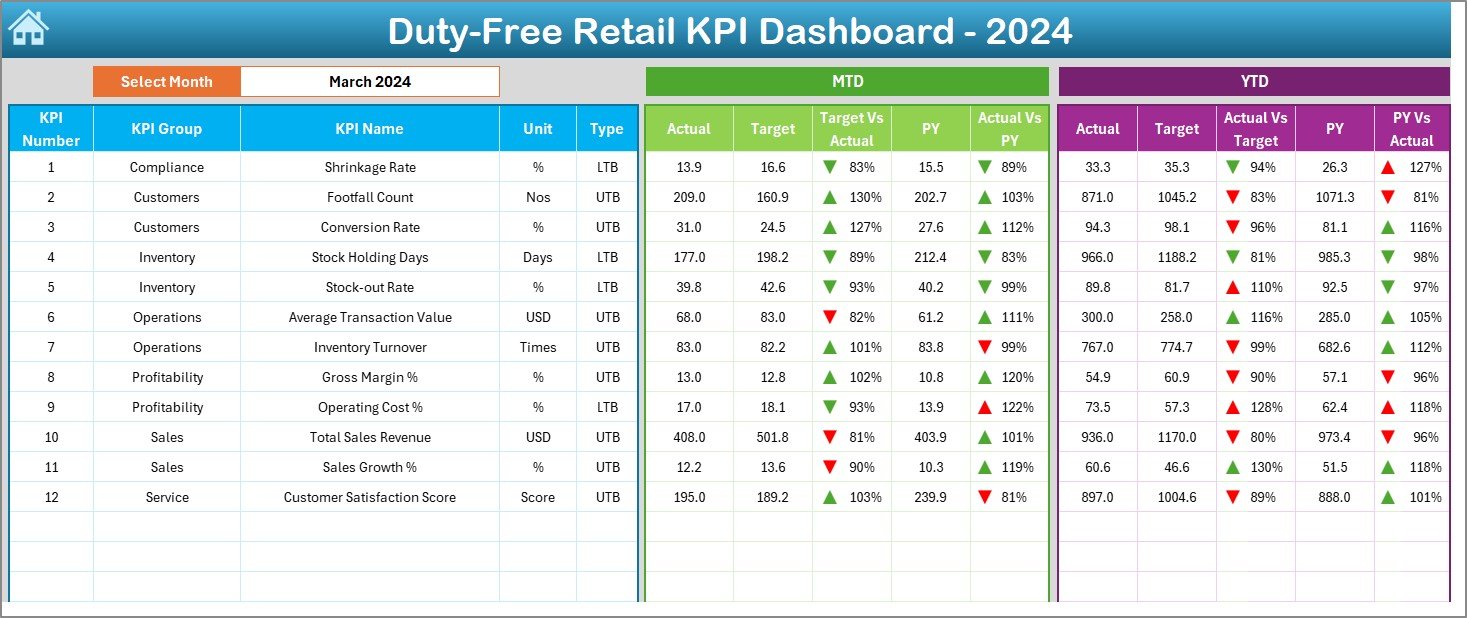
The Dashboard Sheet serves as the main analytical page.
Month Selection
-
A Month drop-down is available in cell D3
-
When users change the month, the entire dashboard updates automatically
KPI Performance Display
On this page, the dashboard shows:
-
MTD Actual
-
MTD Target
-
MTD Previous Year
-
Target vs Actual (MTD)
-
Previous Year vs Actual (MTD)
Similarly, it also displays:
-
YTD Actual
-
YTD Target
-
YTD Previous Year
-
Target vs Actual (YTD)
-
Previous Year vs Actual (YTD)
Conditional Formatting Indicators
The dashboard uses:
-
Green ▲ arrows for favorable performance
-
Red ▼ arrows for unfavorable performance
Because of these visual indicators, users can identify performance issues instantly.
Click to Purchases Duty-Free Retail KPI Dashboard in Excel
3) KPI Trend Sheet – How Do You Analyze KPI Trends?
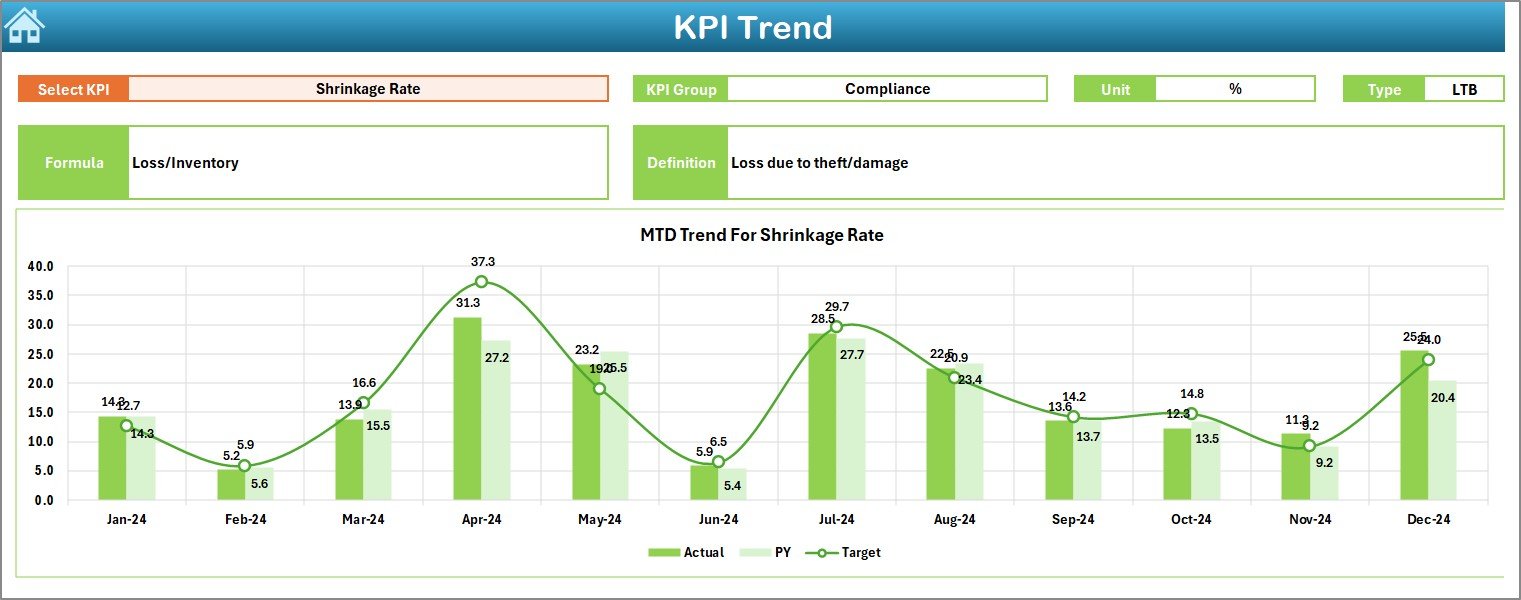
The KPI Trend Sheet focuses on detailed KPI-level analysis.
KPI Selection
-
Users select a KPI from the drop-down in cell C3
-
Once selected, all related details update automatically
KPI Information Displayed
This sheet shows:
-
KPI Group
-
Unit of KPI
-
KPI Type (Lower the Better or Upper the Better)
-
KPI Formula
-
KPI Definition
Trend Charts
The sheet also displays:
-
MTD trend chart for Actual, Target, and Previous Year
-
YTD trend chart for Actual, Target, and Previous Year
As a result, users can analyze performance direction, seasonality, and consistency.
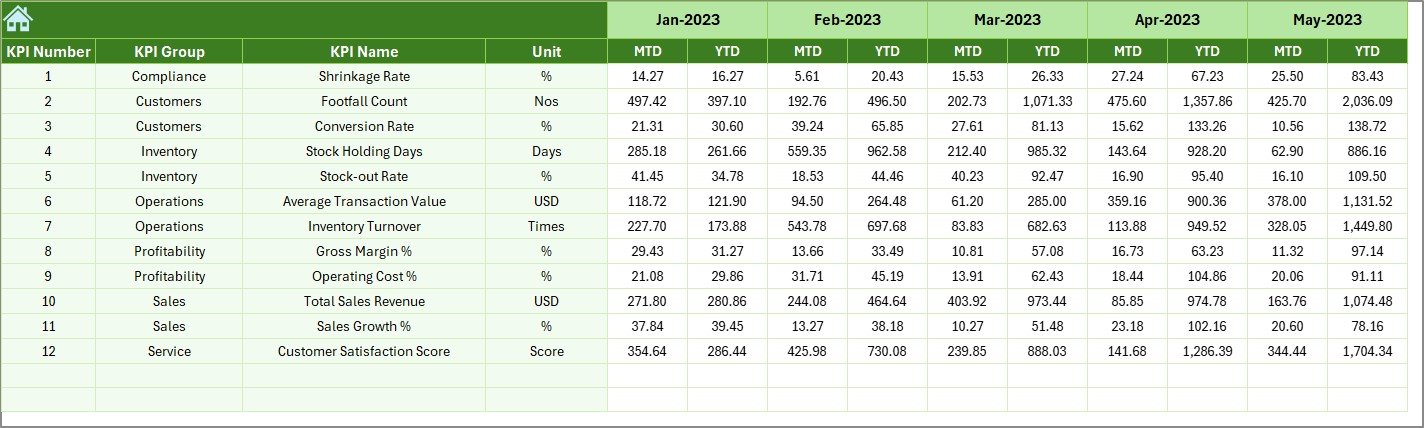
4) Actual Numbers Input Sheet – How Do You Enter Actual Data?
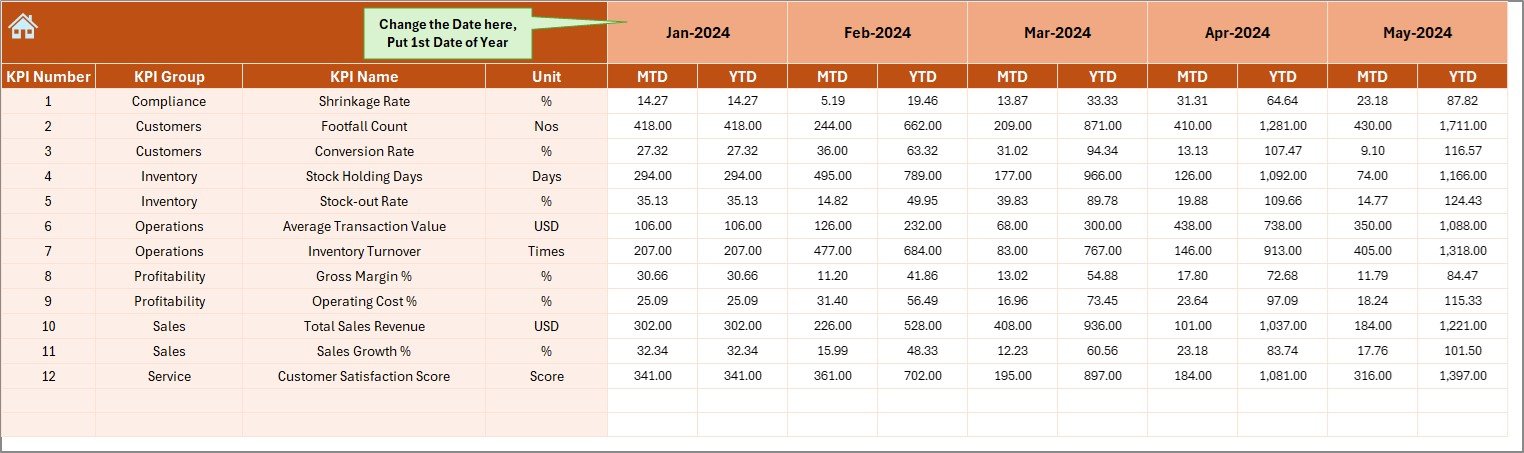
The Actual Numbers Input Sheet captures real performance data.
Key Inputs
-
Enter MTD and YTD actual numbers
-
Select the month using cell E1
-
Use the first month of the year as the base reference
Because of this setup, users can update data quickly without breaking formulas.
Click to Purchases Duty-Free Retail KPI Dashboard in Excel
5) Target Sheet – How Do You Define Sales and Performance Targets?
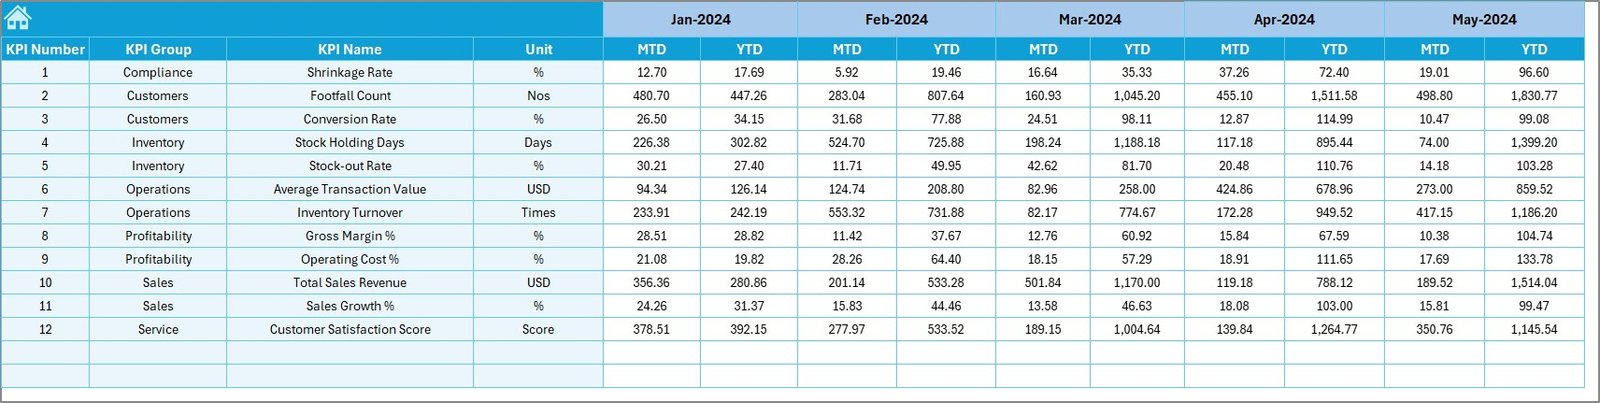
The Target Sheet stores benchmark values.
What You Enter Here
-
KPI-wise Target MTD numbers
-
KPI-wise Target YTD numbers
-
Monthly targets aligned with business goals
This sheet ensures clear expectations for each KPI.
6) Previous Year Number Sheet – How Do You Compare Historical
Performance?
The Previous Year Number Sheet stores historical data.
Purpose of This Sheet
-
Capture previous year MTD and YTD values
-
Enable year-over-year comparisons
-
Identify growth or decline trends
Because of this sheet, performance analysis becomes more meaningful.
Click to Purchases Duty-Free Retail KPI Dashboard in Excel
7) KPI Definition Sheet – How Do You Maintain KPI Clarity?
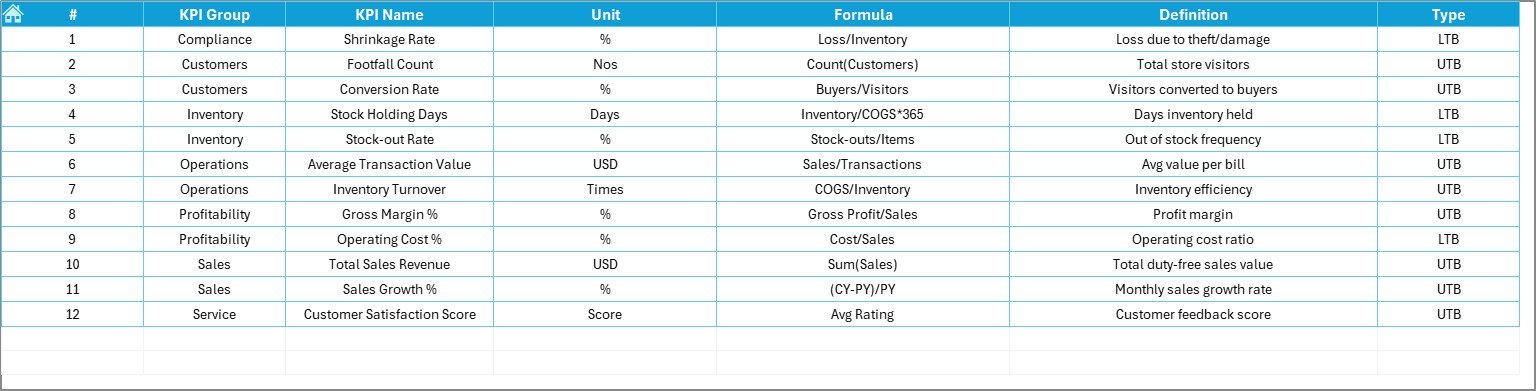
The KPI Definition Sheet acts as the backbone of the dashboard.
Details Captured
-
KPI Name
-
KPI Group
-
Unit of Measurement
-
Formula
-
KPI Definition
This structure ensures everyone understands what each KPI measures and how it is calculated.
What Makes the Duty-Free Retail KPI Dashboard in Excel Effective?
This dashboard works effectively because it combines:
-
Structured KPI definitions
-
MTD and YTD performance tracking
-
Target vs Actual analysis
-
Previous Year comparisons
-
Visual indicators and trend charts
-
Simple Excel-based data entry
As a result, it delivers clarity, speed, and control to duty-free retail operations.
Advantages of Duty-Free Retail KPI Dashboard in Excel
Implementing this dashboard delivers multiple business benefits.
✅ Advantages
-
Centralized retail performance tracking
-
Clear visibility into sales and operational KPIs
-
Faster identification of target gaps
-
Easy comparison with previous year performance
-
Reduced manual reporting effort
-
Improved inventory and sales planning
-
Better coordination between retail and finance teams
-
Cost-effective solution without additional software
Opportunities for Improvement in Duty-Free Retail KPI Dashboard
Although the dashboard provides strong insights, further enhancements can add more value.
🔹 Opportunities for Improvement
-
Add passenger traffic and conversion KPIs
-
Include category-wise and brand-wise analysis
-
Integrate currency-wise sales tracking
-
Add store or location-level comparison
-
Introduce daily sales granularity
-
Add automated alerts for low performance
These improvements can deepen retail intelligence further.
Best Practices for the Duty-Free Retail KPI Dashboard in Excel
Following best practices ensures accuracy and long-term usability.
⭐ Best Practices
-
Define KPIs clearly and consistently
-
Keep Actual, Target, and PY data updated regularly
-
Avoid unnecessary KPIs
-
Validate data before monthly updates
-
Review trends instead of only current values
-
Use consistent units of measurement
-
Train users on dashboard navigation
-
Perform periodic KPI relevance reviews
When teams follow these practices, dashboard effectiveness increases significantly.
Click to Purchases Duty-Free Retail KPI Dashboard in Excel
Who Should Use a Duty-Free Retail KPI Dashboard in Excel?
This dashboard supports multiple stakeholders.
Ideal Users
-
Duty-Free Store Managers
-
Retail Operations Teams
-
Sales and Category Managers
-
Finance and Performance Analysts
-
Airport Retail Management
-
Business Owners
Because of its flexible structure, both single-store and multi-location retailers can use it effectively.
How Does This Dashboard Improve Retail Decision-Making?
This dashboard improves decisions by:
-
Highlighting underperforming KPIs early
-
Showing trends instead of isolated numbers
-
Supporting data-driven promotions and pricing
-
Improving accountability across teams
As a result, duty-free retailers can maximize revenue and operational efficiency.
Conclusion
A Duty-Free Retail KPI Dashboard in Excel transforms complex retail data into clear, actionable insights. By combining structured input sheets with interactive dashboards and trend analysis, this tool enables retailers to track MTD and YTD performance, compare targets with actuals, and analyze year-over-year growth.
Moreover, it reduces manual effort, improves transparency, and supports smarter retail decisions. Whether you manage a single duty-free store or oversee multiple airport locations, this dashboard serves as a reliable performance management solution.
Frequently Asked Questions (FAQs)
1) What is a Duty-Free Retail KPI Dashboard in Excel?
It is an Excel-based dashboard that tracks and analyzes duty-free retail KPIs in a structured and visual format.
2) Do I need advanced Excel skills to use this dashboard?
No. You only need basic Excel knowledge to update data and use drop-downs.
3) Can I track both MTD and YTD performance?
Yes. The dashboard fully supports MTD and YTD analysis.
4) Can I compare current performance with the previous year?
Yes. The dashboard includes Previous Year comparison for all KPIs.
5) Can I customize KPIs and formulas?
Absolutely. You can update KPI definitions and formulas in the KPI Definition sheet.
6) Is this dashboard suitable for multiple duty-free stores?
Yes. You can extend it to store-wise analysis with additional columns.
7) Can I use this dashboard for presentations?
Yes. The visual layout makes it ideal for management reviews and presentations.
Click to Purchases Duty-Free Retail KPI Dashboard in Excel
Visit our YouTube channel to learn step-by-step video tutorials