Managing office events is no longer just about scheduling meetings or sending calendar invites. Today, organizations need clear visibility into attendance, participation modes, engagement levels, and feedback to make every event successful. That is exactly why an Office Event Attendance Dashboard in Excel becomes a powerful and practical solution.
In this detailed, SEO-friendly article, you will learn what an Office Event Attendance Dashboard in Excel is, why it matters, how it works, its sheet-wise structure, advantages, best practices, and frequently asked questions. Moreover, the language remains simple, clear, and easy to understand so that HR teams, admin teams, managers, and analysts can use it without technical complexity.
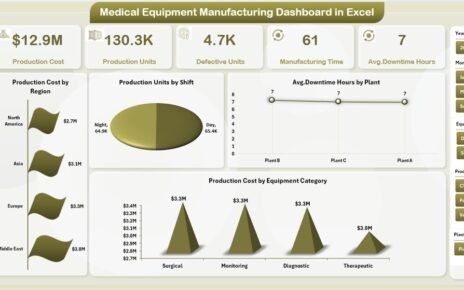
Click to buy Office Event Attendance Dashboard in Excel
What Is an Office Event Attendance Dashboard in Excel?
An Office Event Attendance Dashboard in Excel is a ready-to-use analytical tool designed to track, monitor, and analyze employee attendance across office events in a centralized Excel file.
Instead of checking multiple sheets, emails, or event tools, this dashboard converts raw attendance data into visual insights. As a result, decision-makers instantly understand how many employees attended events in person, joined virtually, remained absent, or actively participated.
Because it is built in Excel, this dashboard stays:
- Affordable
- Flexible
- Easy to customize
- Familiar for most users
Therefore, organizations of all sizes can use it without investing in expensive event management software.
Why Do Organizations Need an Office Event Attendance Dashboard?
Office events play a critical role in employee engagement, collaboration, and culture building. However, without structured tracking, organizations often face visibility gaps.
Here is why this dashboard becomes essential:
- Teams struggle to measure actual attendance vs planned attendance
- HR lacks clarity on in-person vs virtual participation
- Managers cannot track department-wise engagement
- Feedback and participation trends remain hidden
- Leadership lacks data for future event planning
An Office Event Attendance Dashboard in Excel solves all these challenges by providing real-time insights in one place.
How Does an Office Event Attendance Dashboard in Excel Work?
This dashboard works by combining structured attendance data with Excel-based analytics. First, you enter or import attendance data. Then, Excel processes the data using formulas, pivot tables, and charts. Finally, the dashboard displays insights visually across multiple analytical sheets.
As a result, users can:
- Filter data by department, event type, location, or month
- Compare in-person and virtual attendance
- Identify low-engagement events
- Track attendance trends over time
Sheet-Wise Structure of the Office Event Attendance Dashboard in Excel
This dashboard includes multiple analytical sheet tabs. Each tab focuses on a specific attendance perspective, which makes analysis structured and meaningful.
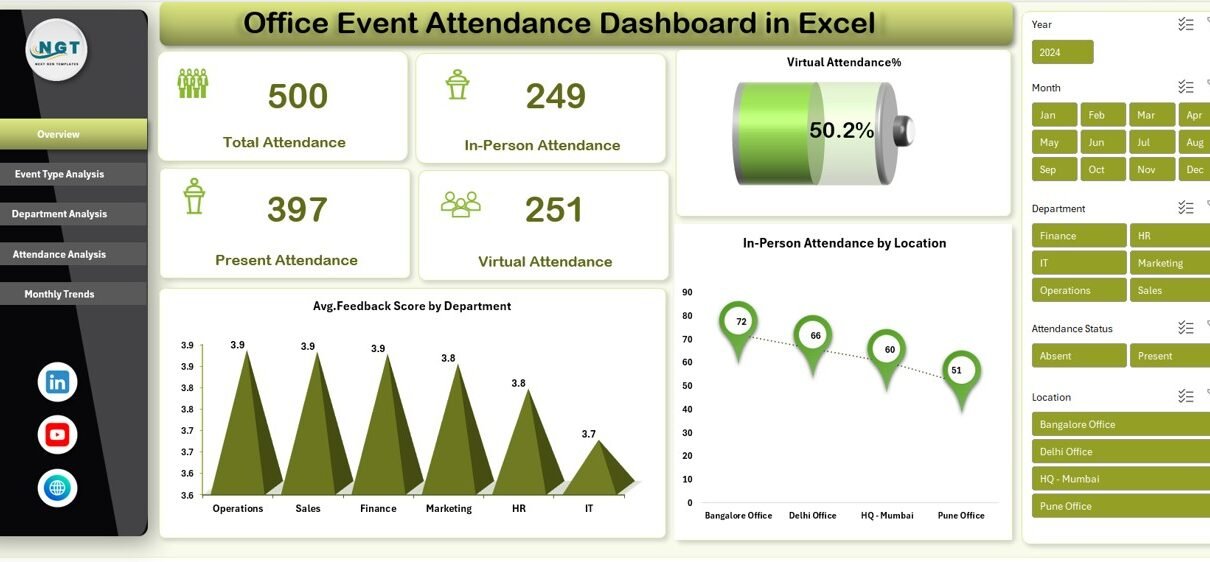
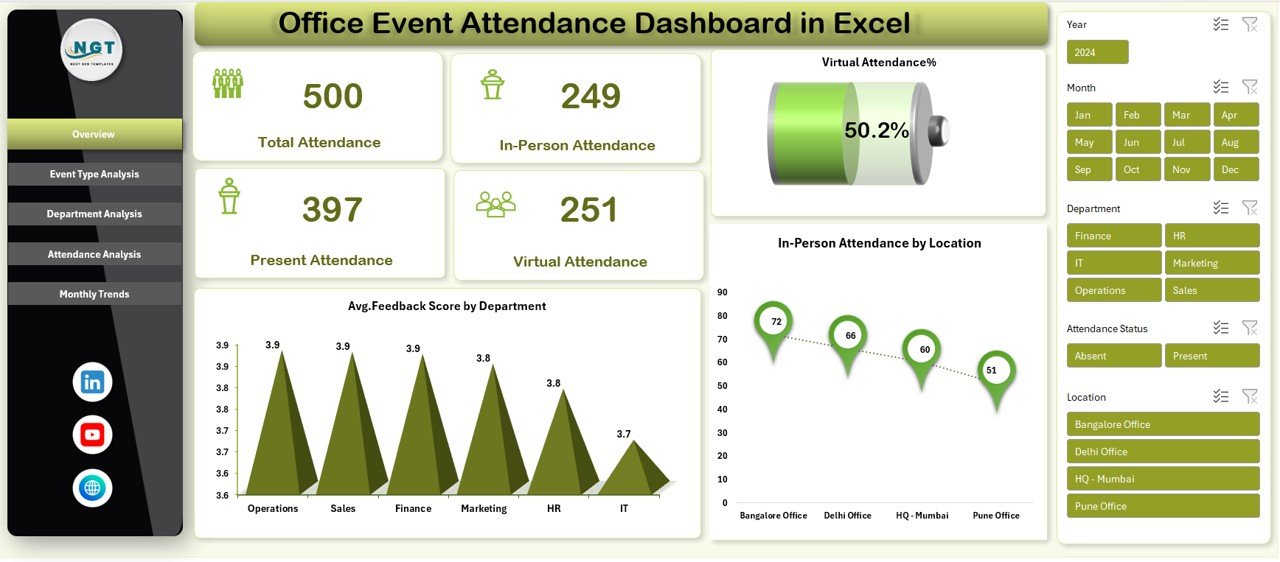
Overview Sheet Tab: What Key Attendance Metrics Can You See at a Glance?
The Overview sheet works as the main summary page of the dashboard. It provides a high-level snapshot of event attendance performance.
Key Metrics Available on the Overview Sheet
- Total Attendance
- Shows total participants across all office events
- In-Person Attendance
- Displays employees who attended events physically
- Present Attendance
- Highlights overall presence regardless of mode
- Virtual Attendance
- Tracks employees who joined events online
- Virtual Attendance %
- Calculates the percentage of virtual participants
- Average Feedback Score by Department
- Measures employee satisfaction across departments
- In-Person Attendance by Location
- Shows which office locations attract higher attendance
Because everything appears on one screen, stakeholders quickly understand overall performance without deep analysis.
Click to buy Office Event Attendance Dashboard in Excel
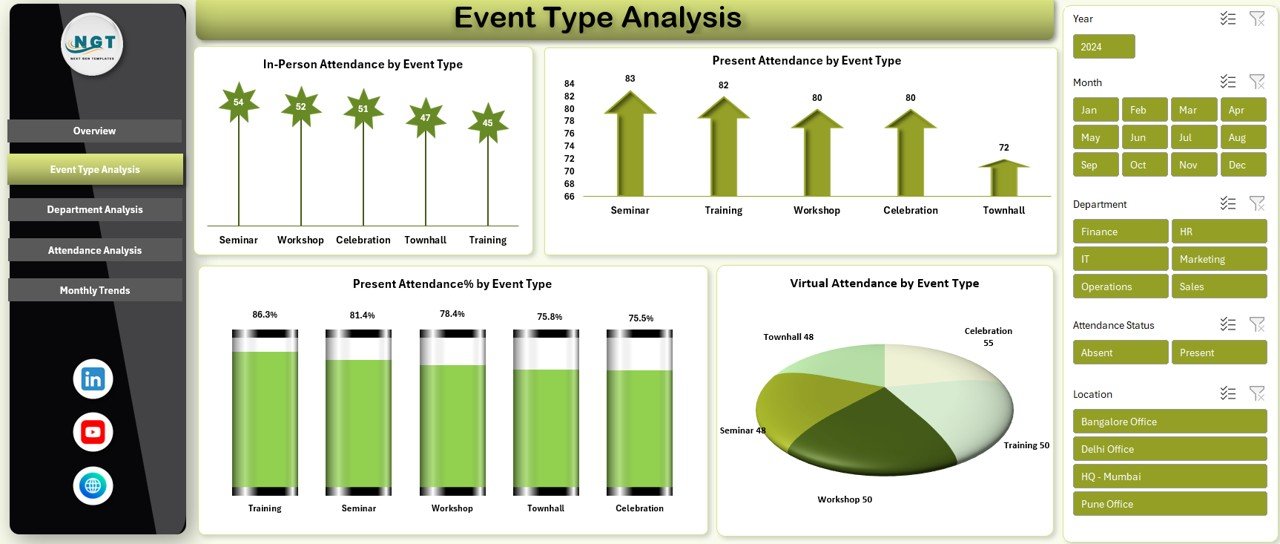
Event Type Analysis Sheet: How Does Attendance Vary by Event Type?
The Event Type Analysis sheet helps organizations compare attendance patterns across different event categories such as training sessions, town halls, workshops, celebrations, or meetings.
Insights Available in Event Type Analysis
- In-Person Attendance by Event Type
- Identifies which events attract physical participation
- Present Attendance % by Event Type
- Highlights engagement strength across event formats
- Virtual Attendance by Event Type
- Shows preference for remote participation
- Present Attendance by Event Type
- Compares total presence across event categories
This sheet helps teams decide which event formats work best for employees.
Click to buy Office Event Attendance Dashboard in Excel
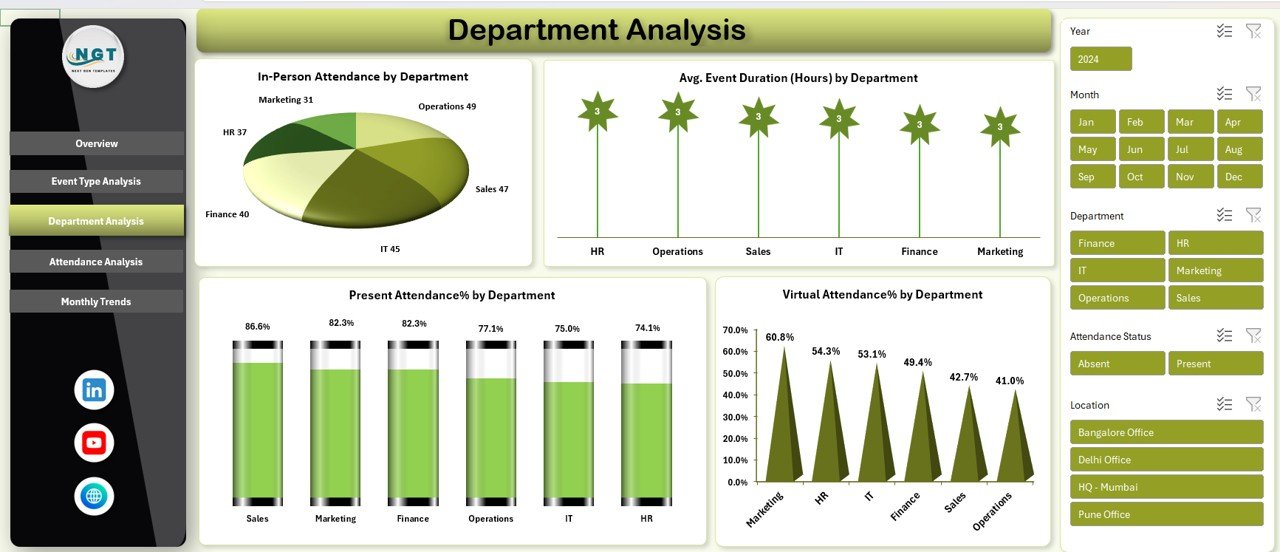
Department Analysis Sheet: Which Teams Engage More in Office Events?
The Department Analysis sheet focuses on participation behavior across different departments.
Key Department-Wise Insights
- In-Person Attendance by Department
- Shows departments with strong on-site participation
- Present Attendance % by Department
- Highlights overall engagement levels
- Virtual Attendance % by Department
- Indicates departments preferring remote participation
- Average Event Duration (Hours) by Department
- Helps understand time investment patterns
- With these insights, HR teams can identify disengaged departments and take corrective actions.
Click to buy Office Event Attendance Dashboard in Excel
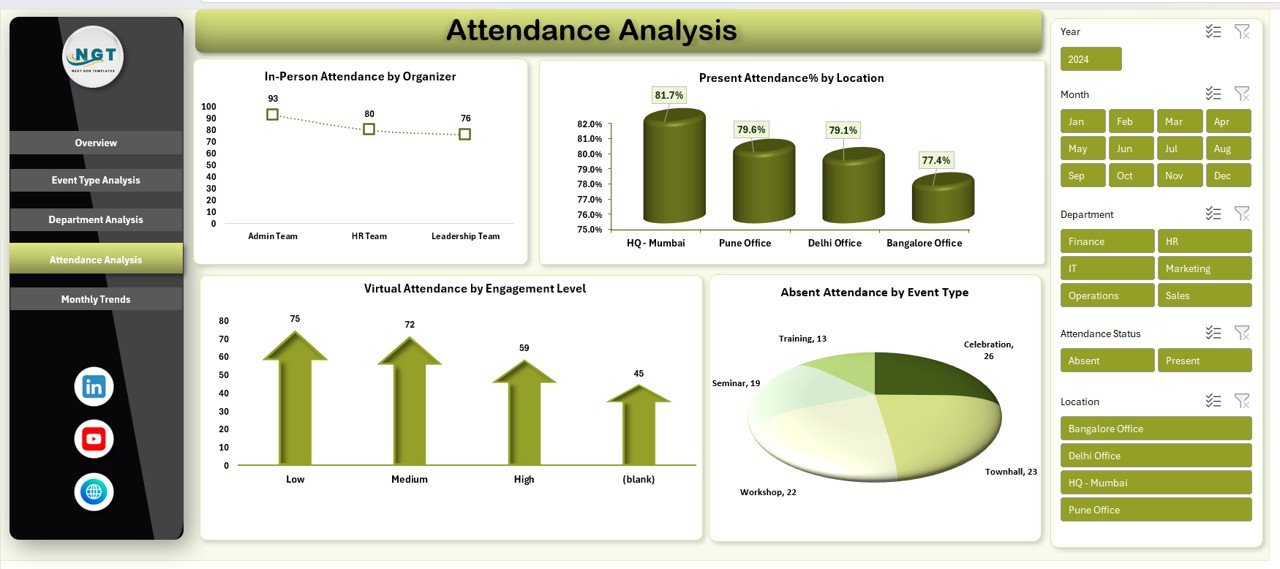
Attendance Analysis Sheet: What Deep Attendance Patterns Can You Discover?
The Attendance Analysis sheet provides a deeper behavioral view of participation.
Key Analytical Views Included
In-Person Attendance by Organizer
Shows which organizers attract higher attendance
Virtual Attendance by Engagement Level
Identifies active vs passive participation
Absent Attendance by Event Type
Highlights events with high absenteeism
Present Attendance % by Location
Compares engagement across office branches
This sheet helps improve future event planning and organizer effectiveness.
Click to buy Office Event Attendance Dashboard in Excel
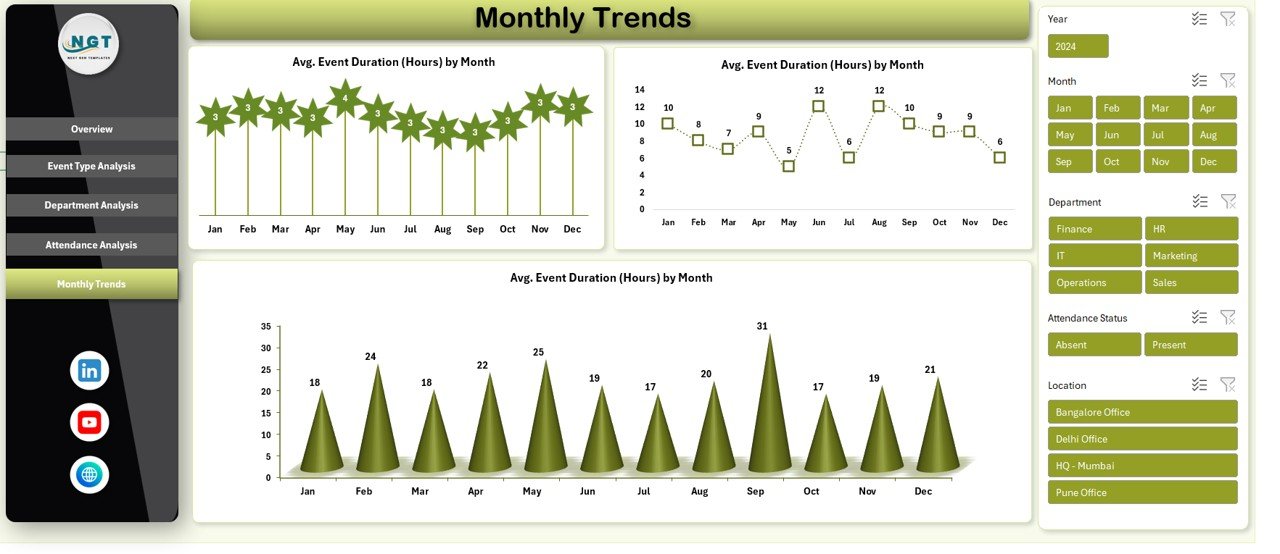
Monthly Trends Sheet: How Does Event Participation Change Over Time?
The Monthly Trends sheet focuses on time-based analysis.
Key Monthly Metrics
- Average Event Duration (Hours) by Month
- Tracks how long events last across months
- Participation Pattern Over Time
- Identifies seasonal or monthly trends
Because trends reveal long-term behavior, leadership can plan events more strategically.
What Types of Data Are Used in This Dashboard?
The dashboard typically uses structured data such as:
- Event Date
- Event Name
- Event Type
- Organizer
- Department
- Location
- Attendance Mode (In-Person / Virtual)
- Presence Status (Present / Absent)
- Engagement Level
- Event Duration (Hours)
- Feedback Score
Since Excel supports proper data types, calculations remain accurate and reliable.
Advantages of Office Event Attendance Dashboard in Excel
Using this dashboard provides multiple operational and strategic benefits.
Key Advantages
- Centralized Attendance Tracking
- Manage all event attendance data in one place
- Time-Saving Analysis
- Reduce manual reporting and calculations
- Better Employee Engagement Insights
- Understand participation behavior clearly
- Location-Wise Visibility
- Compare attendance across offices
- Department-Wise Accountability
- Identify engaged and disengaged teams
- No Additional Software Required
- Works fully inside Excel
- Easy CustomizationModify metrics, charts, and layouts easily
- Improved Event Planning
- Use data to design better future events
- Who Can Use an Office Event Attendance Dashboard in Excel?
This dashboard fits multiple roles and industries.
Ideal Users
- HR Teams
- Admin Teams
- Office Managers
- Employee Engagement Teams
- Corporate Event Planners
- Department Heads
- Business Analysts
Because Excel remains widely used, adoption stays quick and simple.
Best Practices for the Office Event Attendance Dashboard in Excel
To get maximum value, organizations should follow these best practices.
- Maintain Clean and Consistent Data
- Use standardized event names and departments
- Avoid duplicate records
- Use Proper Attendance Categories
- Clearly define In-Person, Virtual, and Absent statuses
- Update Data Regularly
- Refresh attendance data after every event
- Validate Feedback Scores
- Ensure feedback entries stay within defined limits
- Review Dashboards Monthly
- Track engagement changes over time
- Share Insights with Stakeholders
- Use dashboard outputs during review meetings
- Customize Metrics as Needed
- Add KPIs relevant to your organization
Following these practices ensures accurate insights and better decisions.
How Does This Dashboard Improve Employee Engagement?
When organizations track attendance data effectively, they gain clarity on what employees value. As a result, they can:
- Design events employees want to attend
- Improve event timing and format
- Increase participation rates
- Enhance overall workplace culture
Therefore, this dashboard directly supports engagement initiatives.
Why Choose Excel for an Office Event Attendance Dashboard?
Excel remains one of the most trusted tools for business analysis. It offers:
- Familiar interface
- Powerful formulas
- Pivot tables and charts
- Easy sharing
- Offline access
Hence, Excel makes this dashboard practical and cost-effective.
Conclusion
An Office Event Attendance Dashboard in Excel transforms scattered attendance records into meaningful insights. Instead of guessing participation levels, organizations gain clear, data-driven visibility into employee engagement, attendance modes, and event effectiveness.
With multiple analytical sheets such as Overview, Event Type Analysis, Department Analysis, Attendance Analysis, and Monthly Trends, this dashboard supports smarter decision-making. Moreover, because it runs entirely in Excel, it stays accessible, flexible, and easy to use.
For organizations that want better event planning, stronger engagement, and improved attendance tracking, this dashboard becomes an essential operational tool.
Frequently Asked Questions (FAQs)
- What is an Office Event Attendance Dashboard in Excel used for?
It helps track, analyze, and visualize employee attendance across office events using Excel-based dashboards.
- Can I track both in-person and virtual attendance?
Yes, the dashboard clearly separates in-person and virtual participation metrics.
- Is this dashboard suitable for small organizations?
Yes, both small and large organizations can use it effectively.
- Do I need advanced Excel skills to use this dashboard?
No, basic Excel knowledge is enough to operate and understand the dashboard.
- Can I customize the dashboard metrics?
Yes, you can easily modify charts, KPIs, and layouts as per your needs.
- How often should attendance data be updated?
Ideally, update the data after every office event.
- Can this dashboard support decision-making?
Yes, it provides actionable insights that help improve event planning and employee engagement.
Visit our YouTube channel to learn step-by-step video tutorials
Watch the step-by-step video tutorial:
Click to buy Office Event Attendance Dashboard in Excel