Running a department store today involves much more than stocking products and managing sales counters. Store managers must track sales growth, customer behavior, operational efficiency, inventory performance, and staff productivity regularly. However, when teams rely on manual reports or scattered Excel files, they lose clarity and speed.
That is exactly why a Department Stores KPI Dashboard in Power BI becomes an essential business tool.
This detailed article explains what a Department Stores KPI Dashboard in Power BI is, why it matters, how it works, its page-wise structure, Excel data setup, advantages, best practices, and frequently asked questions. Moreover, the language remains clear, simple, and practical so retail teams can apply it easily.
Click to Purchases Department Stores KPI Dashboard in Power BI
What Is a Department Stores KPI Dashboard in Power BI?
A Department Stores KPI Dashboard in Power BI is an interactive analytics solution designed to monitor, analyze, and compare key performance indicators of department store operations from one centralized dashboard.
Instead of reading static reports or manually checking spreadsheets, store managers can view real-time visuals that highlight performance trends, target achievement, and problem areas instantly.
This dashboard uses:
-
Power BI Desktop for visualization
-
Excel as the data source
As a result, data entry remains easy while analytics stay powerful.
Why Do Department Stores Need a KPI Dashboard?
Department stores manage multiple departments, categories, and performance drivers. Therefore, tracking everything manually becomes inefficient.
A Department Stores KPI Dashboard in Power BI helps because it:
-
Centralizes KPI tracking
-
Shows MTD and YTD performance clearly
-
Highlights target gaps instantly
-
Compares current year vs previous year
-
Improves data-driven decision-making
Because of these benefits, leadership teams gain faster insights and better control.
How Does the Department Stores KPI Dashboard in Power BI Work?
This dashboard follows a simple and scalable workflow:
-
Users enter actual and target data in Excel
-
Power BI connects to the Excel file
-
Visuals update automatically on refresh
Because of this structure, even non-technical users can maintain the dashboard with ease.
Click to Purchases Department Stores KPI Dashboard in Power BI
What Are the Key Pages in the Department Stores KPI Dashboard in Power BI?
The dashboard includes three structured pages, each designed for a specific purpose.
What Does the Summary Page Show?
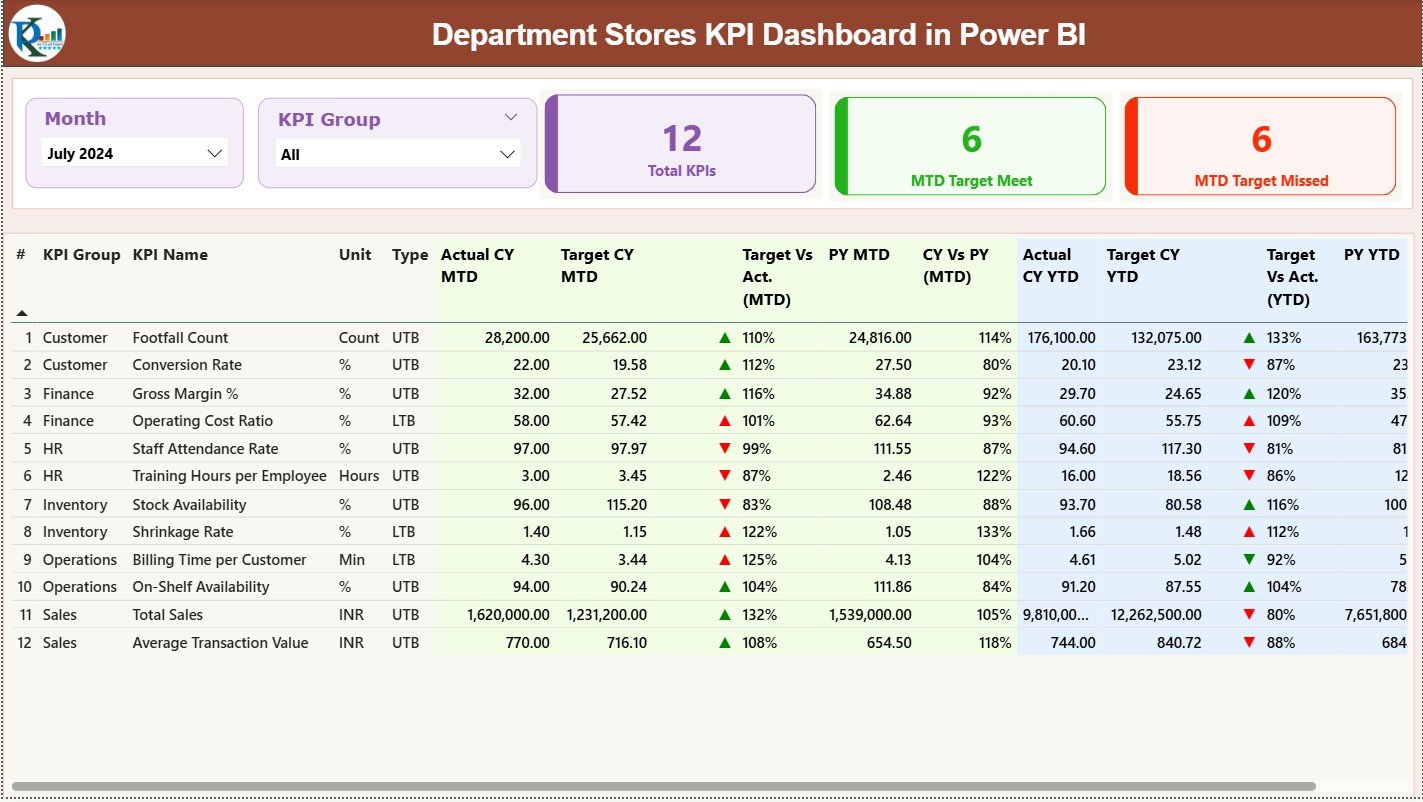
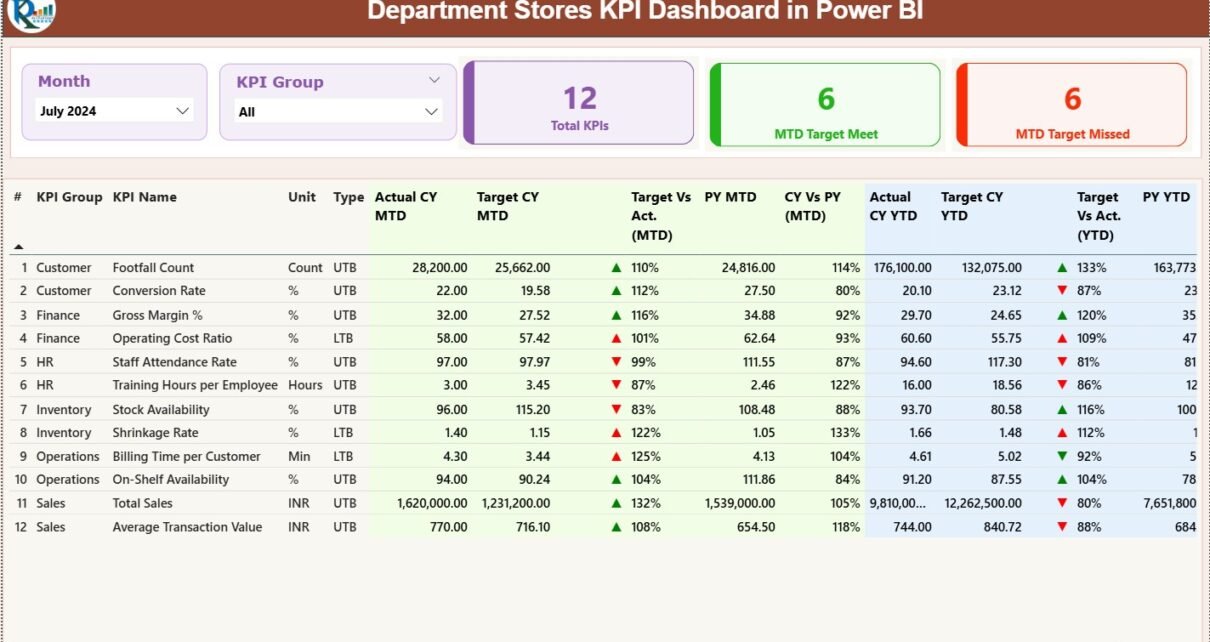
The Summary Page acts as the main performance overview for department store management.
What Filters Are Available on the Summary Page?
At the top of the page, users can find:
-
Month Slicer – Analyze KPIs for a selected month
-
KPI Group Slicer – Filter KPIs by category or department
These slicers allow quick and focused analysis.
What KPI Cards Are Displayed on the Summary Page?
The Summary Page includes three high-level KPI cards:
-
Total KPIs Count
-
MTD Target Met Count
-
MTD Target Missed Count
These cards provide an instant performance snapshot. As a result, managers know where action is needed immediately.
What Information Does the Detailed KPI Table Provide?
Below the KPI cards, the dashboard displays a detailed KPI performance table with comprehensive metrics.
KPI Number
Displays the unique sequence number of each KPI.
KPI Group
Shows the category or department to which the KPI belongs.
KPI Name
Represents the name of the KPI.
Unit
Defines the unit of measurement such as %, value, count, or ratio.
Type (LTB or UTB)
-
LTB (Lower the Better) for cost, complaints, or shrinkage
-
UTB (Upper the Better) for sales, conversion, or footfall
What MTD Performance Metrics Are Included?
The dashboard shows Month-to-Date performance using:
-
Actual CY MTD
-
Target CY MTD
-
MTD Status Icon (▲ / ▼)
-
Target vs Actual (MTD %)
-
Previous Year MTD
-
CY vs PY (MTD %)
Icons and colors make performance interpretation quick and intuitive.
What YTD Performance Metrics Are Included?
Similarly, Year-to-Date performance includes:
-
Actual CY YTD
-
Target CY YTD
-
YTD Status Icon (▲ / ▼)
-
Target vs Actual (YTD %)
-
Previous Year YTD
-
CY vs PY (YTD %)
As a result, users can evaluate both short-term execution and long-term growth.
Click to Purchases Department Stores KPI Dashboard in Power BI
What Is the KPI Trend Page Used For?
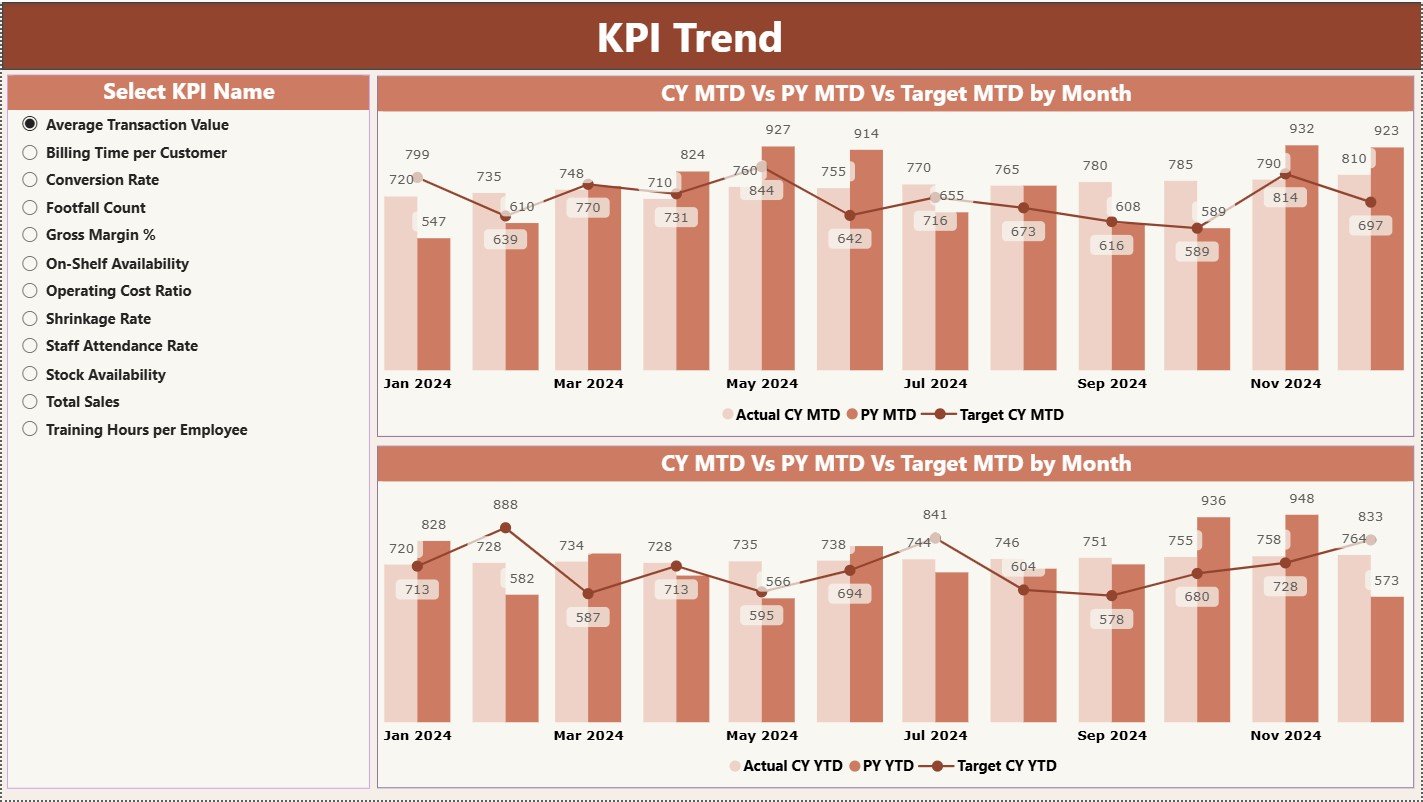
The KPI Trend Page focuses on visual trend analysis.
What Visuals Are Available on the KPI Trend Page?
This page includes:
-
Two combo charts
-
Comparison of:
-
Actual CY
-
Actual PY
-
Target values
-
-
Separate charts for MTD trends and YTD trends
-
A KPI Name slicer on the left side
Because of this layout, users can analyze one KPI at a time with clarity.
Why Is Trend Analysis Important for Department Stores?
Trend analysis helps managers:
-
Identify seasonal patterns
-
Detect declining KPIs early
-
Understand long-term growth
-
Improve forecasting accuracy
Therefore, this page supports proactive decision-making.
What Is the KPI Definition Page?
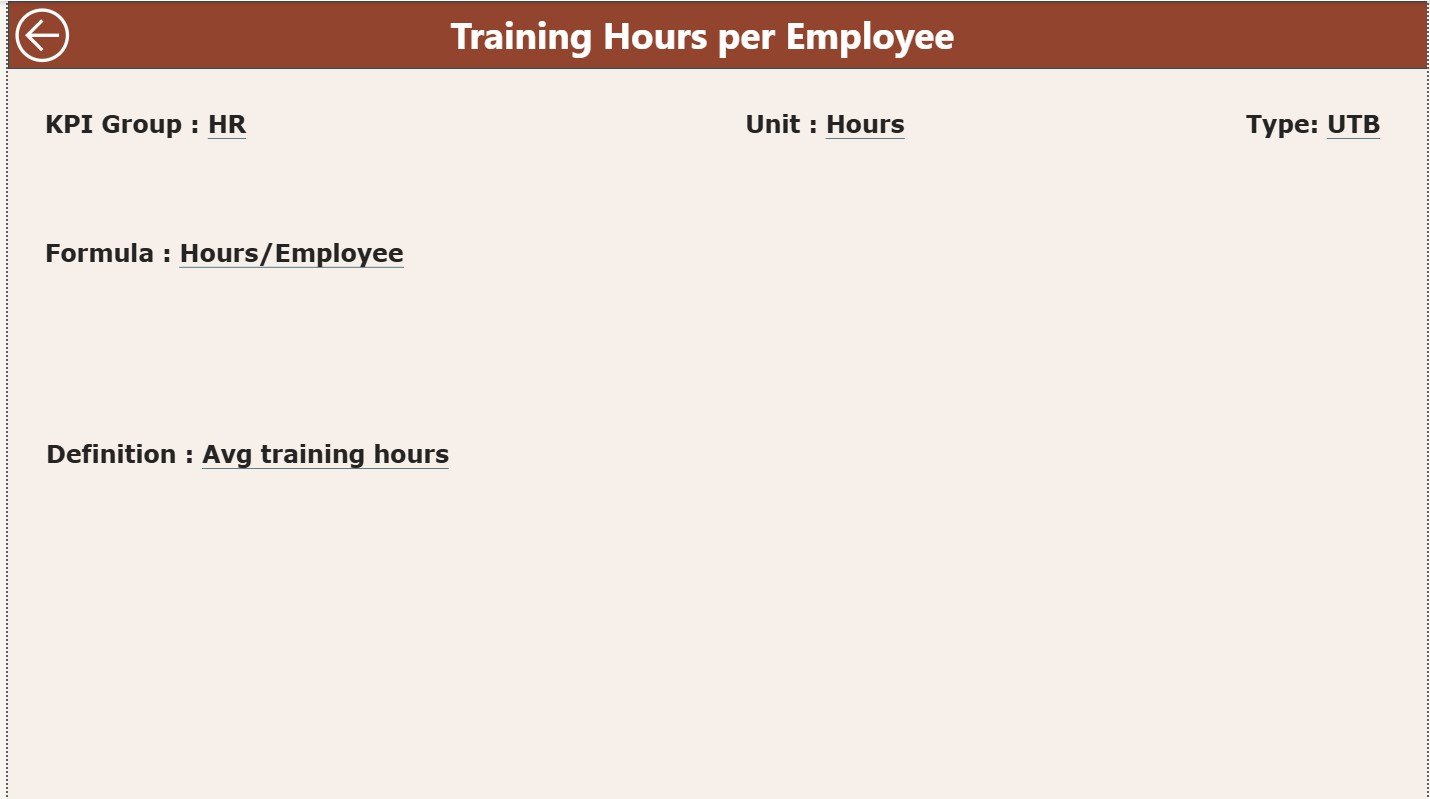
The KPI Definition Page serves as a drill-through reference page.
What Information Does the KPI Definition Page Show?
When users drill through from the Summary Page, they can see:
-
KPI Formula
-
KPI Definition
-
KPI Unit
-
KPI Type (LTB or UTB)
This page improves transparency and avoids KPI misinterpretation.
A Back button on the top-left corner allows easy navigation back to the Summary Page.
How Is Excel Used as the Data Source?
The dashboard uses Excel as its backend, which makes data entry simple and flexible.
The Excel file contains three structured worksheets.
What Is the Input_Actual Sheet?
The Input_Actual sheet captures actual KPI performance.
Users must enter:
-
KPI Name
-
Month (first date of the month)
-
MTD Actual value
-
YTD Actual value
Once updated, Power BI refreshes visuals instantly.
What Is the Input_Target Sheet?
The Input_Target sheet stores KPI targets.
Users must enter:
-
KPI Name
-
Month (first date of the month)
-
MTD Target value
-
YTD Target value
This structure ensures accurate performance comparison.
What Is the KPI Definition Sheet?
The KPI Definition sheet stores master KPI details such as:
-
KPI Number
-
KPI Group
-
KPI Name
-
Unit
-
Formula
-
Definition
-
KPI Type (LTB or UTB)
Because of this structure, the dashboard remains scalable and well-documented.
Advantages of Department Stores KPI Dashboard in Power BI
Using a Department Stores KPI Dashboard in Power BI offers several advantages.
Centralized KPI Monitoring
All KPIs remain available in one dashboard.
Faster Decision-Making
Real-time visuals eliminate reporting delays.
Clear Target Tracking
MTD and YTD comparisons highlight gaps clearly.
Historical Performance Analysis
CY vs PY comparisons reveal growth patterns.
User-Friendly Design
Even non-technical users can operate it easily.
Scalable Architecture
Users can add new KPIs anytime.
Click to Purchases Department Stores KPI Dashboard in Power BI
Best Practices for the Department Stores KPI Dashboard in Power BI
Follow these best practices to maximize dashboard value.
Define KPIs Clearly
Always maintain clear KPI definitions.
Update Excel Data Regularly
Frequent updates ensure accurate insights.
Maintain Consistent Units
Use standardized units across KPIs.
Review Trends Monthly
Monthly reviews help detect issues early.
Train Store Managers
Proper training improves KPI interpretation.
Who Should Use This Dashboard?
This dashboard benefits:
-
Department Store Managers
-
Retail Operations Teams
-
Finance Teams
-
Sales Analysts
-
Business Intelligence Teams
-
Retail Leadership
Because of its flexibility, both small and large department stores can use it effectively.
How Does This Dashboard Improve Retail Performance?
This dashboard converts raw data into actionable insights. As a result:
-
Managers detect issues faster
-
Teams align better with targets
-
Leadership trusts the data
-
Operational efficiency improves
Over time, data-driven decisions lead to higher sales and better customer satisfaction.
Conclusion: Why Choose a Department Stores KPI Dashboard in Power BI?
A Department Stores KPI Dashboard in Power BI provides a clear, structured, and powerful way to track retail performance. It combines Excel’s simplicity with Power BI’s visualization strength. Moreover, it enables accurate MTD and YTD analysis, target tracking, and historical comparison.
For department stores aiming to improve efficiency, accountability, and profitability, this dashboard becomes a must-have solution.
Click to Purchases Department Stores KPI Dashboard in Power BI
Frequently Asked Questions (FAQs)
What is a Department Stores KPI Dashboard in Power BI?
It is a Power BI dashboard that tracks department store KPIs using Excel data.
Can non-technical users maintain this dashboard?
Yes. Users only need to update Excel sheets.
Does the dashboard support KPI grouping?
Yes. KPIs can be grouped and filtered easily.
Can I add new KPIs later?
Yes. The dashboard supports easy expansion.
Does it support year-over-year comparison?
Yes. It compares current year and previous year data.
Is this dashboard suitable for multi-store operations?
Yes. It can scale for multiple stores and departments.
Click to Purchases Department Stores KPI Dashboard in Power BI
Visit our YouTube channel to learn step-by-step video tutorials