Managing mortgage lending operations without clear visibility often creates delays, revenue leakage, and missed growth opportunities. Therefore, lenders must rely on structured, real-time performance insights instead of scattered spreadsheets. That is exactly where a Mortgage Lenders Dashboard in Excel becomes a powerful decision-making tool.
This detailed, SEO-friendly guide explains what a Mortgage Lenders Dashboard in Excel is, how it works, why it matters, its page-wise structure, advantages, best practices, and frequently asked questions. Moreover, the language remains simple, practical, and easy to follow so mortgage lenders, loan officers, analysts, and management teams can use it confidently.
Click to Purchases Mortgage Lenders Dashboard in Excel
What Is a Mortgage Lenders Dashboard in Excel?
A Mortgage Lenders Dashboard in Excel is a ready-to-use analytical solution that helps mortgage lenders track, monitor, and analyze loan performance metrics in one centralized Excel file.
Instead of reviewing multiple reports, emails, and manual trackers, this dashboard consolidates all critical mortgage KPIs into interactive charts, slicers, and summary cards. As a result, lenders gain instant insights into approvals, disbursements, borrower behavior, property trends, and monthly loan performance.
Most importantly, because it is built entirely in Microsoft Excel, teams can use it without advanced technical skills or expensive BI tools.
Why Do Mortgage Lenders Need a Dashboard in Excel?
Mortgage lending involves complex processes, multiple stakeholders, and high-value transactions. Therefore, lenders must track performance accurately and consistently.
Here is why a Mortgage Lenders Dashboard in Excel becomes essential:
-
Mortgage data often sits in disconnected systems
-
Manual reporting consumes time and increases errors
-
Decision-makers need instant performance visibility
-
Regulatory and compliance tracking requires accuracy
-
Management expects clear, visual insights
Consequently, a centralized Excel dashboard eliminates confusion and improves control across the entire lending lifecycle.
How Does a Mortgage Lenders Dashboard in Excel Work?
A Mortgage Lenders Dashboard in Excel works through a structured yet flexible workflow.
Step 1: Data Collection
First, loan-level data gets stored in a dedicated Data Sheet. This sheet captures all required loan information such as loan amount, borrower type, property type, credit score band, EMI, processing fee, region, and month.
Step 2: Data Processing
Next, Excel formulas, helper columns, and structured tables standardize the data. As a result, calculations such as approval percentage, disbursed amount, pending loan percentage, and monthly EMI become consistent.
Step 3: Interactive Analysis
Then, pivot tables and charts convert raw data into insights. Slicers allow users to filter data by month, loan type, borrower type, property type, and region.
Step 4: Visual Reporting
Finally, the dashboard pages display insights through cards, charts, and trend visuals. Therefore, users can instantly understand performance without manual calculations.
Page Navigator: Why Is Easy Navigation Important?
The Page Navigator, located on the left side of the dashboard, allows users to move seamlessly between analytical pages.
Because mortgage dashboards include multiple analysis views, easy navigation saves time and improves user experience. As a result, lenders can jump directly to the required analysis without scrolling or searching.
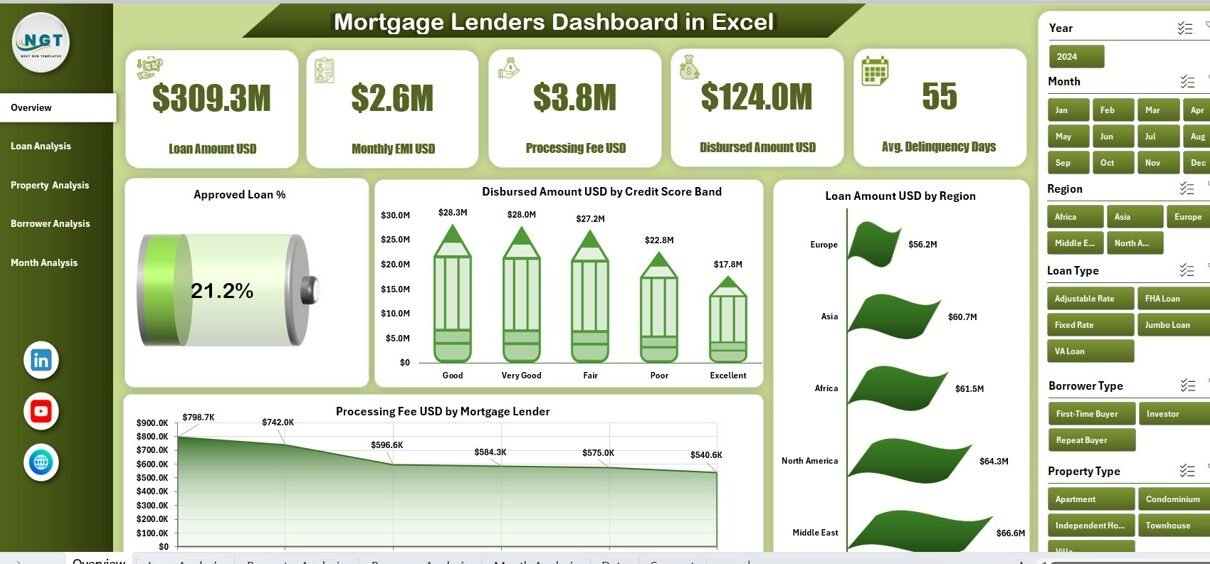
Overview Page: What Does the Main Dashboard Show?
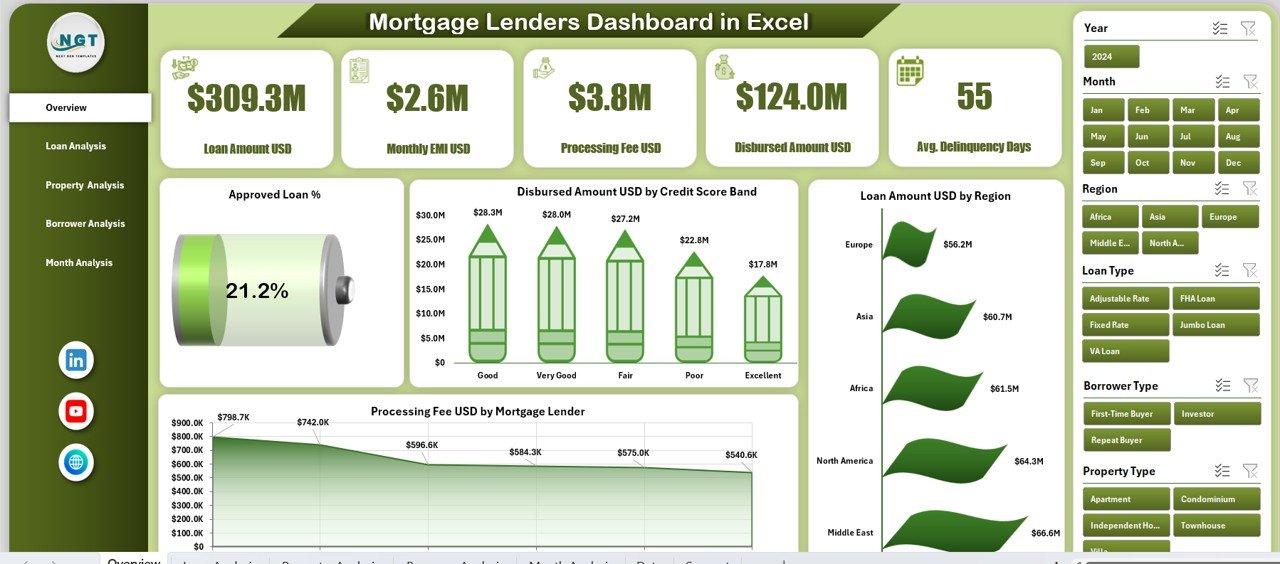
The Overview Page acts as the command center of the Mortgage Lenders Dashboard in Excel.
Key Elements of the Overview Page
-
Right-side slicer for quick filtering
-
Five KPI cards for instant performance summary
-
Four high-impact charts for executive-level insights
Charts Available on the Overview Page
-
Approved Loan % – Shows overall loan approval efficiency
-
Disbursed Amount USD by Credit Score Band – Highlights credit quality impact
-
Loan Amount USD by Region – Identifies geographic performance
-
Processing Fee USD by Mortgage Lender – Tracks fee income contribution
As a result, leadership teams can understand business health within seconds.
Loan Analysis Page: How Do Loan Types Perform?
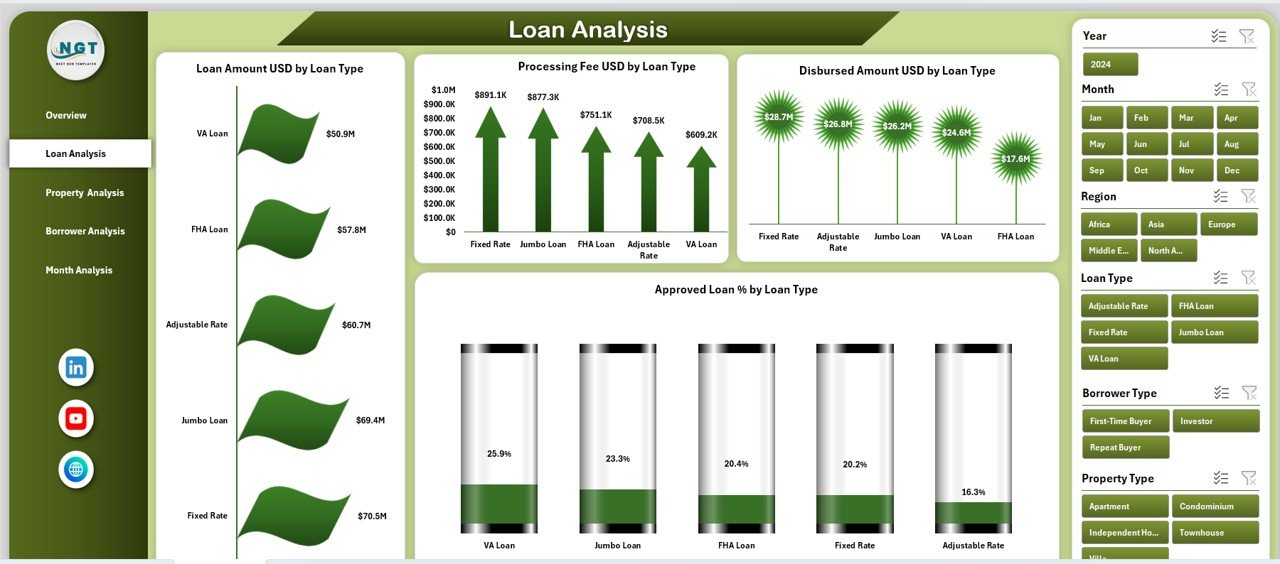
The Loan Analysis Page focuses on performance by loan category.
Why Loan-Wise Analysis Matters
Different loan types behave differently in terms of approval rates, fees, and disbursement values. Therefore, lenders must evaluate each loan type separately.
Charts Available on the Loan Analysis Page
-
Loan Amount USD by Loan Type
-
Processing Fee USD by Loan Type
-
Disbursed Amount USD by Loan Type
-
Approved Loan % by Loan Type
Consequently, lenders can identify profitable loan products and optimize underwriting strategies.
Click to Purchases Mortgage Lenders Dashboard in Excel
Property Analysis Page: Which Property Types Drive Business?
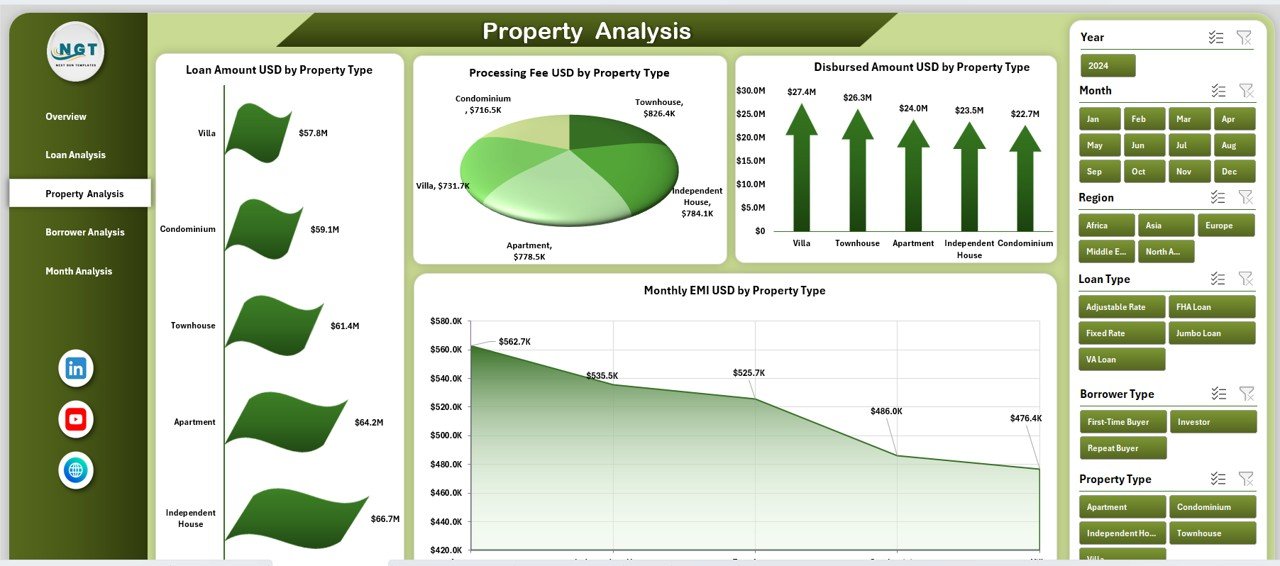
The Property Analysis Page provides insights into property-based lending trends.
Why Property Analysis Is Important
Property type directly influences risk, loan value, and approval rates. Therefore, lenders must monitor performance across residential, commercial, and other property categories.
Charts Available on the Property Analysis Page
-
Loan Amount USD by Property Type
-
Processing Fee USD by Property Type
-
Disbursed Amount USD by Property Type
-
Approved Loan % by Property Type
As a result, lenders can align product offerings with market demand.
Borrower Analysis Page: Who Are Your Key Borrowers?
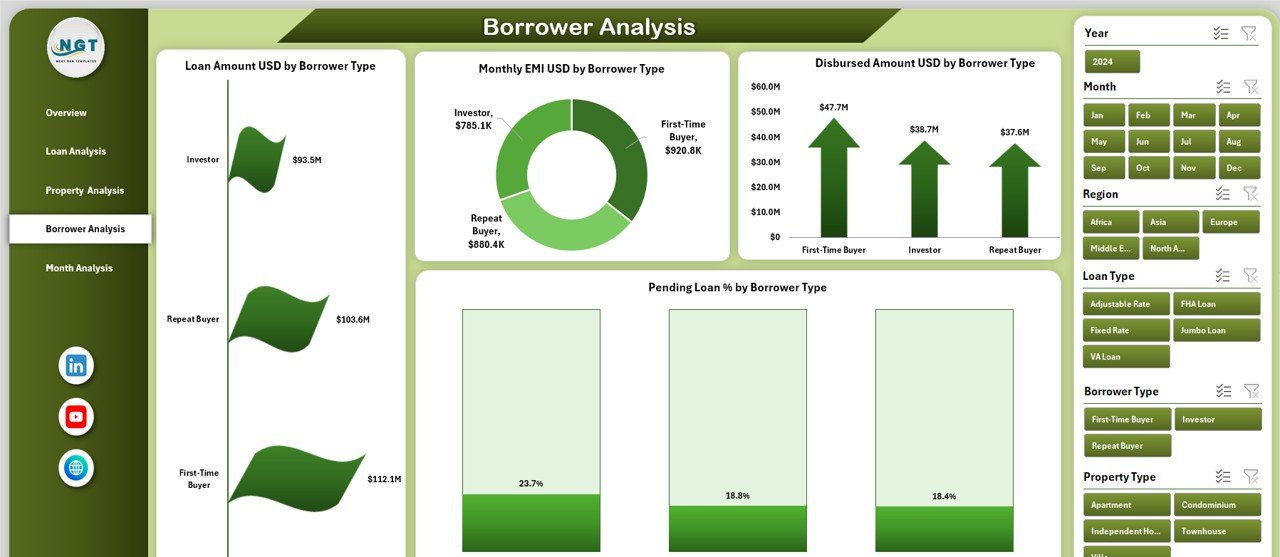
The Borrower Analysis Page focuses on borrower behavior and repayment patterns.
Why Borrower Analysis Matters
Different borrower segments show varying risk profiles, EMI trends, and approval rates. Therefore, lenders must analyze borrower data carefully.
Charts Available on the Borrower Analysis Page
-
Loan Amount USD by Borrower Type
-
Monthly EMI USD by Borrower Type
-
Disbursed Amount USD by Borrower Type
-
Pending Loan % by Borrower Type
Consequently, lenders can design targeted lending strategies and reduce default risk.
Month Analysis Page: How Does Performance Change Over Time?
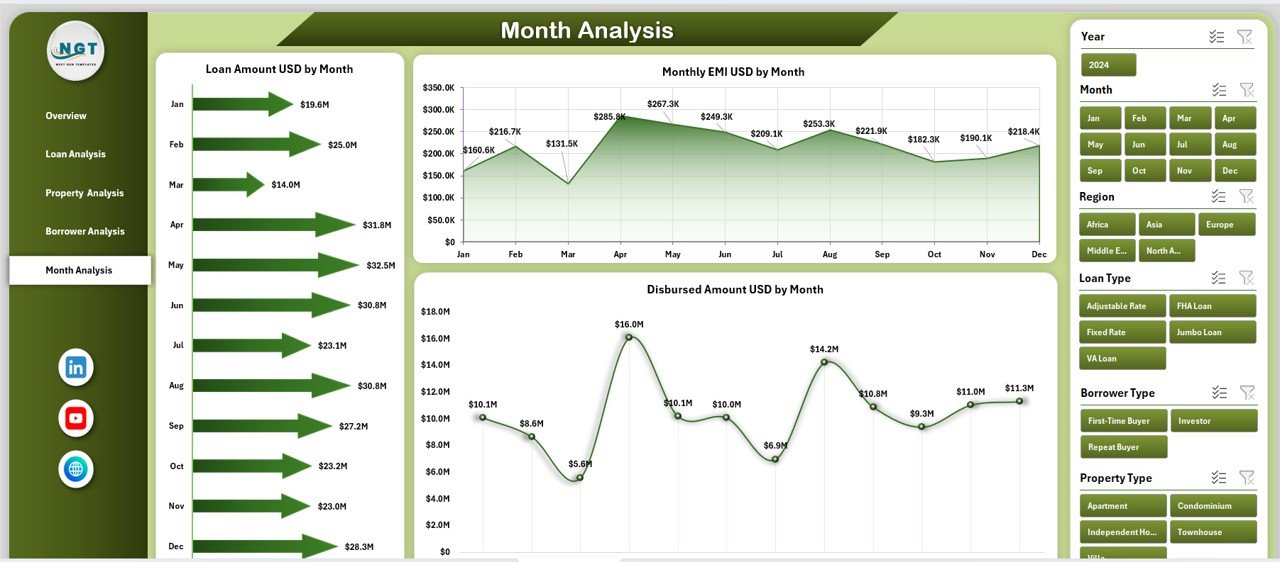
The Month Analysis Page helps track lending trends across months.
Why Monthly Analysis Is Critical
Mortgage demand fluctuates due to market conditions, interest rates, and seasonality. Therefore, month-wise insights support proactive planning.
Charts Available on the Month Analysis Page
-
Loan Amount USD by Month
-
Monthly EMI USD by Month
-
Disbursed Amount USD by Month
As a result, lenders can forecast demand and manage liquidity efficiently.
Click to Purchases Mortgage Lenders Dashboard in Excel
Support Sheet and Data Sheet: Why Are They Important?
Data Sheet
The Data Sheet stores raw mortgage data in a structured table format. Because all dashboard visuals depend on this sheet, accurate data entry becomes crucial.
Support Sheet
The Support Sheet contains helper calculations, mappings, and backend logic. As a result, the dashboard remains clean, organized, and easy to maintain.
Advantages of Mortgage Lenders Dashboard in Excel
Using a Mortgage Lenders Dashboard in Excel offers several business advantages.
1. Centralized Performance Monitoring
-
Track all mortgage KPIs in one file
-
Eliminate scattered reports
-
Improve data consistency
2. Faster Decision-Making
-
Visual insights replace manual analysis
-
Instant identification of trends and issues
-
Better strategic planning
3. Cost-Effective Solution
-
No need for expensive BI tools
-
Uses existing Microsoft Excel infrastructure
-
Minimal training required
4. Easy Customization
-
Add or remove KPIs easily
-
Modify charts and slicers
-
Adapt to business changes
5. Improved Transparency
-
Clear performance metrics
-
Better accountability across teams
-
Enhanced management reporting
Best Practices for the Mortgage Lenders Dashboard in Excel
Following best practices ensures long-term dashboard success.
1. Maintain Clean Data
-
Validate data entries regularly
-
Avoid blank or duplicate records
-
Use consistent naming conventions
2. Use Structured Tables
-
Convert raw data into Excel Tables
-
Improve formula accuracy
-
Simplify dashboard updates
3. Limit KPI Overload
-
Focus on meaningful metrics
-
Avoid unnecessary visuals
-
Keep dashboards readable
4. Refresh Data Regularly
-
Update data weekly or monthly
-
Ensure slicers reflect new periods
-
Maintain historical accuracy
5. Protect Critical Sheets
-
Lock formulas and support sheets
-
Prevent accidental edits
-
Improve file reliability
Who Can Use a Mortgage Lenders Dashboard in Excel?
This dashboard benefits multiple roles:
-
Mortgage lenders
-
Loan officers
-
Credit analysts
-
Risk management teams
-
Finance managers
-
Senior leadership
Therefore, it becomes a shared performance platform across departments.
How Does This Dashboard Improve Business Growth?
A Mortgage Lenders Dashboard in Excel directly supports growth by:
-
Identifying high-performing loan segments
-
Reducing approval cycle inefficiencies
-
Improving borrower targeting
-
Enhancing revenue forecasting
As a result, lenders gain a competitive advantage in the mortgage market.
Conclusion: Is a Mortgage Lenders Dashboard in Excel Worth It?
A Mortgage Lenders Dashboard in Excel transforms raw mortgage data into actionable insights. Instead of relying on manual reports and delayed analysis, lenders gain clarity, speed, and confidence in decision-making.
Because it is flexible, cost-effective, and easy to use, this dashboard becomes an essential tool for modern mortgage operations. Therefore, lenders who adopt structured dashboards position themselves for sustainable growth and improved profitability.
Frequently Asked Questions (FAQs)
1. What is a Mortgage Lenders Dashboard in Excel used for?
A Mortgage Lenders Dashboard in Excel tracks loan approvals, disbursements, borrower trends, and monthly performance in one interactive file.
2. Can beginners use this dashboard?
Yes, because it uses standard Excel features, beginners can use it easily with basic Excel knowledge.
3. Can I customize KPIs in the dashboard?
Absolutely. You can add, remove, or modify KPIs, charts, and slicers based on business needs.
4. How often should data be updated?
Ideally, data should be updated monthly or weekly, depending on reporting requirements.
5. Does this dashboard replace BI tools?
While it does not fully replace enterprise BI tools, it provides powerful analytics for small to mid-size mortgage lenders.
6. Is Excel secure for mortgage data?
Yes, when proper password protection and access controls are applied.
Visit our YouTube channel to learn step-by-step video tutorials