Managing loan recovery without proper visibility often creates delays, higher costs, and lower recovery rates. However, when financial institutions rely only on scattered spreadsheets or manual reports, decision-making becomes slow and reactive. That is exactly why a Loan Recovery Services Dashboard in Excel becomes a powerful and practical solution.
In this detailed guide, you will learn what a Loan Recovery Services Dashboard in Excel is, why it is important, how it works, page-wise dashboard structure, key benefits, best practices, and frequently asked questions. Moreover, the language remains simple, clear, and business-friendly so recovery teams, finance managers, and analysts can apply it easily.
Click to Purchases Loan Recovery Services Dashboard in Excel
What Is a Loan Recovery Services Dashboard in Excel?
A Loan Recovery Services Dashboard in Excel is a ready-to-use analytical dashboard designed to track, monitor, and analyze loan recovery performance from a single Excel file.
Instead of reviewing multiple Excel sheets or static reports, this dashboard consolidates outstanding amounts, recovered amounts, legal costs, open cases, and recovery efficiency into interactive charts and KPI cards.
As a result, loan recovery teams gain clear visibility, faster insights, and better control over recovery operations.
Why Do Loan Recovery Teams Need a Dashboard in Excel?
Loan recovery operations involve multiple loan types, regions, agencies, and recovery methods. However, when data remains scattered, teams struggle to identify bottlenecks.
Therefore, a Loan Recovery Services Dashboard in Excel helps organizations:
-
Track recovered amount percentage
-
Monitor open and closed cases
-
Control legal recovery costs
-
Analyze outstanding loan exposure
-
Compare performance by region, loan type, and recovery method
Consequently, decision-makers can act faster and improve recovery outcomes.
How Does a Loan Recovery Services Dashboard in Excel Work?
This dashboard works entirely within Microsoft Excel, which makes it cost-effective and user-friendly.
Here is how it functions step by step:
-
First, recovery data is entered into a structured Data Sheet
-
Next, Excel formulas, Pivot Tables, and charts process the data
-
Then, slicers filter data dynamically by region, loan type, recovery method, or month
-
Finally, visual charts and KPI cards update automatically
Because of this structure, users can analyze performance instantly without technical complexity.
Key Features of Loan Recovery Services Dashboard in Excel
This dashboard comes with a page navigator, interactive slicers, and multiple analytical views. Moreover, each page focuses on a specific recovery perspective.
Page Navigator for Easy Navigation
-
Located on the left side
-
Allows users to move quickly between dashboard pages
-
Improves user experience and usability
As a result, even non-technical users can explore insights easily.
Page-Wise Dashboard Structure Explained
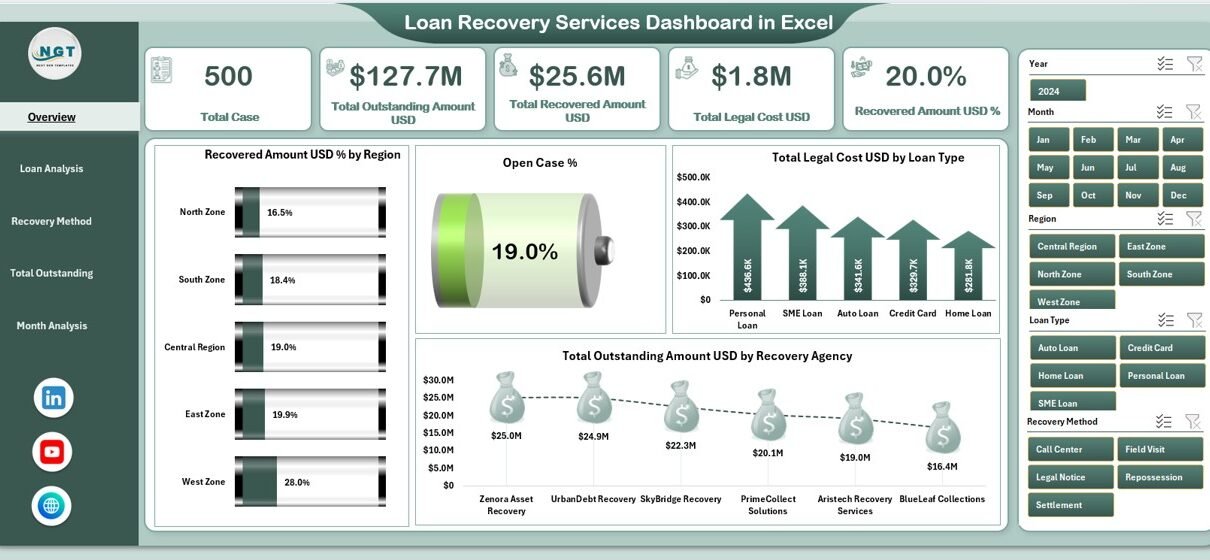
1. Overview Page – How Is Overall Loan Recovery Performance Measured?
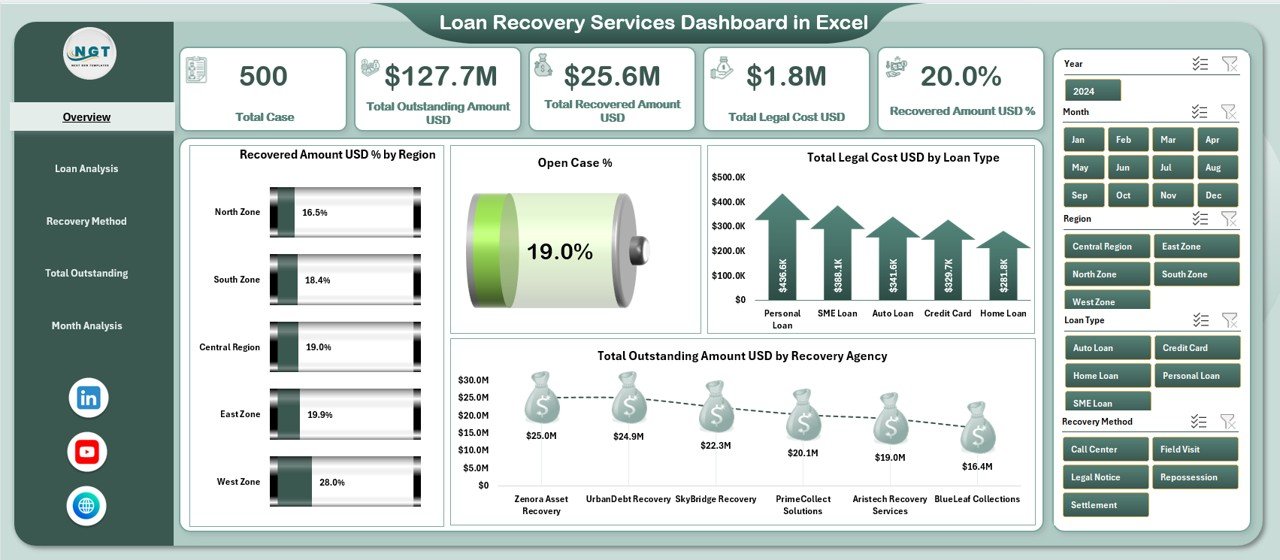
The Overview Page provides a high-level snapshot of loan recovery performance.
Key Highlights:
-
Right-side slicers for dynamic filtering
-
KPI cards for quick performance review
-
Summary charts for strategic insights
KPI Cards Include:
-
Recovered Amount %
-
Open Case %
-
Total Legal Cost USD
-
Total Outstanding Amount USD
-
Total Recovered Amount USD
Charts on Overview Page:
-
📊 Recovered Amount % by Region
-
📊 Open % by Region
-
📊 Total Legal Cost USD by Loan Type
-
📊 Total Outstanding Amount USD by Recovery Agency
Therefore, leadership teams can quickly understand recovery effectiveness across regions and loan categories.
Click to Purchases Loan Recovery Services Dashboard in Excel
2. Loan Analysis Page – Which Loan Types Perform Better in Recovery?
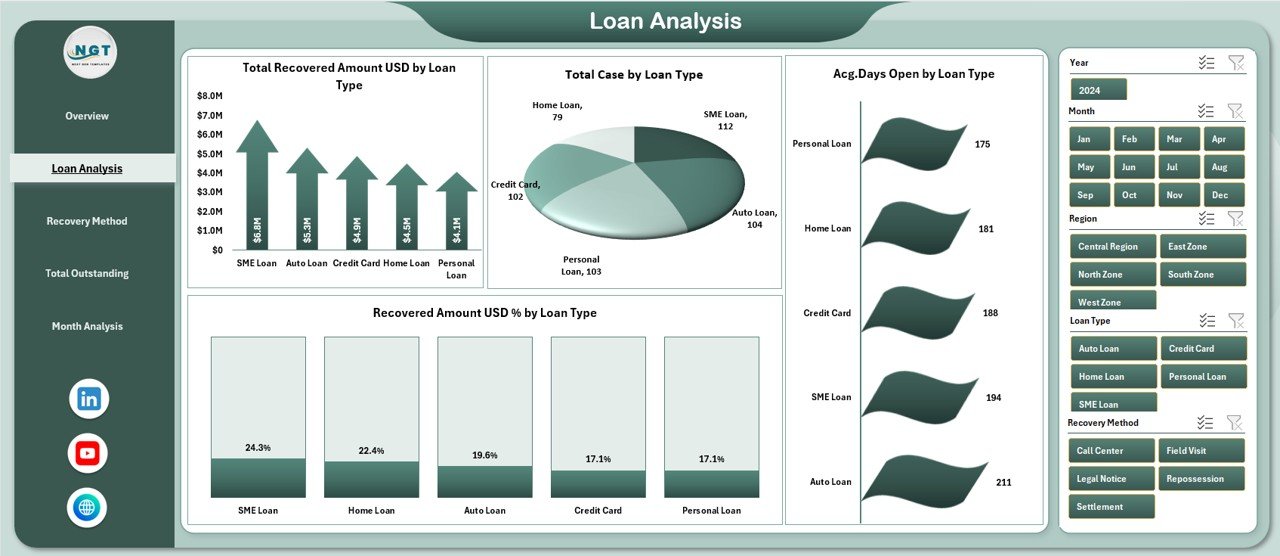
The Loan Analysis Page focuses on recovery metrics by loan type.
Key Features:
-
Right-side slicers for filtering
-
Loan-wise recovery insights
Charts Included:
-
📈 Total Recovered Amount USD by Loan Type
-
📊 Total Cases by Loan Type
-
📉 Average Days Open by Loan Type
-
📈 Recovered Amount % by Loan Type
Because of this analysis, teams can identify high-risk loan categories and optimize recovery strategies accordingly.
3. Recovery Method Analysis – Which Recovery Methods Are Most Effective?
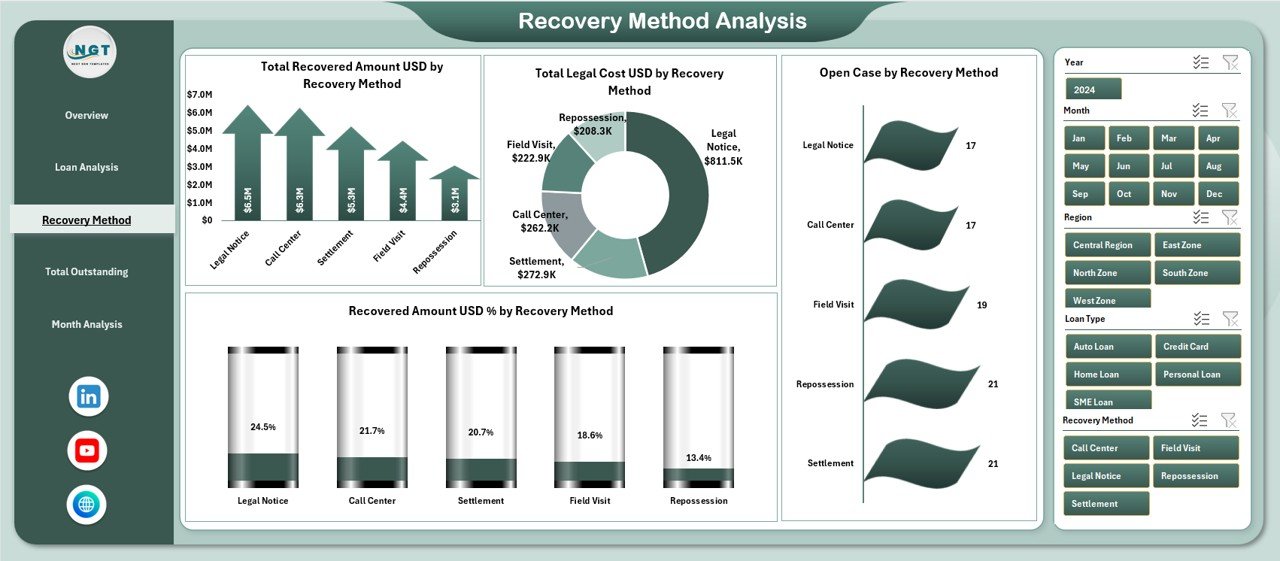
Different recovery methods produce different outcomes. Therefore, this page evaluates recovery efficiency by method.
Charts on This Page:
-
📊 Total Recovered Amount USD by Recovery Method
-
📉 Total Legal Cost USD by Recovery Method
-
📊 Open Cases by Recovery Method
-
📈 Recovered Amount % by Recovery Method
As a result, organizations can focus on cost-effective recovery methods while reducing expensive legal actions.
4. Total Outstanding Analysis – Where Is the Maximum Exposure?
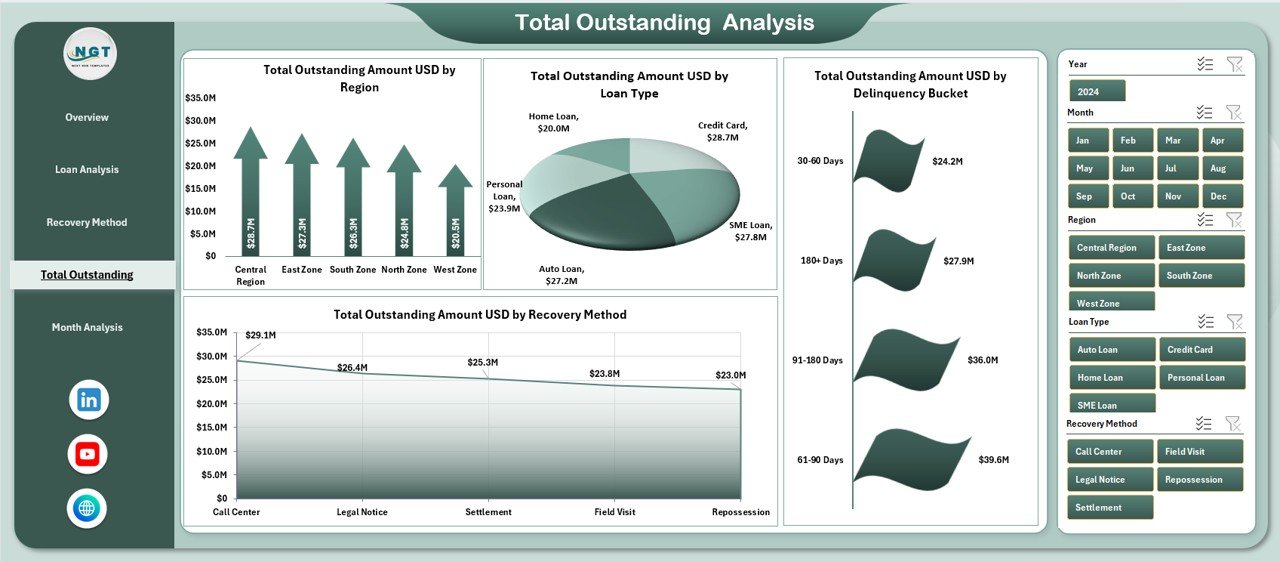
The Total Outstanding Analysis Page highlights pending exposure across multiple dimensions.
Charts Included:
-
📊 Total Outstanding Amount USD by Region
-
📊 Total Outstanding Amount USD by Loan Type
-
📊 Total Outstanding Amount USD by Delinquency Bucket
-
📊 Total Outstanding Amount USD by Recovery Method
Consequently, risk teams can prioritize high-value outstanding portfolios for faster recovery.
Click to Purchases Loan Recovery Services Dashboard in Excel
5. Month Analysis – How Does Recovery Performance Change Over Time?
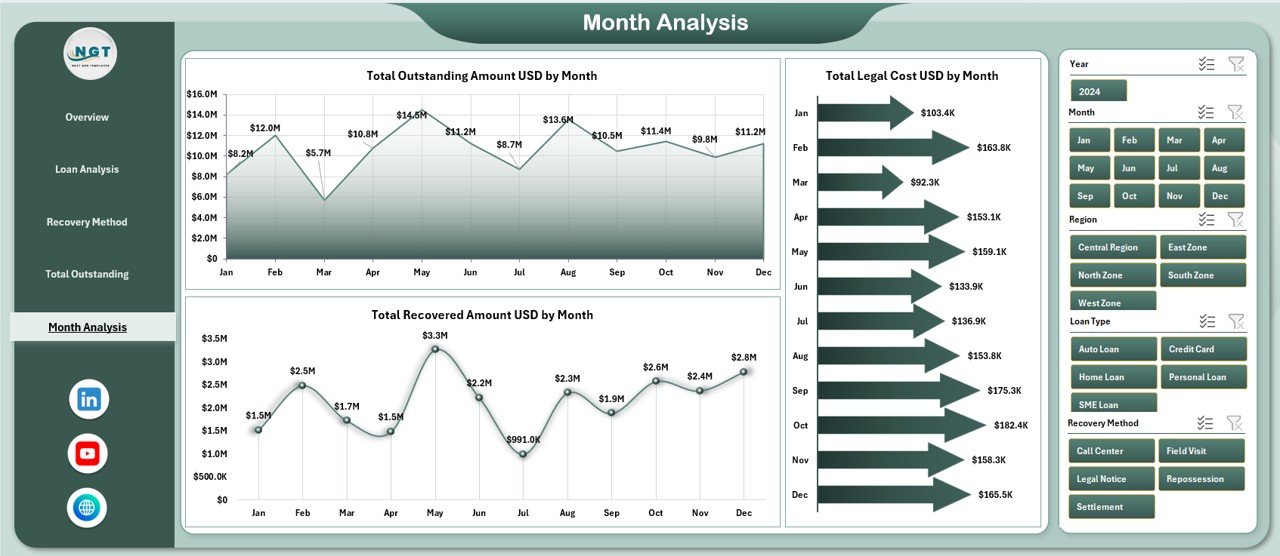
The Month Analysis Page tracks recovery trends over time.
Charts on This Page:
-
📈 Total Outstanding Amount USD by Month
-
📉 Total Legal Cost USD by Month
-
📈 Total Recovered Amount USD by Month
Because of this monthly view, managers can detect seasonal trends, performance drops, and cost spikes early.
Support Sheet and Data Sheet – Why Are They Important?
Data Sheet
-
Stores raw recovery data
-
Acts as the backend for the dashboard
-
Supports automation and refresh
Support Sheet
-
Contains lookup tables and helper data
-
Improves dashboard stability
-
Enhances calculation accuracy
Together, these sheets ensure data integrity and smooth performance.
Advantages of Loan Recovery Services Dashboard in Excel
Using this dashboard delivers multiple business advantages:
-
✅ Centralized recovery performance monitoring
-
✅ Faster decision-making through visual insights
-
✅ Improved recovery rate tracking
-
✅ Better control over legal costs
-
✅ Easy customization without advanced tools
-
✅ Reduced dependency on multiple reports
Therefore, loan recovery teams operate more efficiently and confidently.
Opportunities for Improvement in Loan Recovery Using Dashboards
Even strong dashboards offer opportunities for further improvement:
-
🔹 Add predictive recovery scoring
-
🔹 Integrate aging trend indicators
-
🔹 Include agent-wise performance tracking
-
🔹 Automate monthly data imports
-
🔹 Expand to Power BI integration if required
As a result, organizations can continuously enhance recovery performance.
Best Practices for the Loan Recovery Services Dashboard in Excel
To get the maximum value, follow these best practices:
-
📌 Keep the data sheet clean and structured
-
📌 Update recovery data regularly
-
📌 Use standardized loan and region names
-
📌 Monitor legal costs against recovered amounts
-
📌 Train users on slicers and filters
-
📌 Review KPIs weekly or monthly
Because of these practices, the dashboard remains accurate, reliable, and impactful.
Click to Purchases Loan Recovery Services Dashboard in Excel
Who Should Use a Loan Recovery Services Dashboard in Excel?
This dashboard suits multiple stakeholders:
-
Loan recovery teams
-
Collection agencies
-
Finance managers
-
Risk management teams
-
Banking and NBFC leadership
-
Compliance and legal teams
Hence, it supports both operational execution and strategic planning.
Why Choose Excel for Loan Recovery Dashboards?
Excel offers several advantages:
-
No additional software cost
-
Easy customization
-
Wide user familiarity
-
Flexible data handling
-
Scalable for small and large portfolios
Therefore, Excel remains a powerful platform for recovery analytics.
Conclusion: Is a Loan Recovery Services Dashboard in Excel Worth It?
Absolutely.
A Loan Recovery Services Dashboard in Excel transforms complex recovery data into clear, actionable insights. It helps organizations reduce outstanding exposure, control legal costs, improve recovery rates, and make smarter decisions.
Moreover, because it is Excel-based, teams can adopt it quickly without heavy investments. As a result, it becomes a practical, scalable, and high-impact solution for modern loan recovery operations.
Frequently Asked Questions (FAQs)
What is a Loan Recovery Services Dashboard in Excel?
It is an Excel-based dashboard that tracks loan recovery performance, outstanding amounts, legal costs, and recovery efficiency.
Can non-technical users operate this dashboard?
Yes, the dashboard uses slicers, charts, and structured layouts that anyone can use easily.
Does this dashboard support multiple loan types?
Yes, it supports analysis by loan type, region, recovery method, and delinquency bucket.
How often should recovery data be updated?
Ideally, data should be updated daily or weekly for accurate insights.
Can this dashboard be customized?
Yes, it is fully customizable in Excel to match organizational needs.
Is this dashboard suitable for banks and NBFCs?
Yes, it is ideal for banks, NBFCs, collection agencies, and financial institutions.
Visit our YouTube channel to learn step-by-step video tutorials
Click to Purchases Loan Recovery Services Dashboard in Excel