Digital creators now operate like full-scale businesses. They manage sponsorships, ad revenue, production costs, platform fees, and community engagement daily. However, when data spreads across multiple sheets, tools, and reports, creators and guild managers lose clarity and control.
That is exactly why a Digital Creators Guilds Dashboard in Excel becomes a powerful and practical solution.
This article explains what a Digital Creators Guilds Dashboard in Excel is, why it is important, how it works, page-wise dashboard structure, key metrics, advantages, best practices, and frequently asked questions. Moreover, the language stays easy so creators, guild managers, and analysts can use it confidently.
Click to Purchases Digital Creators Guilds Dashboard in Excel
What Is a Digital Creators Guilds Dashboard in Excel?
A Digital Creators Guilds Dashboard in Excel is a ready-to-use analytical Excel template designed to track, analyze, and visualize financial and performance data of digital creators working under a guild or collective.
Instead of managing raw data in scattered spreadsheets, this dashboard converts creator data into clear visual insights. As a result, guild managers can track costs, revenue, profit, engagement, and satisfaction from one centralized dashboard.
Because it runs entirely in Excel, this dashboard remains affordable, flexible, and easy to customize for different creator guild models.
Why Do Digital Creators Guilds Need a Dashboard?
Digital creator guilds handle multiple creators, platforms, contracts, and revenue streams. Therefore, manual tracking often leads to confusion and missed insights.
A Digital Creators Guilds Dashboard in Excel helps because it:
-
Centralizes cost and revenue tracking
-
Shows profit and margins clearly
-
Tracks engagement and satisfaction scores
-
Compares performance across platforms and countries
-
Supports data-driven strategic decisions
As a result, guilds gain transparency, efficiency, and scalability.
How Does the Digital Creators Guilds Dashboard in Excel Work?
This dashboard follows a simple and user-friendly workflow.
-
Data is maintained in structured data sheets
-
Calculations happen automatically using Excel formulas
-
Visuals update instantly based on slicer selection
Because of this design, even non-technical users can operate the dashboard smoothly.
What Is the Page Navigator and Why Is It Important?
The dashboard includes a Page Navigator located on the left side of the workbook.
Key Benefits of the Page Navigator
-
Quick navigation across all pages
-
No need to search for sheet tabs
-
Clean and professional dashboard experience
This feature improves usability and user experience significantly.
Click to Purchases Digital Creators Guilds Dashboard in Excel
What Pages Are Included in the Digital Creators Guilds Dashboard in Excel?
The dashboard contains five structured analytical pages, each focusing on a specific performance area.
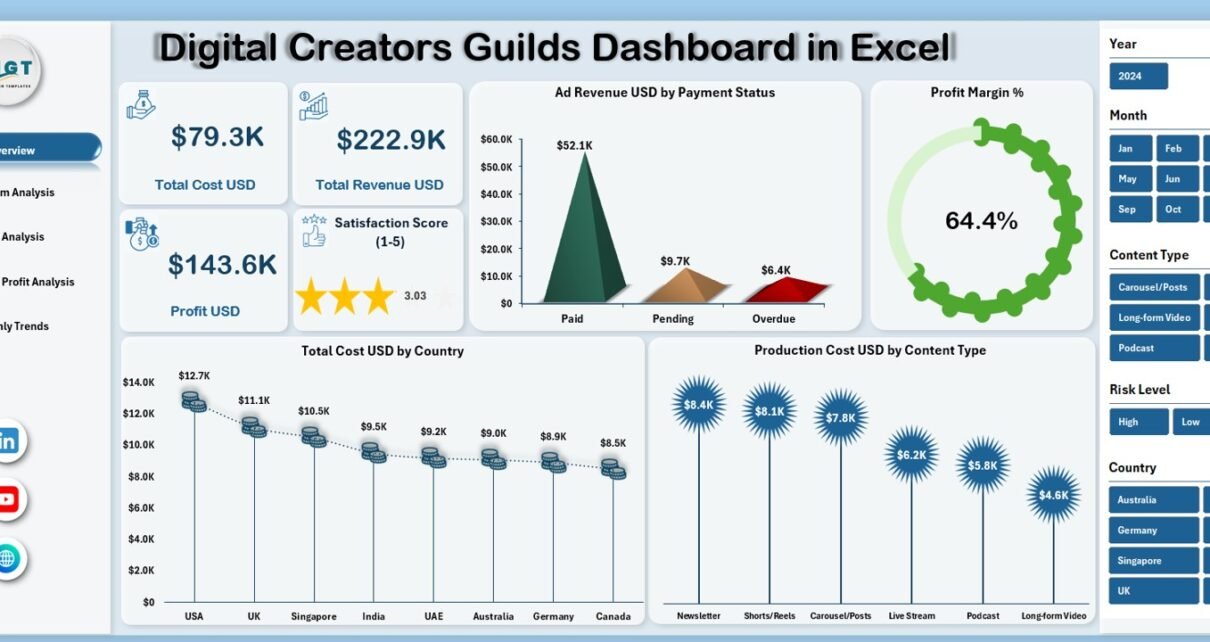
What Does the Overview Page Show?
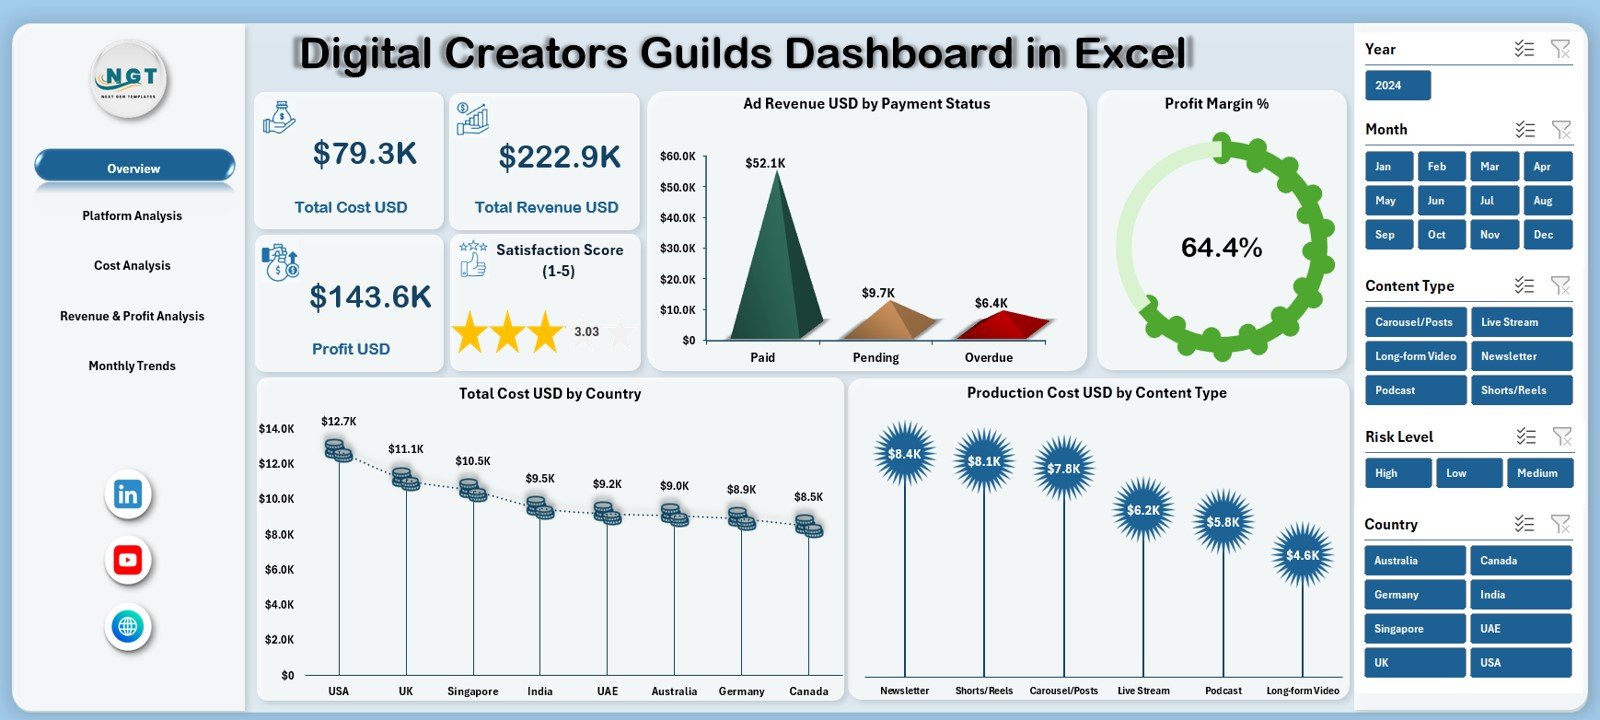
The Overview Page acts as the main summary page of the dashboard.
What KPI Cards Are Displayed on the Overview Page?
The Overview Page displays five KPI cards:
-
Total Cost USD – Overall operational and production cost
-
Total Revenue USD – Total income from ads, sponsorships, and content
-
Profit USD – Net earnings after deducting costs
-
Satisfaction Score (1–5) – Average creator or partner satisfaction score
These cards provide an instant financial and performance snapshot.
What Charts Are Available on the Overview Page?
The Overview Page includes four key charts:
-
Ad Revenue USD by Payment Status
-
Profit Margin %
-
Total Cost USD by Country
-
Production Cost USD by Content Type
Together, these visuals highlight revenue quality, cost distribution, and content efficiency.
Click to Purchases Digital Creators Guilds Dashboard in Excel
What Insights Does the Platform Analysis Page Provide?
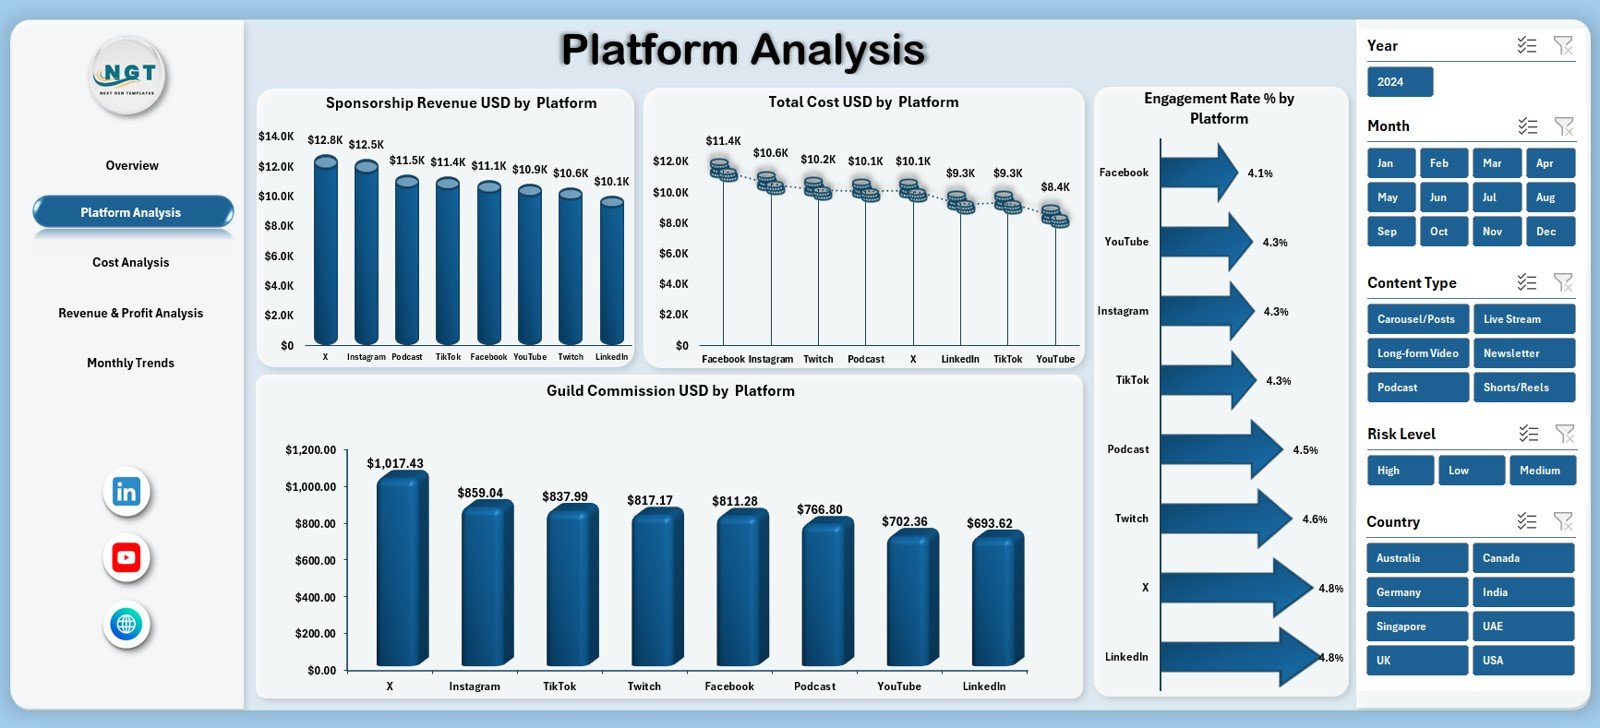
The Platform Analysis Page focuses on performance across digital platforms.
What Charts Are Shown on the Platform Analysis Page?
This page includes four charts:
-
Sponsorship Revenue USD by Platform
-
Total Cost USD by Platform
-
Engagement Rate % by Platform
-
Guild Commission USD by Platform
These insights help guild managers understand which platforms deliver better returns.
Why Is Platform Analysis Important?
Platform analysis helps guilds:
-
Focus on high-engagement platforms
-
Control platform-specific costs
-
Improve commission strategies
-
Optimize creator platform allocation
As a result, platform investments become more profitable.
What Does the Cost Analysis Page Cover?
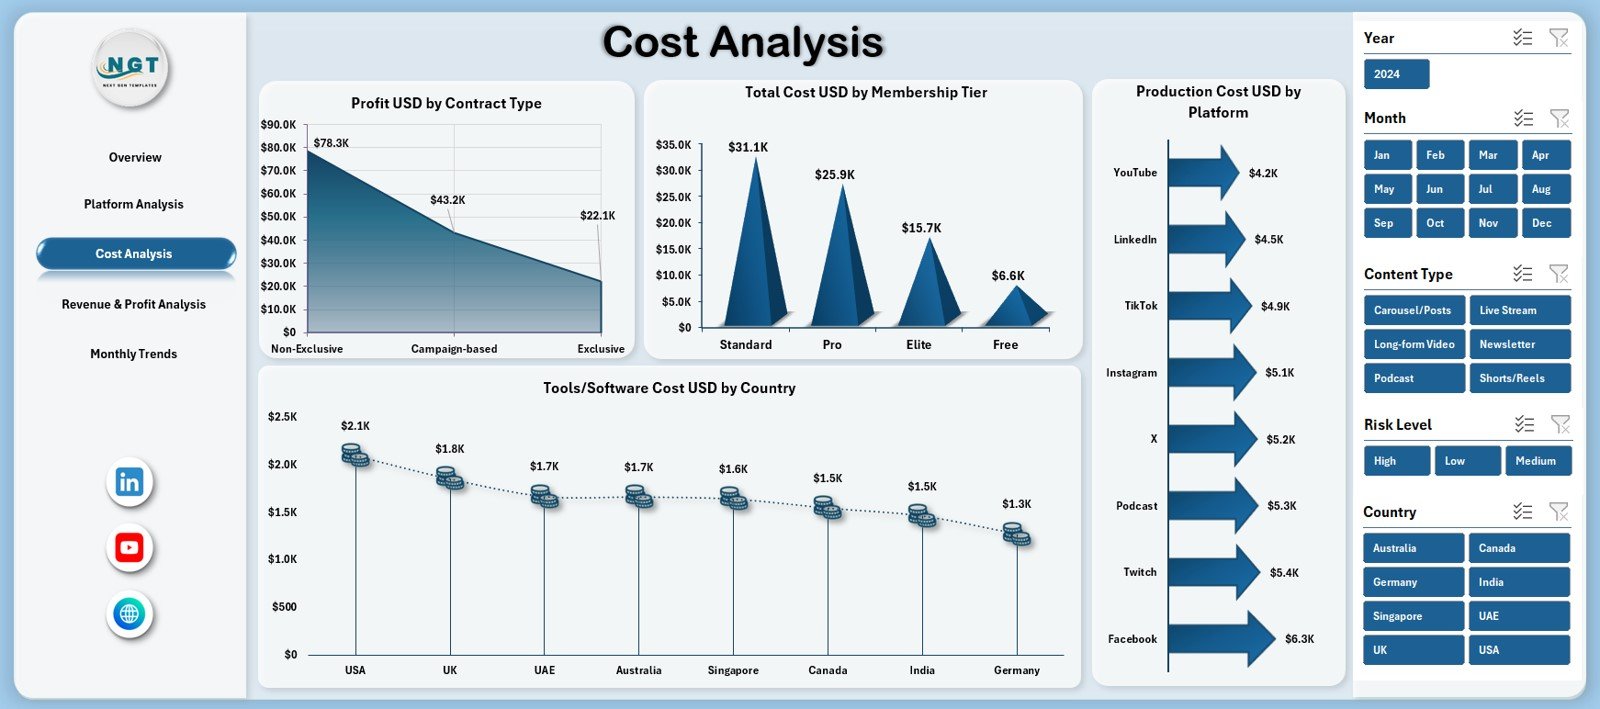
The Cost Analysis Page focuses on understanding where money is spent.
What Charts Are Included on the Cost Analysis Page?
This page includes four charts:
-
Profit USD by Contract Type
-
Total Cost USD by Membership Tier
-
Production Cost USD by Platform
-
Tool / Software Cost USD by Country
These charts reveal cost drivers and efficiency gaps clearly.
How Does Cost Analysis Improve Financial Control?
Cost analysis allows guilds to:
-
Identify high-cost contracts
-
Optimize membership pricing
-
Reduce unnecessary software expenses
-
Improve overall profitability
Therefore, financial planning becomes more precise.
Click to Purchases Digital Creators Guilds Dashboard in Excel
What Insights Does the Revenue & Profit Analysis Page Provide?
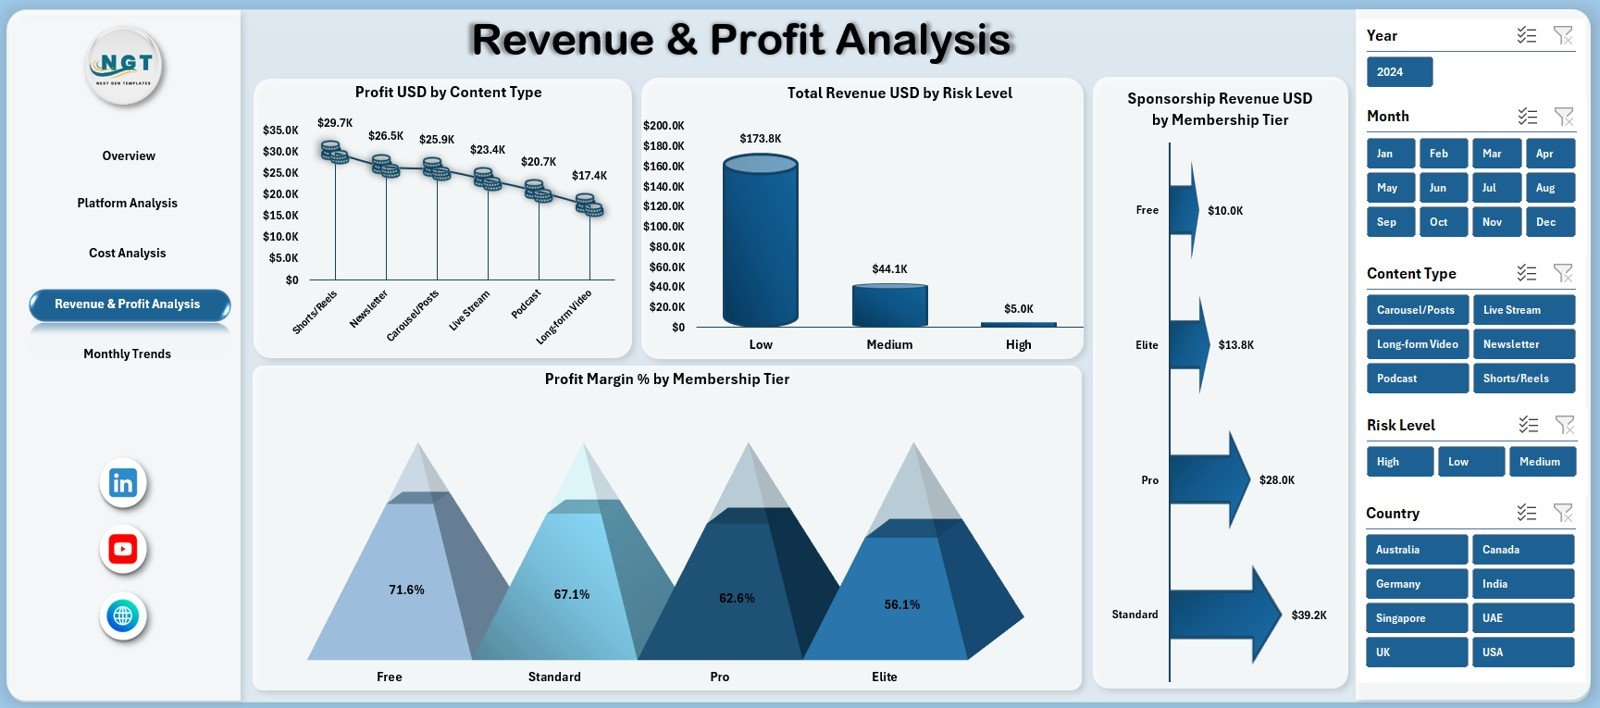
The Revenue & Profit Analysis Page highlights earnings performance.
What Charts Are Displayed on This Page?
This page includes four charts:
-
Profit USD by Content Type
-
Total Revenue USD by Risk Level
-
Profit Margin % by Membership Tier
-
Sponsorship Revenue USD by Membership Tier
These visuals help guilds understand which content and memberships drive profits.
Why Is Revenue Analysis Critical for Creator Guilds?
Revenue analysis helps guilds:
-
Focus on high-margin content
-
Balance risk and reward
-
Improve sponsorship strategies
-
Design better membership tiers
As a result, revenue growth becomes sustainable.
What Does the Monthly Trends Page Show?
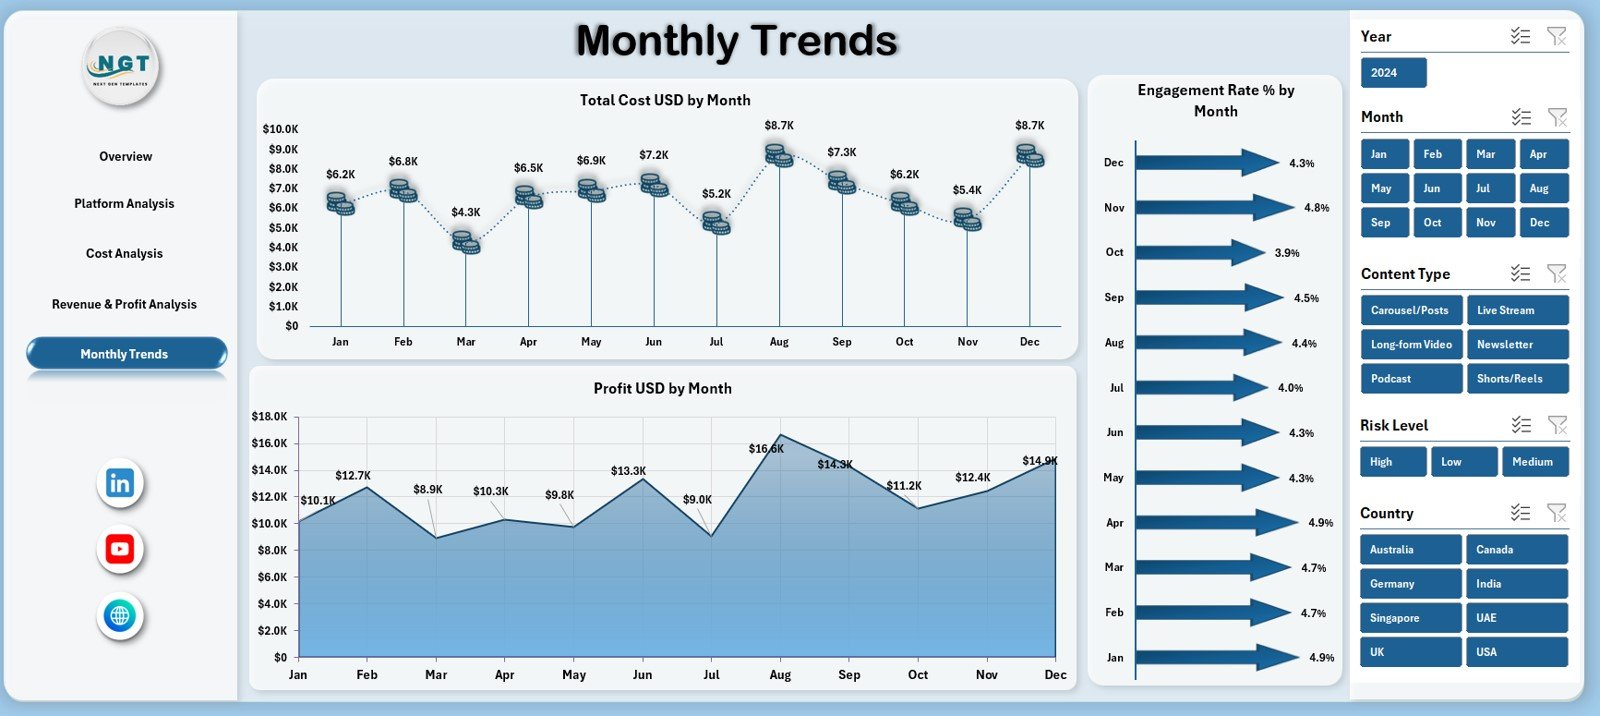
The Monthly Trends Page focuses on time-based analysis.
What Charts Are Available on the Monthly Trends Page?
This page includes three charts:
-
Total Cost USD by Month
-
Engagement Rate % by Month
-
Profit USD by Month
These charts reveal seasonality and performance fluctuations over time.
How Do Monthly Trends Support Planning?
Monthly trends help guilds:
-
Prepare for high-cost periods
-
Monitor engagement consistency
-
Forecast profit more accurately
Therefore, planning becomes proactive instead of reactive.
Advantages of Digital Creators Guilds Dashboard in Excel
Using a Digital Creators Guilds Dashboard in Excel offers several advantages.
Centralized Data Visibility
All financial and engagement metrics remain in one dashboard.
Better Financial Control
Cost, revenue, and profit tracking improves budget management.
Improved Decision-Making
Visual insights support faster and smarter decisions.
Easy Customization
Excel allows easy modification of KPIs and visuals.
Cost-Effective Solution
No expensive BI tools or licenses are required.
Best Practices for the Digital Creators Guilds Dashboard in Excel
Follow these best practices to maximize dashboard value.
Maintain Clean Data Sheets
Always keep data structured and consistent.
Update Data Regularly
Frequent updates ensure accurate insights.
Standardize Definitions
Keep KPI formulas and definitions consistent.
Review Trends Monthly
Monthly reviews help identify early performance shifts.
Train Guild Managers
Ensure users understand how to interpret dashboard metrics.
Click to Purchases Digital Creators Guilds Dashboard in Excel
Who Should Use a Digital Creators Guilds Dashboard in Excel?
This dashboard benefits:
-
Digital Creator Guild Managers
-
Content Network Owners
-
Influencer Management Teams
-
Finance and Operations Teams
-
Business Analysts
-
Digital Media Agencies
Both small creator groups and large guilds can use it effectively.
How Does This Dashboard Improve Creator Guild Performance?
This dashboard converts raw data into actionable insights. As a result:
-
Costs stay under control
-
Revenue opportunities become visible
-
Engagement improves
-
Profitability increases
Over time, data-driven strategies strengthen guild sustainability.
Conclusion: Why Choose a Digital Creators Guilds Dashboard in Excel?
A Digital Creators Guilds Dashboard in Excel provides a structured, visual, and practical way to manage creator operations. It combines financial tracking, engagement analysis, and trend monitoring in one professional Excel dashboard.
For guilds aiming to scale responsibly and profitably, this dashboard becomes an essential management tool.
Click to Purchases Digital Creators Guilds Dashboard in Excel
Frequently Asked Questions (FAQs)
What is a Digital Creators Guilds Dashboard in Excel?
It is an Excel-based dashboard that tracks costs, revenue, profit, and engagement for creator guilds.
Can non-technical users use this dashboard?
Yes. Users only need basic Excel knowledge.
Does it support platform-wise analysis?
Yes. The dashboard includes detailed platform analysis.
Can I add new creators or platforms?
Yes. The dashboard structure supports easy expansion.
Is this dashboard suitable for small creator groups?
Yes. It works well for both small and large guilds.
Does it support monthly trend analysis?
Yes. Monthly cost, engagement, and profit trends are included.
Click to Purchases Digital Creators Guilds Dashboard in Excel
Visit our YouTube channel to learn step-by-step video tutorials