Running a department store involves managing sales, costs, customers, promotions, and multiple departments at the same time. However, many retail teams still depend on scattered Excel files and manual reports. As a result, they struggle to see the complete performance picture. That is exactly where a Department Stores Dashboard in Excel becomes a powerful and practical solution.
In this detailed guide, you will learn what a Department Stores Dashboard in Excel is, why it matters, how it works, its page-wise structure, advantages, best practices, and frequently asked questions. Moreover, the article uses clear language, smooth transitions, and real-world explanations to ensure easy understanding and strong SEO performance.
Click to Purchases Department Stores Dashboard in Excel
What Is a Department Stores Dashboard in Excel?
A Department Stores Dashboard in Excel is a ready-to-use, interactive reporting tool designed to help retail managers track, analyze, and improve store performance using key business metrics.
Instead of working with multiple spreadsheets for sales, costs, promotions, and customer feedback, this dashboard consolidates all critical data into one structured Excel file. Consequently, store managers, department heads, and business owners gain instant visibility into performance trends.
Moreover, because the dashboard works entirely in Excel, it remains cost-effective, flexible, and easy to update. You do not need advanced technical skills or expensive BI software to use it effectively.
Why Do Department Stores Need a Dashboard in Excel?
Department stores operate in a highly competitive environment. Therefore, timely insights play a crucial role in decision-making. Without a centralized dashboard, teams often miss trends and opportunities.
A Department Stores Dashboard in Excel solves this challenge by providing:
-
A single source of truth for sales, costs, and customer metrics
-
Faster performance reviews across departments and stores
-
Clear visibility into customer satisfaction and promotion effectiveness
-
Improved cost control and profit optimization
As a result, decision-makers can act faster and with greater confidence.
How Does a Department Stores Dashboard in Excel Work?
The dashboard pulls data from a structured Data Sheet and transforms it into interactive charts, cards, and summaries. Furthermore, slicers placed on the right side allow users to filter data dynamically.
You can analyze performance by:
-
Store name
-
Department
-
Customer type
-
Promotion type
-
Month
Because of this structure, users can switch views instantly without editing formulas or tables.
What Are the Key Features of the Department Stores Dashboard in Excel?
The dashboard includes several thoughtfully designed features that improve usability and analysis.
📌 Page Navigator for Easy Navigation
The Page Navigator, located on the left side, allows users to move between dashboard pages with a single click. Consequently, users save time and maintain focus while analyzing data.
📊 Interactive Right-Side Slicers
Each page includes slicers on the right side. These slicers help filter data dynamically and update all charts instantly. As a result, analysis becomes faster and more intuitive.
🧾 Clear KPI Cards
On the overview page, KPI cards highlight critical metrics at a glance. Therefore, users can quickly assess overall performance without scrolling through tables.
What Pages Are Included in the Department Stores Dashboard in Excel?
The dashboard contains five analytical pages, each designed for a specific performance view.
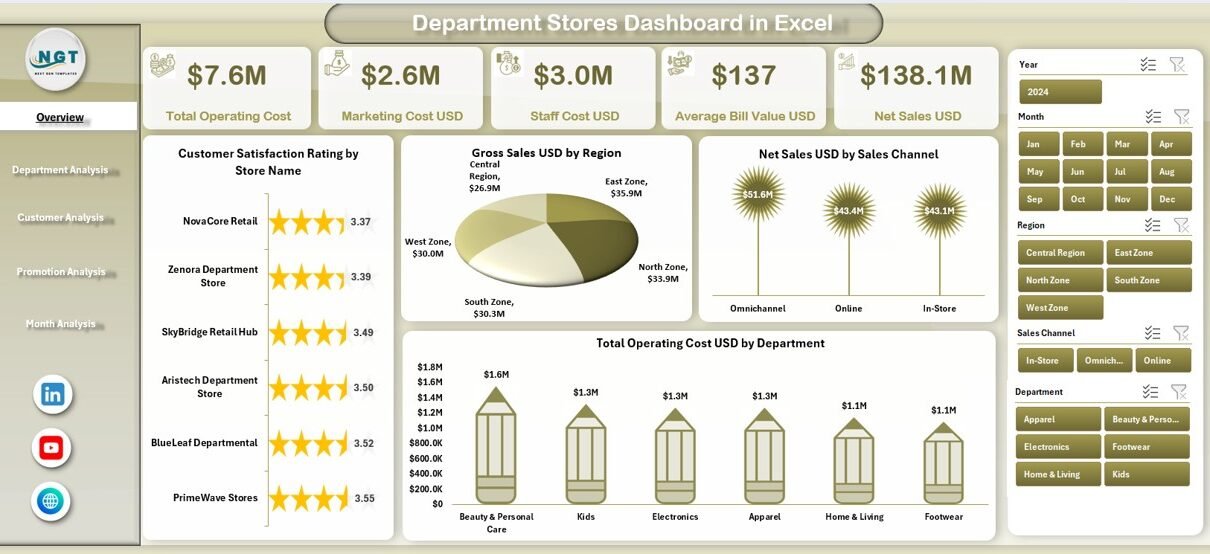
What Does the Overview Page Show?
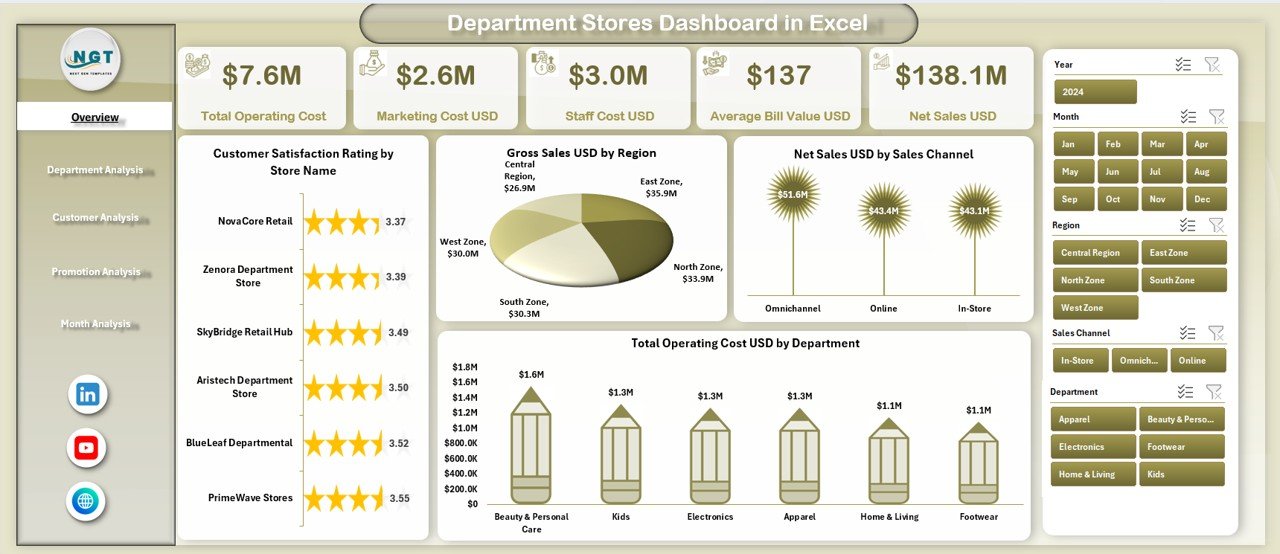
The Overview Page acts as the central summary of the dashboard.
Key Elements of the Overview Page
-
Right-side slicer for quick filtering
-
Four KPI cards highlighting key performance metrics
-
Four analytical charts, including:
-
Customer Satisfaction Rating by Store Name
-
Gross Sales USD by Region
-
Net Sales USD by Sales Channel
-
Total Operating Cost USD by Department
-
This page provides a high-level snapshot of overall business performance. Therefore, management teams can quickly identify strong and weak areas.
How Does the Department Analysis Page Help Managers?
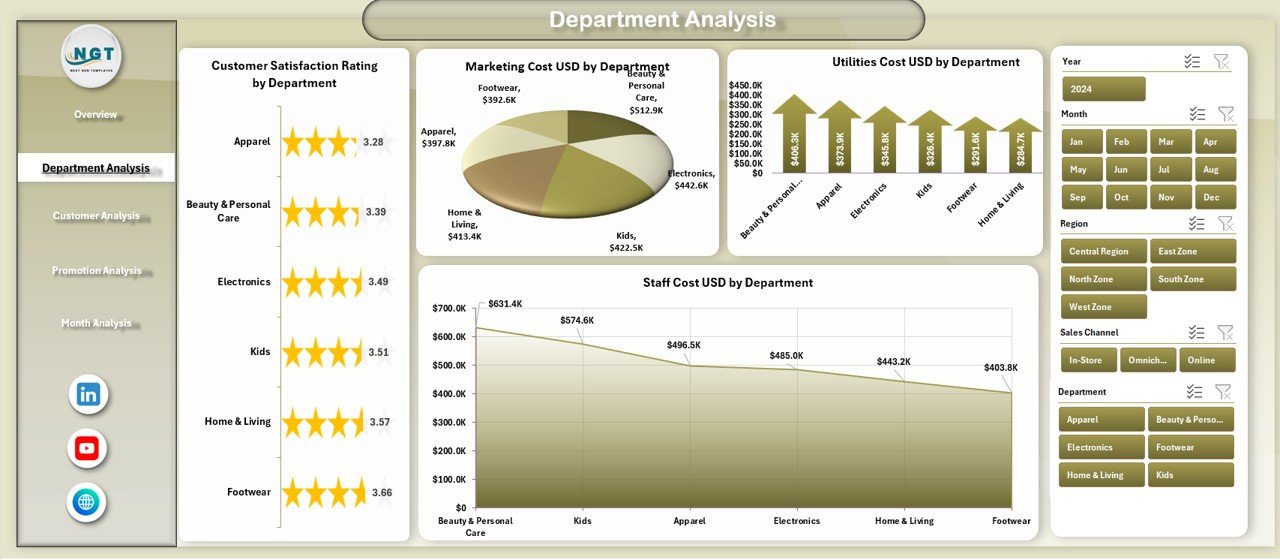
The Department Analysis Page focuses on cost and satisfaction metrics at the department level.
Key Insights from This Page
-
Customer Satisfaction Rating by Department
-
Marketing Cost USD by Department
-
Utilities Cost USD by Department
-
Staff Cost USD by Department
Because of this breakdown, managers can compare departments side by side. As a result, they can identify cost overruns and performance gaps more effectively.
Click to Purchases Department Stores Dashboard in Excel
What Insights Does the Customer Analysis Page Provide?
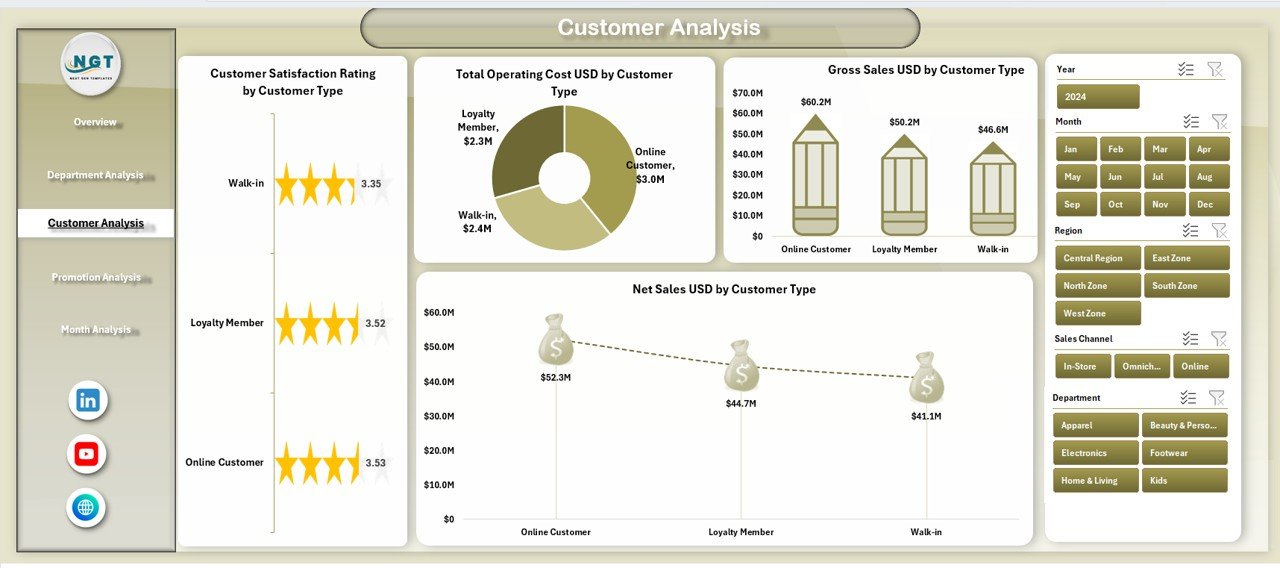
Understanding customers remains essential for retail success. Therefore, the Customer Analysis Page focuses on customer segmentation.
Charts Included on This Page
-
Customer Satisfaction Rating by Customer Type
-
Total Operating Cost USD by Customer Type
-
Gross Sales USD by Customer Type
-
Net Sales USD by Customer Type
With these insights, retailers can understand which customer groups drive profitability and satisfaction. Consequently, marketing and service strategies become more targeted.
Why Is Promotion Analysis Important in Department Stores?
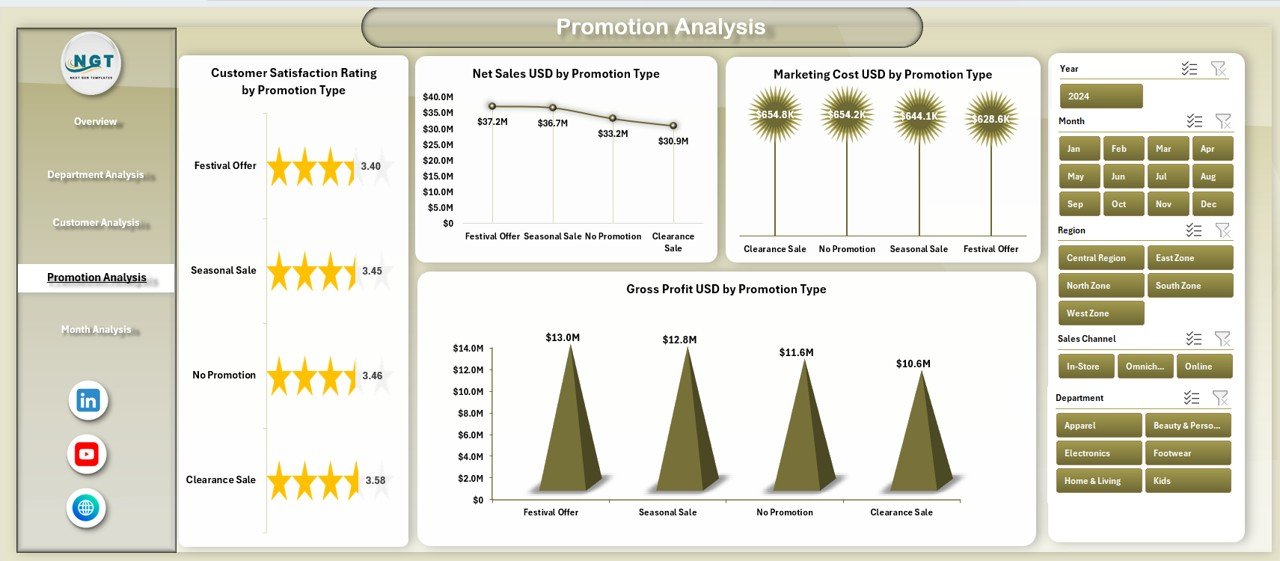
Promotions influence both sales and costs. However, not all promotions deliver equal value. The Promotion Analysis Page helps retailers evaluate promotion performance clearly.
Key Charts on the Promotion Analysis Page
-
Customer Satisfaction Rating by Promotion Type
-
Net Sales USD by Promotion Type
-
Marketing Cost USD by Promotion Type
-
Gross Profit USD by Promotion Type
This page helps teams identify high-performing promotions and eliminate ineffective ones. As a result, promotional budgets deliver better returns.
Click to Purchases Department Stores Dashboard in Excel
How Does the Month Analysis Page Support Trend Tracking?
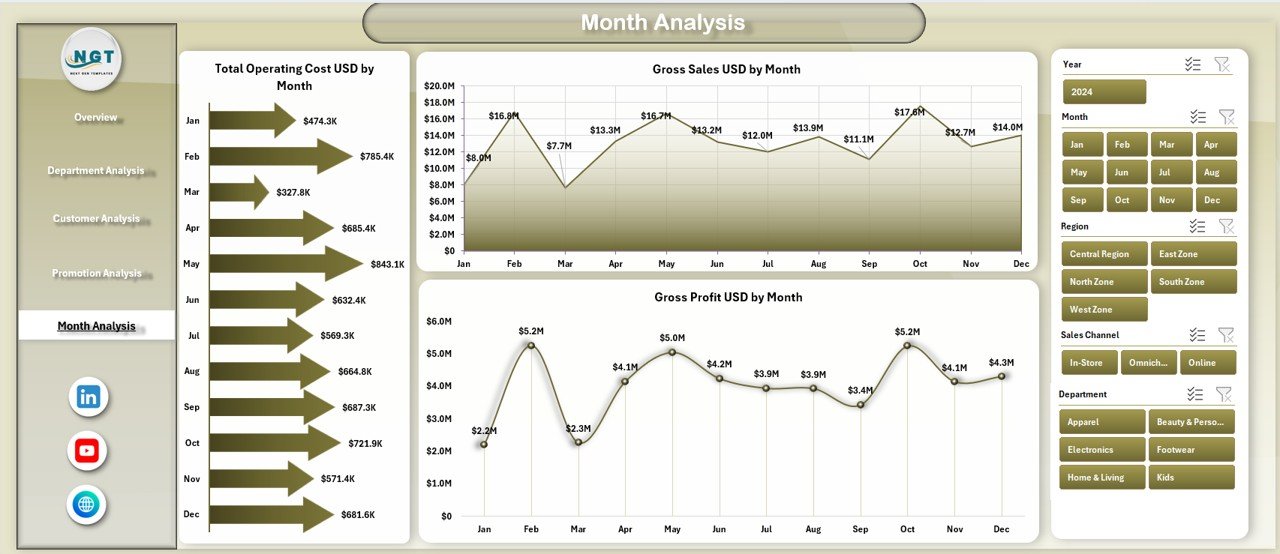
Retail performance often changes month by month. Therefore, the Month Analysis Page focuses on time-based trends.
Charts Included
-
Total Operating Cost USD by Month
-
Gross Sales USD by Month
-
Gross Profit USD by Month
With these charts, users can track seasonal patterns, identify peak months, and plan inventory and staffing more effectively.
What Is the Role of the Support and Data Sheets?
📄 Data Sheet
The Data Sheet serves as the backbone of the dashboard. Users enter or paste raw transactional data here. Once updated, all dashboard visuals refresh automatically.
🛠 Support Sheet
The Support Sheet contains helper calculations, lookup tables, or reference values. It ensures smooth dashboard functioning while keeping the main visuals clean.
Advantages of Department Stores Dashboard in Excel
Using a Department Stores Dashboard in Excel offers several business advantages.
✅ Centralized Performance Tracking
The dashboard brings sales, costs, promotions, and customer data into one file. As a result, teams avoid confusion caused by multiple reports.
✅ Faster Decision-Making
Because data updates instantly through slicers, managers can analyze scenarios in real time. Therefore, decisions become quicker and more accurate.
✅ Improved Cost Control
Department-wise and promotion-wise cost analysis helps identify inefficiencies. Consequently, stores can reduce unnecessary expenses.
✅ Better Customer Understanding
Customer analysis charts highlight satisfaction and profitability by customer type. As a result, service strategies improve.
✅ No Additional Software Cost
Since the dashboard runs in Excel, businesses avoid expensive BI tools. Moreover, Excel remains familiar to most users.
Opportunities for Improvement in Department Stores Dashboards
Even though the dashboard provides strong insights, continuous improvement always helps.
-
Add year-over-year comparison for deeper trend analysis
-
Include store-level profit margin metrics
-
Integrate inventory turnover KPIs
-
Automate data updates using Power Query
These enhancements can further increase dashboard value.
Best Practices for the Department Stores Dashboard in Excel
To maximize results, follow these best practices.
📌 Keep Data Clean and Structured
Always maintain consistent formats in the Data Sheet. Clean data ensures accurate visuals.
📌 Update Data Regularly
Schedule weekly or monthly updates to keep insights relevant. Outdated data reduces dashboard value.
📌 Use Slicers Strategically
Apply slicers thoughtfully to explore specific scenarios without overwhelming users.
📌 Review KPIs Periodically
Business priorities change over time. Therefore, review KPIs regularly to ensure alignment with goals.
📌 Train Users Briefly
Even though Excel feels familiar, a short walkthrough helps users get maximum value.
How Can This Dashboard Improve Retail Strategy?
A Department Stores Dashboard in Excel supports strategic planning by:
-
Identifying profitable regions and channels
-
Highlighting cost-heavy departments
-
Measuring promotion effectiveness
-
Tracking customer satisfaction trends
As a result, leadership teams can align operational actions with long-term business goals.
Who Can Benefit from a Department Stores Dashboard in Excel?
Click to Purchases Department Stores Dashboard in Excel
This dashboard suits a wide range of users, including:
-
Department store owners
-
Retail managers
-
Finance and operations teams
-
Marketing managers
-
Business analysts
Because of its flexibility, both small and large retail chains can use it effectively.
Conclusion: Why Choose a Department Stores Dashboard in Excel?
A Department Stores Dashboard in Excel transforms raw retail data into meaningful insights. It simplifies performance tracking, improves decision-making, and enhances operational efficiency.
Moreover, its structured design, interactive slicers, and clear visualizations make it easy to use and highly effective. Therefore, if you want better control over sales, costs, customers, and promotions, this dashboard becomes an essential tool.
Frequently Asked Questions About Department Stores Dashboard in Excel
❓ What is a Department Stores Dashboard in Excel used for?
It helps track sales, costs, customer satisfaction, promotions, and monthly trends in one interactive Excel file.
❓ Do I need advanced Excel skills to use this dashboard?
No. Basic Excel knowledge is enough to navigate slicers and update data.
❓ Can I customize the dashboard for my store?
Yes. You can modify charts, add KPIs, and adjust layouts based on your requirements.
❓ How often should I update the data?
You should update data weekly or monthly, depending on business needs.
❓ Is this dashboard suitable for multiple store locations?
Yes. The dashboard supports store-wise, region-wise, and department-wise analysis.
Visit our YouTube channel to learn step-by-step video tutorials
Click to Purchases Department Stores Dashboard in Excel
Watch the step-by-step video tutorial: