Running a machine learning lab requires constant tracking of experiments, models, data quality, costs, timelines, and outcomes. However, when teams store this information in scattered Excel files or disconnected tools, performance tracking becomes slow and unclear. As a result, decision-making often turns reactive instead of proactive.
That is exactly why a Machine Learning Labs KPI Dashboard in Power BI becomes a powerful solution. It converts raw Excel-based data into meaningful KPIs, interactive visuals, and real-time insights. Moreover, it helps ML leaders, data scientists, and operations teams stay aligned with targets and trends.
In this in-depth guide, you will learn what a Machine Learning Labs KPI Dashboard in Power BI is, how it works, its page-wise structure, advantages, best practices, and frequently asked questions. Additionally, you will clearly understand how a ready-to-use dashboard simplifies KPI monitoring and improves overall lab performance.
Click to Purchases Machine Learning Labs KPI Dashboard in Power BI
What Is a Machine Learning Labs KPI Dashboard in Power BI?
A Machine Learning Labs KPI Dashboard in Power BI is a centralized analytics tool designed to track and visualize key performance indicators related to machine learning operations. Instead of checking multiple spreadsheets or manual reports, teams can monitor all KPIs from one interactive Power BI file.
Because Power BI supports slicers, drill-through pages, and dynamic calculations, this dashboard helps labs compare MTD (Month-to-Date) and YTD (Year-to-Date) performance with targets and previous-year values. As a result, stakeholders gain instant clarity on what works and what needs improvement.
Moreover, this dashboard connects directly to an Excel data source. Therefore, teams can update data easily without touching the Power BI design.
Why Do Machine Learning Labs Need KPI Dashboards?
Machine learning labs deal with complex workflows. They manage data ingestion, model training, evaluation, deployment, and monitoring. However, without structured KPIs, teams struggle to measure success.
A KPI dashboard solves this problem because it:
-
Centralizes all performance metrics
-
Improves visibility across teams
-
Highlights gaps against targets
-
Tracks progress over time
-
Supports data-driven decisions
Furthermore, when leaders track KPIs visually, they respond faster to risks and opportunities.
Why Use Power BI for Machine Learning KPI Tracking?
Although many analytics tools exist, Power BI remains one of the most practical choices for ML KPI tracking. Let us understand why.
1. Seamless Excel Integration
Most ML labs already store KPI data in Excel. Power BI connects directly to Excel, which makes data updates simple and fast.
2. Interactive Visuals
Power BI supports slicers, cards, tables, and combo charts. Therefore, users can explore KPIs dynamically instead of viewing static reports.
3. Scalability
As the lab grows, Power BI handles increasing data volumes without redesigning the dashboard.
4. Business-Friendly Interface
Even non-technical stakeholders can understand Power BI visuals easily. As a result, communication improves across teams.
How Does the Machine Learning Labs KPI Dashboard in Power BI Work?
This dashboard follows a structured and logical flow. First, users update data in Excel. Then, Power BI refreshes visuals automatically.
Data Flow Overview
-
Update KPI values in Excel
-
Refresh Power BI dataset
-
Analyze KPIs using slicers and visuals
-
Drill through to detailed KPI definitions
Because of this flow, teams avoid manual calculations and reporting delays.
Page-Wise Structure of Machine Learning Labs KPI Dashboard in Power BI
This ready-to-use dashboard contains three structured pages, each designed for a specific purpose.
What Is Included in the Summary Page of the Dashboard?
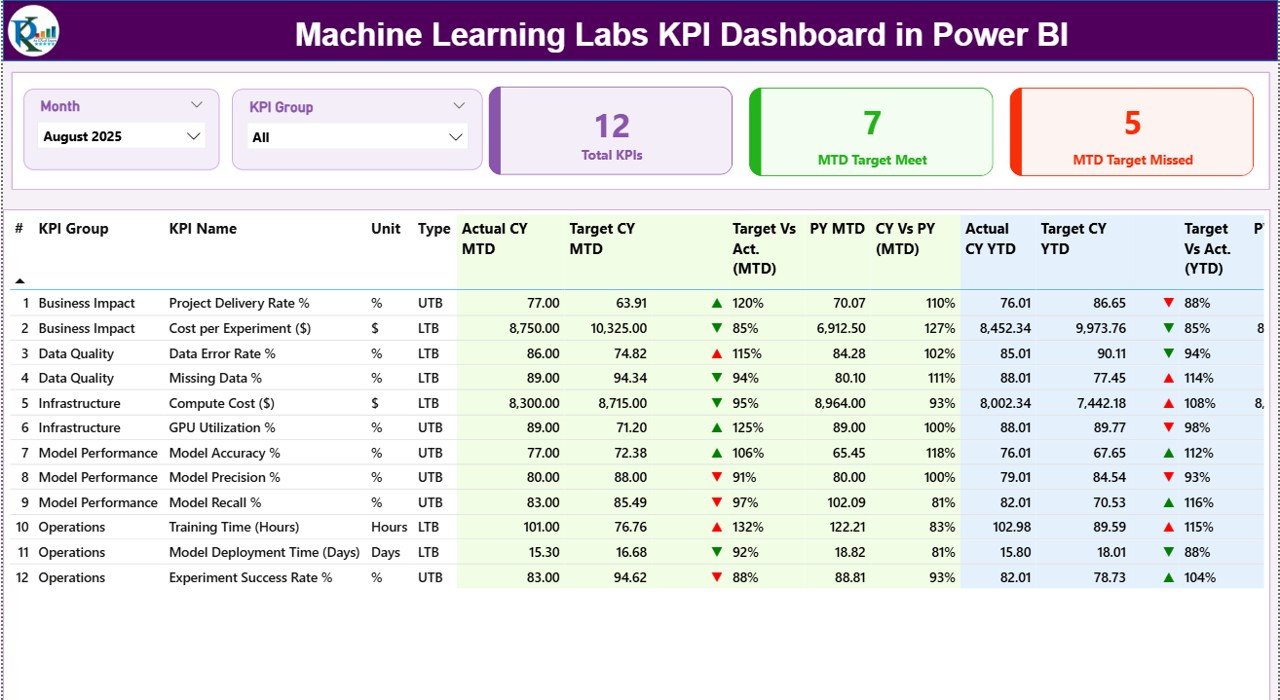
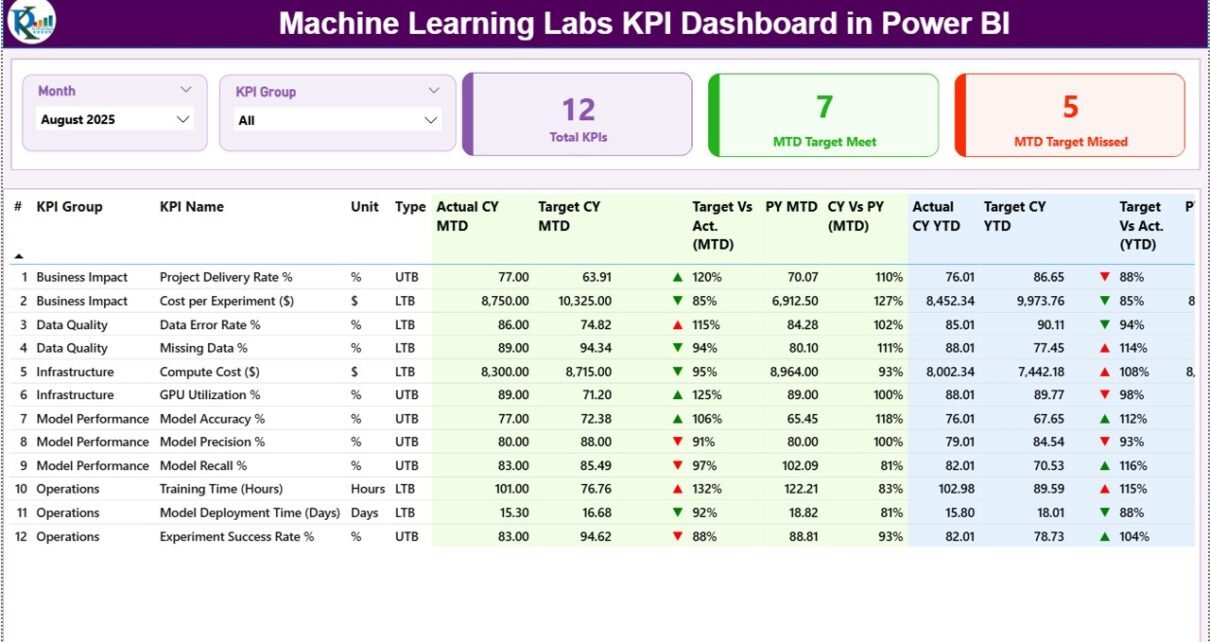
The Summary Page acts as the main control center of the dashboard. From this page, users get a complete overview of all KPIs.
Key Elements of the Summary Page
Slicers at the Top
-
Month Slicer: Filters KPIs by selected month
-
KPI Group Slicer: Filters KPIs by category
These slicers help users analyze specific time periods or KPI groups quickly.
KPI Cards
At the top, the dashboard displays three KPI cards:
-
Total KPIs Count
-
MTD Target Met Count
-
MTD Target Missed Count
These cards instantly show overall performance status.
Detailed KPI Table Explained
Below the cards, the dashboard displays a detailed KPI table with the following columns:
-
KPI Number: Sequential identifier for each KPI
-
KPI Group: Category or domain of the KPI
-
KPI Name: Name of the KPI
-
Unit: Measurement unit (%, Count, Hours, etc.)
-
Type: LTB (Lower the Better) or UTB (Upper the Better)
MTD Performance Metrics
-
Actual CY MTD: Current year actual MTD value
-
Target CY MTD: Target MTD value
-
MTD Icon: Red ▼ or Green ▲ to indicate target status
-
Target vs Actual (MTD): Actual ÷ Target
-
PY MTD: Previous year MTD value
-
CY vs PY (MTD): CY MTD ÷ PY MTD
YTD Performance Metrics
-
Actual CY YTD: Current year actual YTD value
-
Target CY YTD: Target YTD value
-
YTD Icon: Red ▼ or Green ▲ indicator
-
Target vs Actual (YTD): Actual ÷ Target
-
PY YTD: Previous year YTD value
-
CY vs PY (YTD): CY YTD ÷ PY YTD
Because of these metrics, users can compare performance across time and targets in one view.
Click to Purchases Machine Learning Labs KPI Dashboard in Power BI
What Is the KPI Trend Page Used For?

The KPI Trend Page focuses on performance trends instead of summary numbers.
Key Features of KPI Trend Page
-
KPI Name Slicer on the left
-
Two Combo Charts:
-
MTD trend chart
-
YTD trend chart
-
Each combo chart displays:
-
Current Year Actual
-
Previous Year Actual
-
Target values
Because of this design, users can quickly identify growth patterns, seasonality, and performance gaps.
What Is the Purpose of the KPI Definition Page?
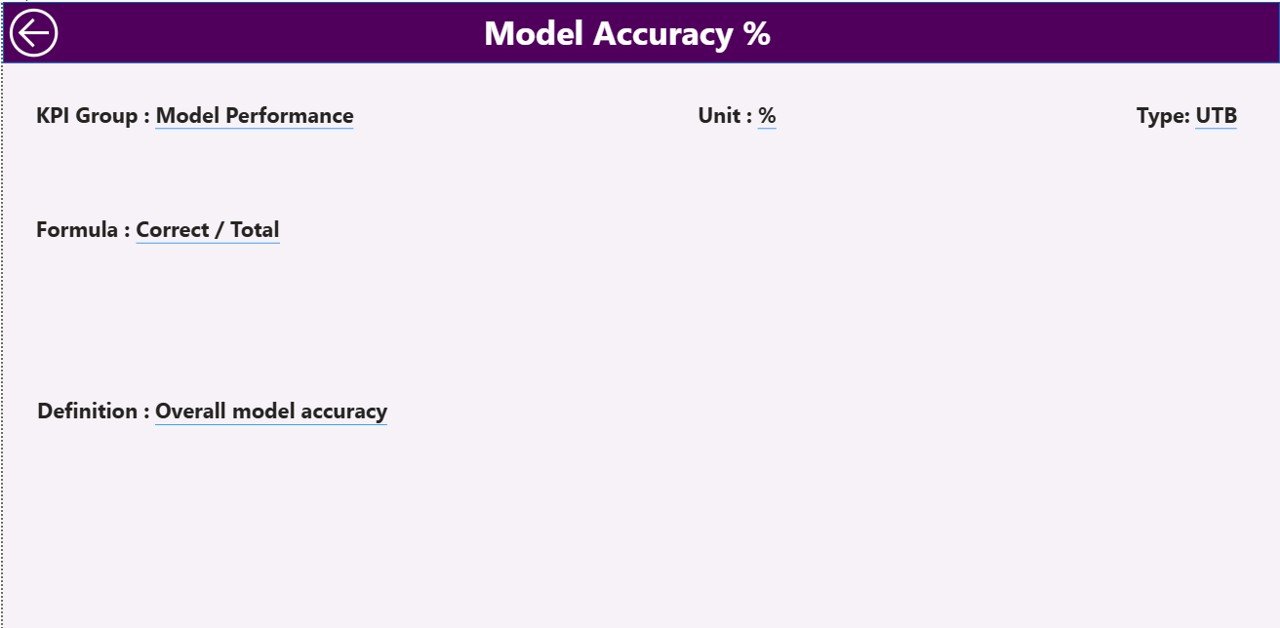
The KPI Definition Page acts as a reference and explanation layer.
Key Characteristics
-
Hidden drill-through page
-
Accessible from the Summary Page
-
Displays:
-
KPI Formula
-
KPI Definition
-
KPI Unit
-
KPI Type (LTB or UTB)
-
Users can return to the Summary Page using the Back button on the top-left corner. As a result, navigation remains smooth and intuitive.
What Excel Data Is Required for This Dashboard?
The dashboard uses Excel as its data source, which makes it easy to maintain.
Excel File Structure
The Excel file contains three worksheets.
1. Input_Actual Sheet
In this sheet, users enter actual KPI values.
Required columns:
-
KPI Name
-
Month (use first date of the month)
-
MTD Value
-
YTD Value
Teams update this sheet monthly.
2. Input_Target Sheet
This sheet stores target values.
Required columns:
-
KPI Name
-
Month (first date of the month)
-
MTD Target
-
YTD Target
Targets help measure success clearly.
3. KPI Definition Sheet
This sheet defines each KPI.
Required columns:
-
KPI Number
-
KPI Group
-
KPI Name
-
Unit
-
Formula
-
Definition
-
Type (LTB or UTB)
Because of this structure, KPI governance becomes consistent and transparent.
Advantages of Machine Learning Labs KPI Dashboard in Power BI
Using this dashboard delivers multiple benefits to ML teams.
Key Advantages
-
📊 Centralized KPI tracking
-
🚀 Faster decision-making
-
🎯 Clear target vs actual comparison
-
📈 Trend-based performance analysis
-
🔍 Easy drill-through to KPI definitions
-
🔄 Simple Excel-based data updates
-
👥 Improved collaboration across teams
As a result, labs gain better control over operations and outcomes.
Click to Purchases Machine Learning Labs KPI Dashboard in Power BI
Opportunities for Improvement in ML KPI Dashboards
Even the best dashboards can evolve.
Possible Enhancements
-
Add model-level KPIs
-
Include cost and infrastructure metrics
-
Integrate deployment success rates
-
Add automated refresh schedules
-
Include role-based access
These improvements increase dashboard maturity over time.
Best Practices for the Machine Learning Labs KPI Dashboard in Power BI
Following best practices ensures long-term success.
Recommended Best Practices
-
Define KPIs clearly before implementation
-
Use consistent KPI units and formulas
-
Separate actual and target data logically
-
Update Excel data regularly
-
Limit KPIs to actionable metrics
-
Review trends monthly, not just totals
-
Train stakeholders on dashboard usage
Because of these practices, teams maintain accuracy and trust.
Who Can Use This Dashboard?
This dashboard suits multiple roles.
Ideal Users
-
Machine Learning Managers
-
Data Science Leads
-
AI Research Teams
-
Analytics Managers
-
Technology Executives
Anyone responsible for ML performance can benefit.
How Does This Dashboard Improve Decision-Making?
The dashboard improves decisions by:
-
Highlighting underperforming KPIs
-
Showing trends instead of isolated values
-
Comparing performance against targets
-
Providing context through previous-year data
Therefore, leaders act based on facts, not assumptions.
How Is This Dashboard Different from Manual Reporting?
Manual reporting consumes time and increases errors. In contrast:
-
Power BI automates calculations
-
Visuals replace long tables
-
Slicers enable instant analysis
-
Drill-through replaces static documentation
As a result, productivity increases significantly.
Conclusion
A Machine Learning Labs KPI Dashboard in Power BI transforms how ML teams track performance. Instead of struggling with scattered Excel files and manual reports, teams gain a centralized, interactive, and insightful analytics solution.
This ready-to-use dashboard combines Excel-based data entry, Power BI visualization, and structured KPI logic. Moreover, it supports MTD, YTD, target, and previous-year analysis in one place.
If your machine learning lab aims to improve efficiency, transparency, and results, this dashboard becomes an essential tool.
Frequently Asked Questions (FAQs)
What is a Machine Learning KPI Dashboard in Power BI?
It is a Power BI dashboard that tracks machine learning performance metrics using KPIs, trends, and comparisons.
Can I update the dashboard without Power BI knowledge?
Yes. You only need to update Excel data and refresh the dashboard.
Does this dashboard support MTD and YTD analysis?
Yes. It includes both MTD and YTD actual, target, and previous-year metrics.
What does LTB and UTB mean in KPIs?
LTB means Lower the Better, while UTB means Upper the Better.
Can I add more KPIs later?
Yes. You can add KPIs by updating the Excel data and KPI definition sheet.
Is this dashboard suitable for large ML teams?
Yes. Power BI scales well for small and large teams alike.
Visit our YouTube channel to learn step-by-step video tutorials