Environmental, Social, and Governance (ESG) performance no longer stays optional. Instead, it directly shapes investor confidence, brand trust, regulatory compliance, and long-term sustainability. Because of this shift, organizations across industries now track ESG metrics with the same seriousness as financial KPIs. However, raw ESG data often stays scattered across systems, reports, and spreadsheets. As a result, leaders struggle to see the full picture.
That is exactly where an Environmental, Social, and Governance (ESG) Dashboard in Power BI becomes essential.
In this in-depth article, you will learn what an ESG Dashboard in Power BI is, why organizations need it, how it works, and how each dashboard page supports smarter ESG decision-making. Moreover, you will explore its advantages, best practices, opportunities for improvement, and frequently asked questions in a clear and practical way.
What Is an Environmental, Social, and Governance (ESG) Dashboard in Power BI?
An Environmental, Social, and Governance (ESG) Dashboard in Power BI is an interactive analytics solution that tracks, analyzes, and visualizes ESG performance metrics in one centralized view.
Instead of reviewing separate sustainability reports, HR records, compliance documents, and operational logs, organizations can monitor all ESG indicators through one dynamic dashboard. Consequently, leadership teams gain clarity, transparency, and confidence in ESG reporting.
Because this dashboard runs on Microsoft Power BI, users can slice data by region, industry, month, or category. Additionally, Power BI transforms complex ESG datasets into meaningful visuals that support fast and informed decisions.
Why Do Organizations Need an ESG Dashboard in Power BI?
Organizations face growing pressure from regulators, investors, customers, and employees to demonstrate responsible business practices. Therefore, ESG tracking must move beyond static annual reports.
An ESG Dashboard in Power BI helps because it:
- Centralizes ESG data across departments
- Improves transparency and accountability
- Supports regulatory and compliance reporting
- Enables continuous ESG performance monitoring
- Strengthens investor and stakeholder trust
Moreover, when ESG data becomes visible and measurable, organizations can take proactive actions instead of reacting too late.
How Does an ESG Dashboard in Power BI Work?
An ESG Dashboard in Power BI connects ESG-related data from multiple sources such as Excel files, databases, cloud systems, and sustainability platforms. After data integration, Power BI models the information and displays it through interactive visuals.
Because the dashboard updates dynamically, users can:
- Monitor real-time or periodic ESG performance
- Compare regions, industries, and time periods
- Identify risks and improvement areas quickly
- Share ESG insights across teams securely
As a result, ESG reporting becomes faster, clearer, and more reliable.
What Are the Key Pages in an ESG Dashboard in Power BI?
This ESG Dashboard includes 5 professionally designed pages, each serving a specific analytical purpose. Let us explore each page in detail.
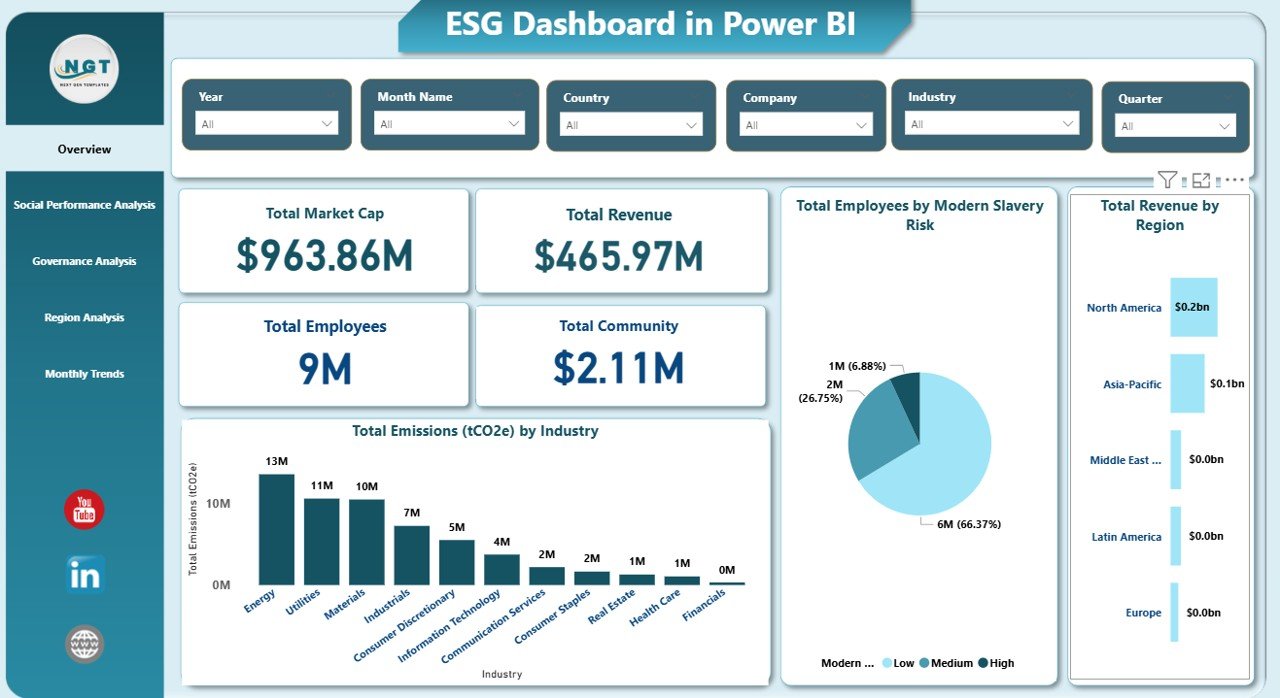
Overview Page: How Can Leaders See ESG Performance at a Glance?
The Overview page provides a high-level snapshot of ESG performance across the organization. Because leaders often need quick insights, this page focuses on critical summary metrics.
Key Metrics on the Overview Page
- Market Cap
Tracks overall company valuation, helping investors connect ESG performance with financial outcomes. - Revenue
Shows total revenue while enabling ESG-to-financial correlation analysis. - Employees
Displays workforce size, which supports social responsibility assessments. - Community Investment
Highlights investments in local communities, education, and social programs. - Total Emissions (tCO₂e) by Industry
Compares carbon emissions across industries to identify environmental impact hotspots. - Employees by Modern Slavery Risk
Helps organizations monitor labor risks across regions and supply chains. - Revenue by Region
Connects financial performance with regional ESG exposure.
Because all metrics appear on one screen, decision-makers immediately understand ESG health.
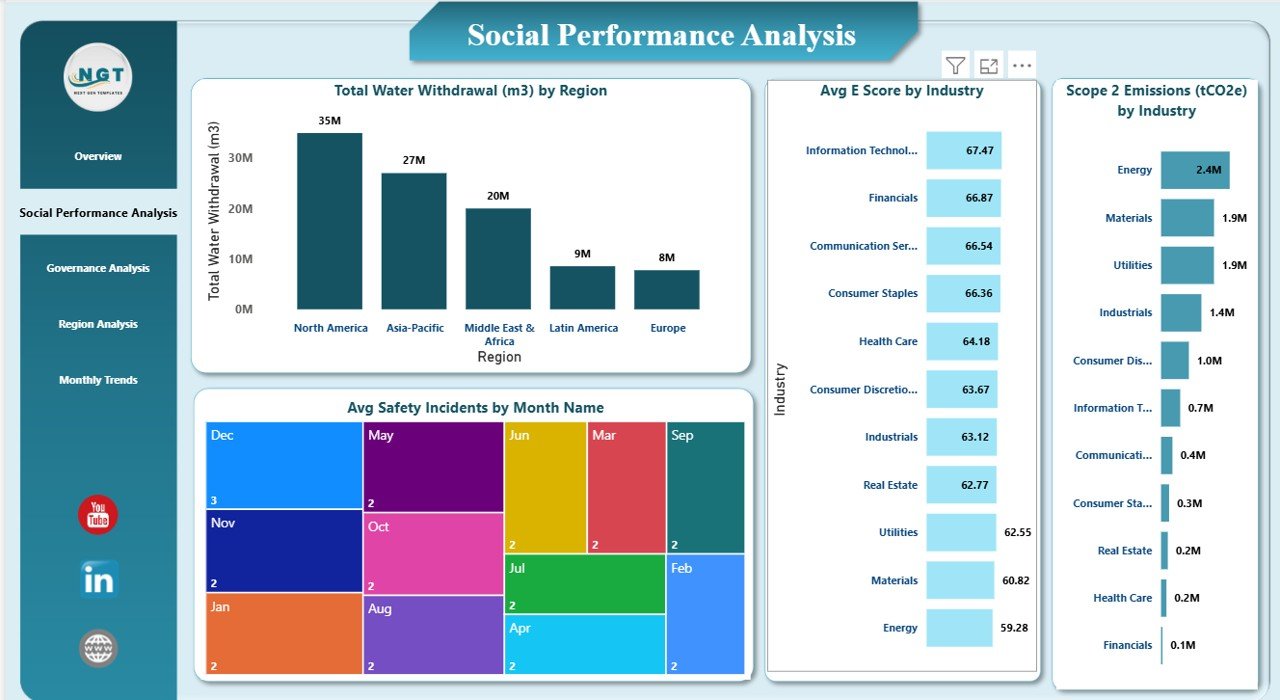
Social Performance Analysis: How Well Does the Organization Support People and Communities?
The Social Performance Analysis page focuses on employee safety, resource usage, and community-related indicators. Since social responsibility directly affects reputation and compliance, this page plays a critical role.
Key Visuals in Social Performance Analysis
- Water Withdrawal (m³) by Region
Tracks water usage to support sustainability and conservation initiatives. - Average Safety Incidents by Month
Highlights workplace safety trends and potential risk periods. - Average Environmental Score by Industry
Measures environmental efficiency and responsibility across industries. - Scope 1 Emissions (tCO₂e) by Industry
Shows direct emissions from owned or controlled sources.
Because these metrics update dynamically, ESG teams can identify risks early and take corrective actions quickly.
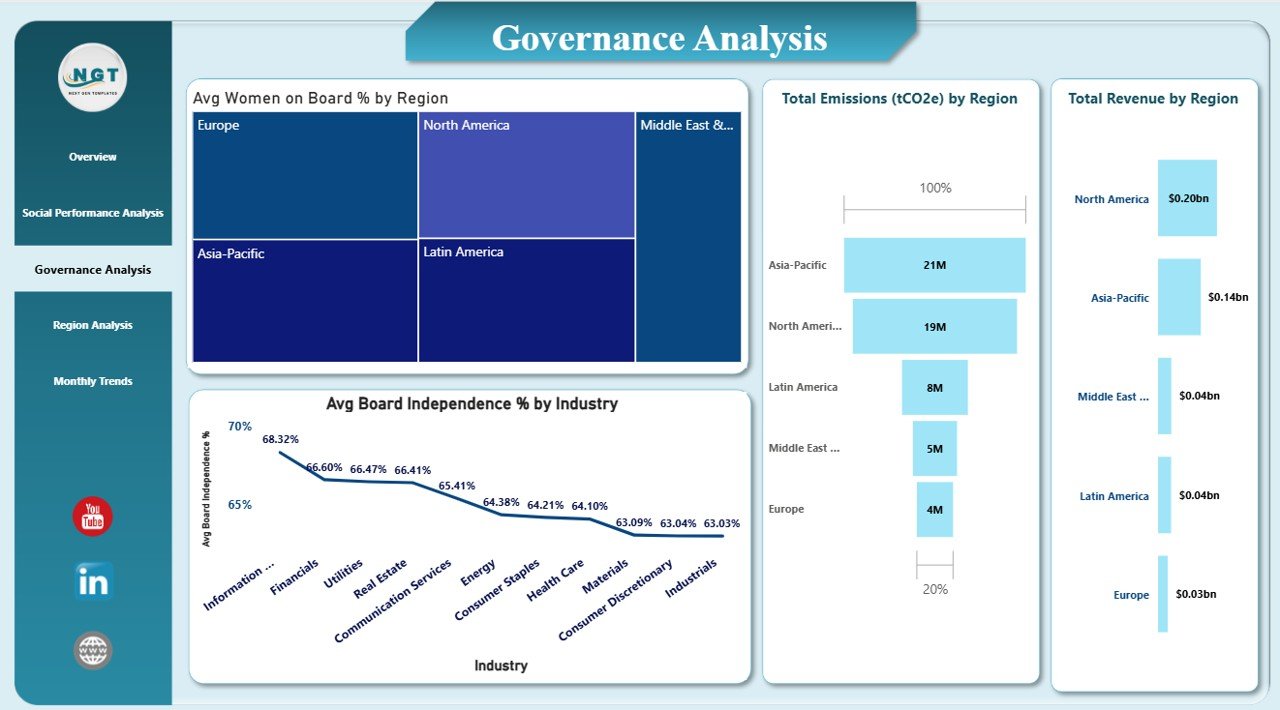
Governance Analysis: How Strong Is Corporate Governance Across the Organization?
Governance metrics directly reflect leadership quality, ethical standards, and decision-making integrity. Therefore, the Governance Analysis page focuses on board structure, independence, and accountability.
Key Governance Metrics
- Average Women on Board (%) by Region
Tracks gender diversity across leadership teams. - Revenue by Region
Helps analyze governance performance relative to business scale. - Total Emissions (tCO₂e) by Region
Connects governance oversight with environmental outcomes. - Average Board Independence (%) by Industry
Measures independence levels, which improve transparency and risk management.
With these insights, organizations can strengthen governance frameworks and meet regulatory expectations.
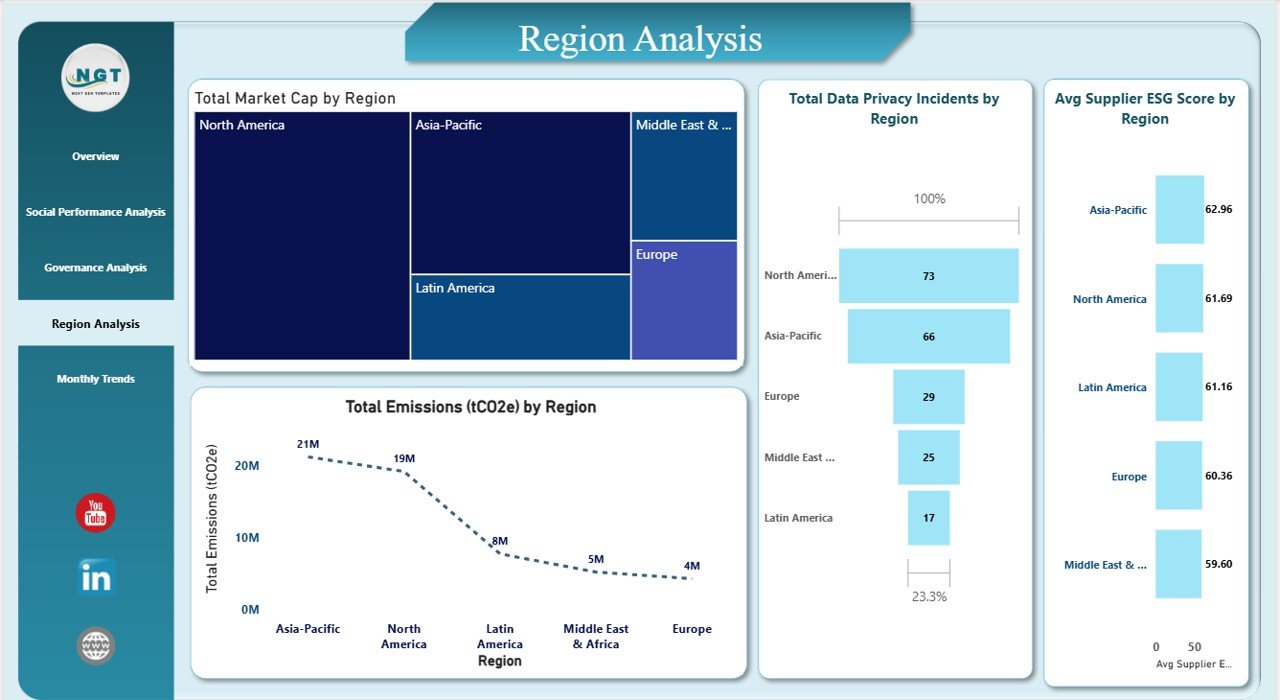
Region Analysis: How Does ESG Performance Vary Across Regions?
ESG risks and opportunities differ significantly by geography. Therefore, the Region Analysis page helps organizations understand location-based ESG performance.
Key Regional Indicators
- Market Cap by Region
Connects ESG exposure with regional business value. - Data Privacy Incidents by Region
Highlights cybersecurity and data governance risks. - Average Supplier ESG Score by Region
Evaluates supplier sustainability and compliance levels. - Total Emissions (tCO₂e) by Region
Identifies emission-heavy regions requiring targeted action.
Because regional insights matter for compliance and operations, this page supports localized ESG strategies.
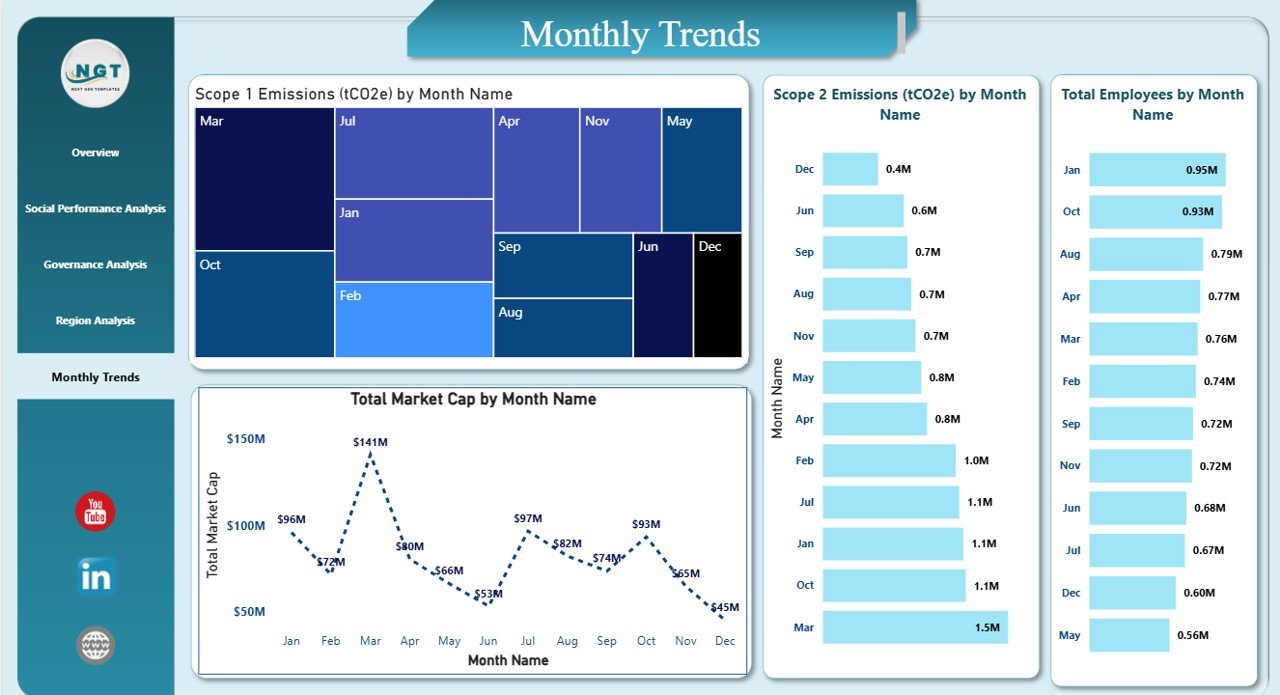
Monthly Trends: How Is ESG Performance Changing Over Time?
Trends reveal progress, risks, and seasonality. Therefore, the Monthly Trends page tracks ESG performance changes over time.
Monthly Trend Visuals
- Scope 1 Emissions (tCO₂e) by Month
Tracks direct emission trends. - Scope 2 Emissions (tCO₂e) by Month
Monitors indirect emissions from purchased energy. - Market Cap by Month
Shows financial growth alongside ESG trends. - Employees by Month
Tracks workforce changes and growth patterns.
Because trend analysis supports proactive planning, this page plays a key role in ESG forecasting.
Advantages of an Environmental, Social, and Governance (ESG) Dashboard in Power BI
An ESG Dashboard in Power BI delivers measurable benefits across the organization.
Key Advantages
- Centralized ESG Visibility
All ESG metrics stay accessible from one dashboard. - Improved Transparency
Clear visuals enhance trust with investors and stakeholders. - Better Decision-Making
Leaders act faster with real-time ESG insights. - Regulatory Readiness
Structured data supports audits and compliance reporting. - Scalable and Flexible
Power BI adapts easily as ESG requirements evolve.
Because ESG expectations continue to rise, these advantages provide a competitive edge.
Opportunities for Improvement in ESG Dashboards
Although ESG dashboards deliver strong value, organizations can further enhance them.
Improvement Opportunities
- Integrate real-time IoT and sensor data
- Add predictive ESG risk analytics
- Align metrics with global ESG frameworks
- Automate data quality checks
- Expand supplier ESG scoring models
By continuously refining the dashboard, organizations stay ahead of ESG challenges.
Best Practices for the Environmental, Social, and Governance (ESG) Dashboard in Power BI
Following best practices ensures long-term success and accuracy.
ESG Dashboard Best Practices
- Define Clear ESG KPIs
Select metrics aligned with business goals and regulations. - Standardize Data Sources
Maintain consistency across ESG inputs. - Use Interactive Filters
Enable region, industry, and time-based slicing. - Update Data Regularly
Keep ESG insights current and reliable. - Train Stakeholders
Ensure teams understand ESG metrics and visuals.
When organizations follow these practices, ESG dashboards deliver maximum impact.
How Does an ESG Dashboard Support Sustainability Goals?
An ESG Dashboard directly supports sustainability goals by making ESG performance measurable. As a result, organizations can:
- Reduce emissions proactively
- Improve workplace safety
- Strengthen governance structures
- Monitor supplier sustainability
- Track progress toward net-zero targets
Because sustainability depends on action, visibility through dashboards drives real change.
Conclusion: Why Is an ESG Dashboard in Power BI a Strategic Necessity?
Environmental, Social, and Governance performance now defines long-term business success. Without clear ESG visibility, organizations risk falling behind regulators, investors, and competitors.
An Environmental, Social, and Governance (ESG) Dashboard in Power BI transforms complex ESG data into clear, actionable insights. Moreover, it empowers leaders to monitor performance, manage risks, and demonstrate accountability with confidence.
As ESG expectations continue to grow, organizations that adopt advanced ESG dashboards position themselves for sustainable growth and lasting trust.
Frequently Asked Questions (FAQs)
What is an ESG Dashboard in Power BI?
An ESG Dashboard in Power BI is an interactive tool that visualizes environmental, social, and governance performance metrics in one centralized platform.
Who should use an ESG Dashboard?
Executives, sustainability teams, compliance officers, investors, and analysts benefit from ESG dashboards.
Can Power BI handle large ESG datasets?
Yes, Power BI efficiently manages large datasets and supports advanced ESG analytics.
How often should ESG data be updated?
Organizations should update ESG data monthly or quarterly, depending on reporting requirements.
Does an ESG Dashboard support regulatory compliance?
Yes, structured ESG dashboards simplify audits and regulatory reporting.
Can ESG dashboards integrate with existing systems?
Yes, Power BI connects easily with ERP, HR, finance, and sustainability systems.
Visit our YouTube channel to learn step-by-step video tutorials
Watch the step-by-step video tutorial: