Managing workplace incidents effectively plays a critical role in building a safe, compliant, and productive office environment. However, many organizations still rely on manual logs, emails, or disconnected spreadsheets to track incidents. As a result, response times increase, trends remain hidden, and decision-making becomes reactive.
That is exactly why an Office Incident Report Dashboard in Power BI becomes an essential analytics solution for modern organizations.
This comprehensive article explains what an Office Incident Report Dashboard in Power BI is, why organizations need it, how it works, dashboard pages, key features, advantages, best practices, and frequently asked questions. By the end, you will clearly understand how this dashboard transforms incident reporting into actionable safety insights.
Click to buy Office Incident Report Dashboard in Power BI
What Is an Office Incident Report Dashboard in Power BI?
An Office Incident Report Dashboard in Power BI is an interactive business intelligence solution designed to track, analyze, and visualize workplace incidents in a centralized and structured manner.
Instead of reviewing scattered incident forms or manual reports, safety managers and leadership teams use this dashboard to:
- Monitor total incidents across locations
- Analyze response and resolution times
- Track incident severity levels
- Identify high-risk areas and trends
- Improve workplace safety and compliance
Because Power BI offers dynamic visuals, slicers, and drill-down features, users can analyze incident data instantly and take corrective actions faster.
Why Do Organizations Need an Office Incident Report Dashboard?
Workplace incidents affect employee safety, operational continuity, and regulatory compliance. However, without clear visibility, organizations struggle to identify risks early.
An Office Incident Report Dashboard becomes essential because:
- Manual tracking delays incident resolution
- Hidden patterns increase future risks
- Leadership lacks real-time safety insights
- Compliance reporting consumes more time
- Decision-making becomes reactive instead of proactive
Therefore, organizations adopt Power BI dashboards to convert raw incident data into meaningful insights.
How Does an Office Incident Report Dashboard in Power BI Work?
The dashboard works by connecting structured incident data to Power BI and transforming it into interactive visuals.
Typical Data Inputs Include:
- Incident date and time
- Incident type
- Severity level
- Office location
- Reported by department
- Response time (hours)
- Resolution time (hours)
- Incident status
Once data flows into Power BI, the dashboard automatically calculates KPIs and updates visuals based on filters and slicers.
As a result, safety teams gain instant visibility into workplace incidents.
What Are the Key Pages in the Office Incident Report Dashboard in Power BI?
This dashboard contains five well-structured pages, each serving a specific analytical purpose.
Overview Page: How Can You Monitor Incidents at a Glance?
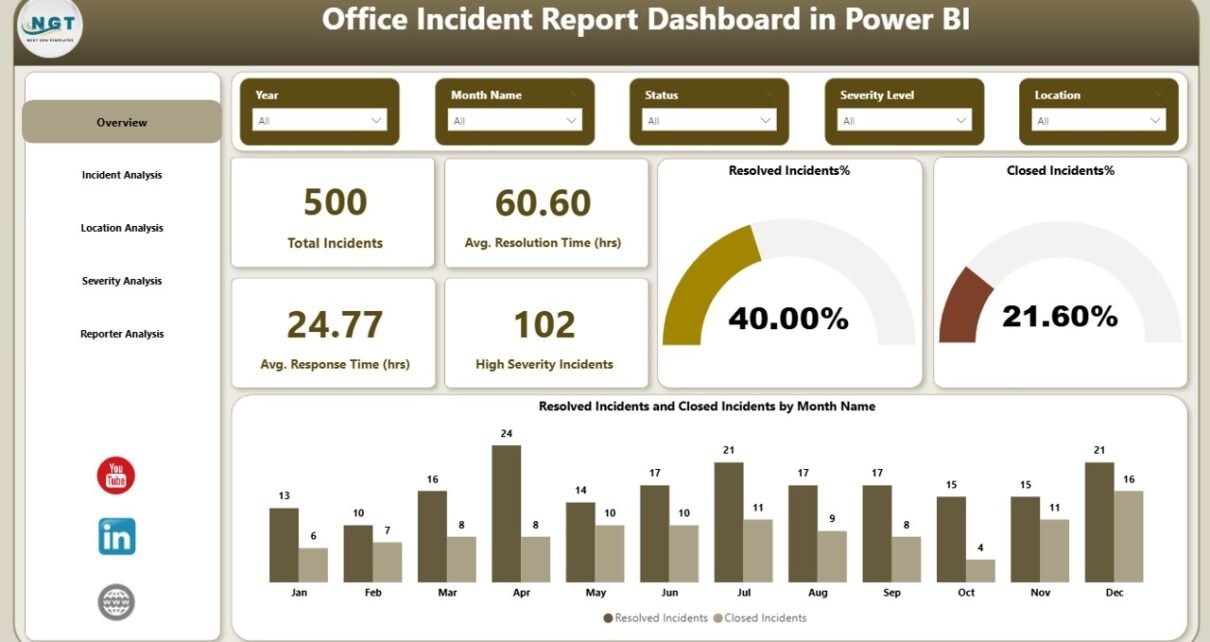
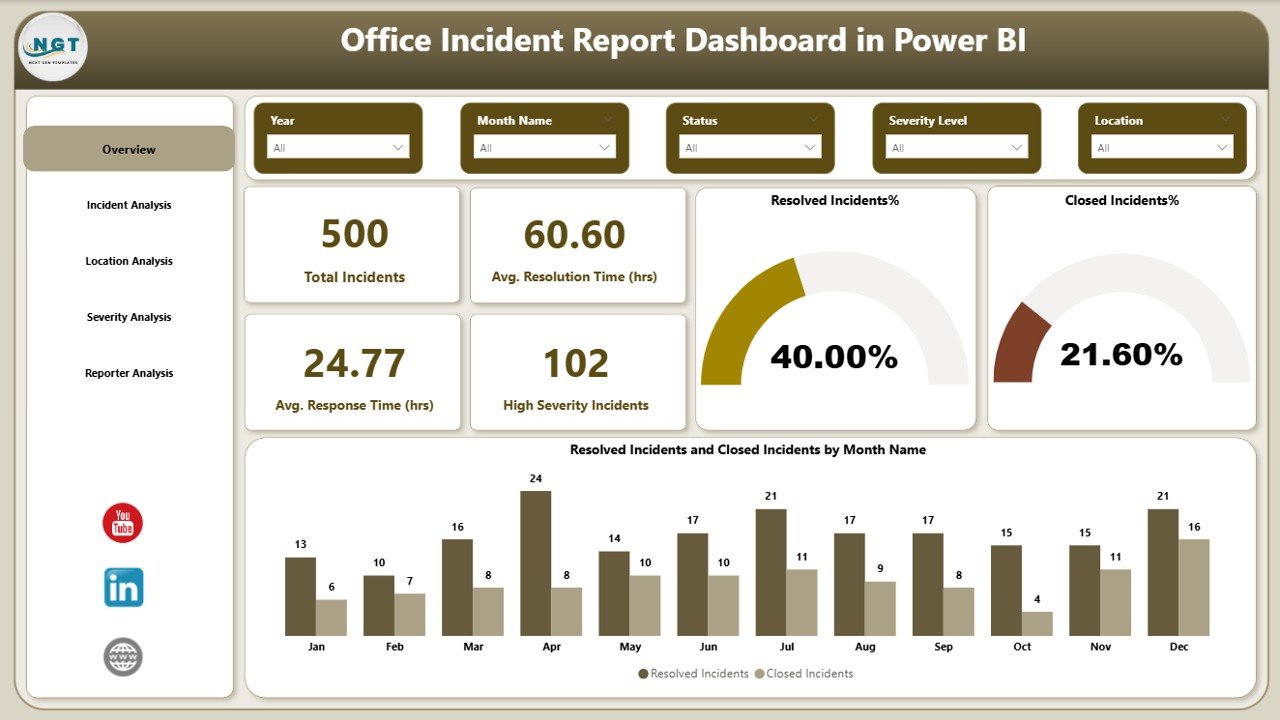
The Overview Page acts as the control center of the dashboard. It provides a quick snapshot of incident performance using high-level KPIs and summary visuals.
Key Highlights of the Overview Page:
- Interactive slicers for time, location, and severity
- Clear KPI cards for instant insights
KPI Cards Include:
- Total Incidents – Shows the total number of reported incidents
- Average Resolution Time (Hours) – Measures how quickly teams close incidents
- Average Response Time (Hours) – Tracks initial response efficiency
- High Severity Incidents – Highlights critical safety risks
Because this page shows everything at a glance, decision-makers can immediately assess the overall safety situation.
Click to buy Office Incident Report Dashboard in Power BI
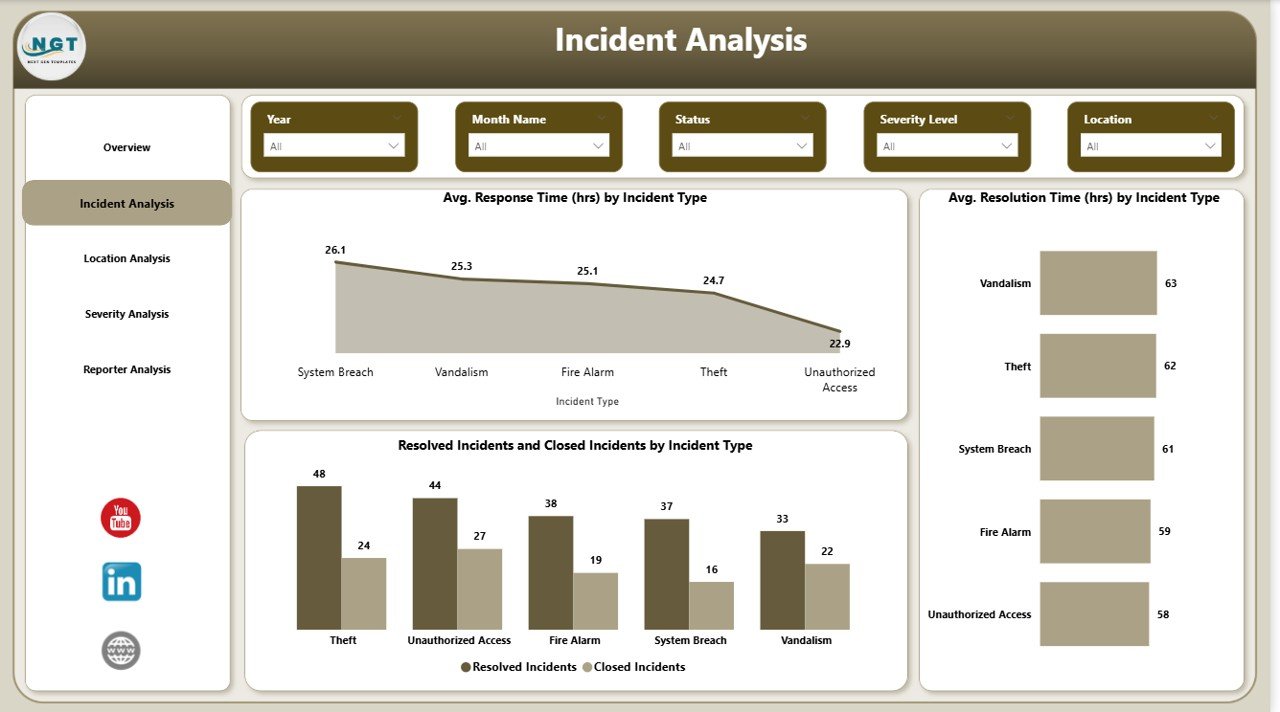
Incident Analysis Page: Which Incident Types Need Attention?
The Incident Analysis Page focuses on understanding incident behavior by type.
Key Visuals on This Page:
- Average Response Time (Hours) by Incident Type
- Average Resolution Time (Hours) by Incident Type
This analysis helps organizations identify:
- Incident types with slow responses
- Incidents that take longer to resolve
- Process gaps in incident handling
Consequently, safety teams can redesign workflows and improve response strategies.
Click to buy Office Incident Report Dashboard in Power BI
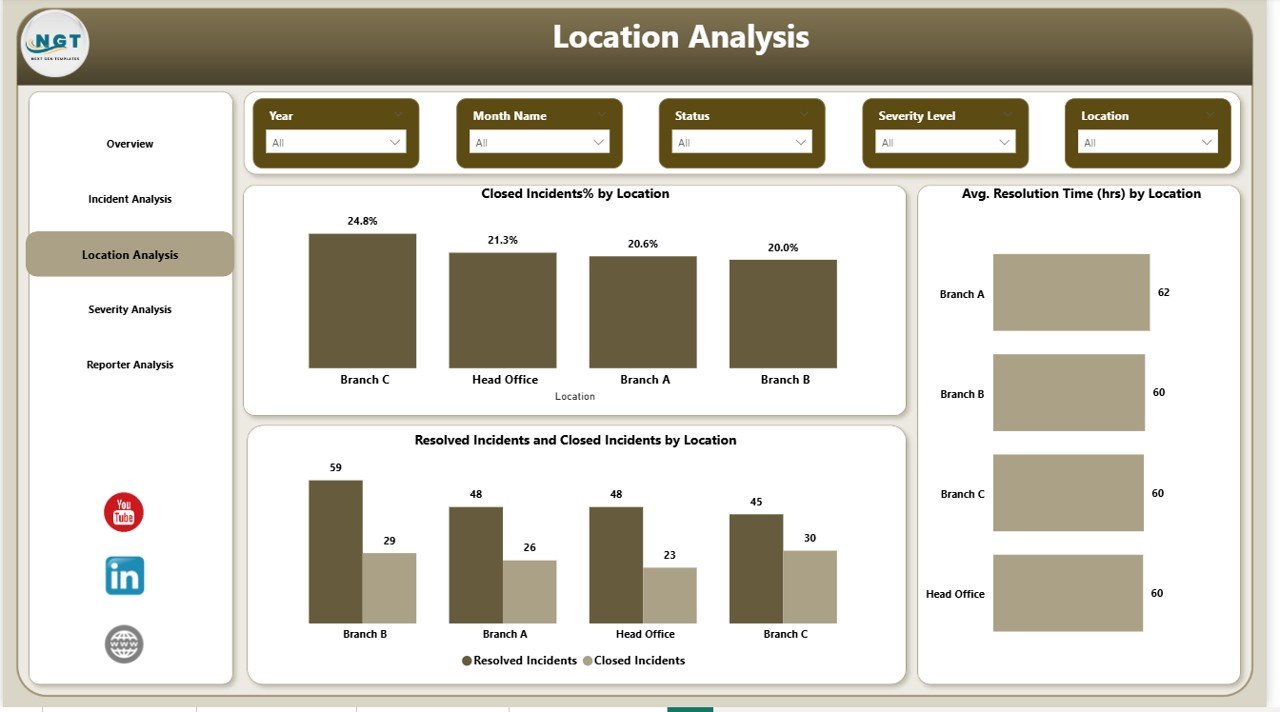
Location Analysis Page: Which Office Locations Are High Risk?
Workplace risks vary across locations. Therefore, the Location Analysis Page helps organizations compare safety performance across offices.
Key Charts Include:
- Closed Incidents % by Location
- Resolved vs Closed Incidents by Location
- Average Resolution Time (Hours) by Location
This page allows managers to:
- Identify high-risk office locations
- Compare resolution efficiency
- Allocate safety resources effectively
As a result, organizations can prioritize locations that need immediate attention.
Click to buy Office Incident Report Dashboard in Power BI
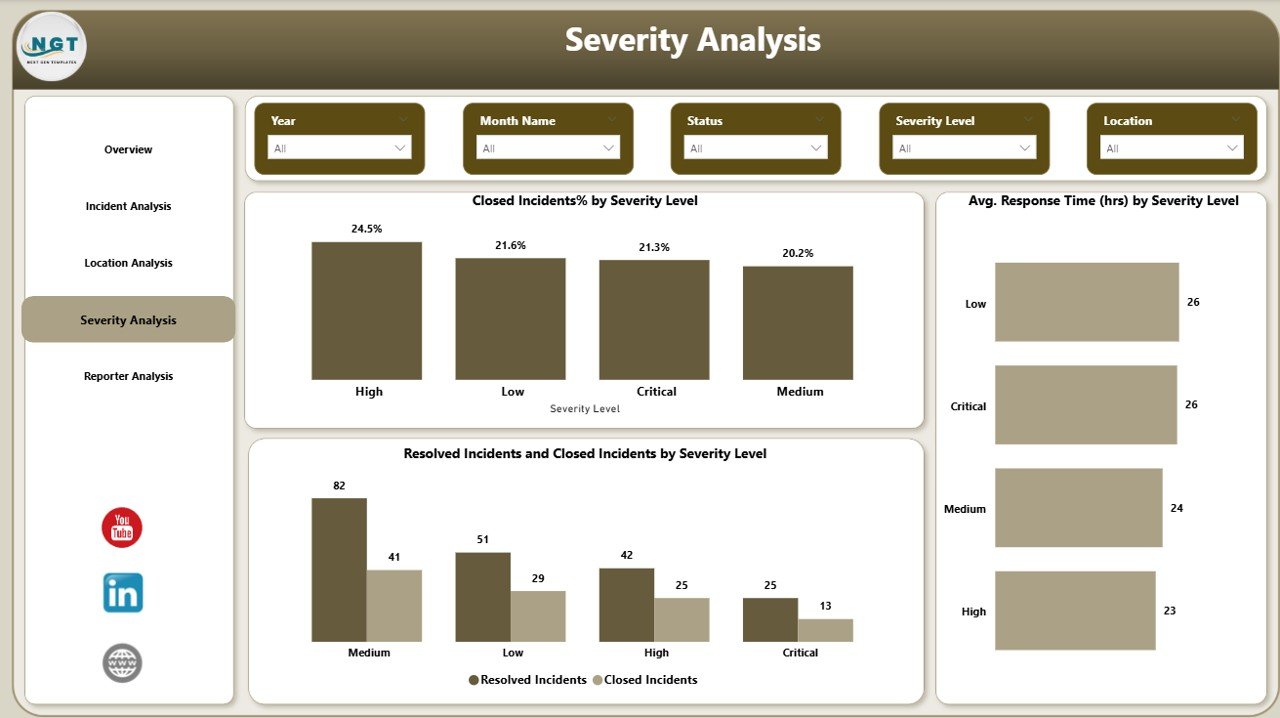
Severity Analysis Page: How Serious Are Workplace Incidents?
Not all incidents carry the same level of risk. Therefore, the Severity Analysis Page focuses on incident criticality.
Key Insights on This Page:
- Closed Incidents % by Severity Level
- Average Response Time (Hours) by Severity
This page helps safety managers ensure that:
- High-severity incidents receive faster responses
- Critical risks get immediate escalation
- Safety policies align with incident severity
Because of this analysis, organizations improve compliance and risk management.
Click to buy Office Incident Report Dashboard in Power BI
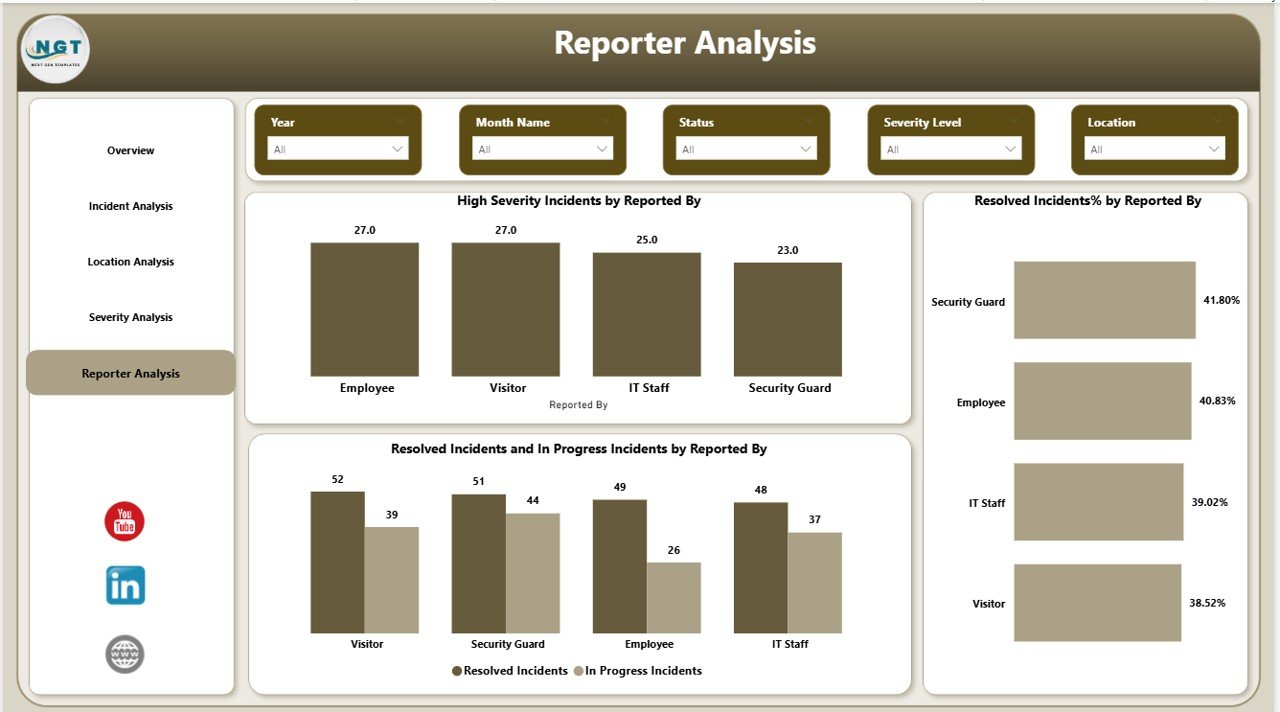
Monthly Trends Page: Are Incident Patterns Improving Over Time?
The Monthly Trends Page analyzes incident performance over time.
Key Visuals Include:
- Resolved vs In-Progress Incidents by Reported By
- High Severity Incidents by Reported By
- Resolved Incidents % by Reported By
This page helps organizations:
- Track long-term safety improvements
- Monitor reporting behavior
- Identify departments with recurring incidents
Therefore, leadership teams can measure the impact of safety initiatives accurately.
Click to buy Office Incident Report Dashboard in Power BI
What Are the Key Features of the Office Incident Report Dashboard in Power BI?
This dashboard includes powerful features that enhance usability and decision-making.
Key Features:
- Interactive slicers for deep analysis
- Dynamic KPI cards
- Automated calculations
- Clean and professional visuals
- Drill-down and filtering capabilities
- Real-time data refresh support
Together, these features create a robust safety analytics solution.
Advantages of Office Incident Report Dashboard in Power BI
Organizations experience multiple benefits after implementing this dashboard.
- Improves Workplace Safety
Clear visibility helps teams identify risks early and prevent future incidents.
- Reduces Response and Resolution Time
Teams act faster because data highlights problem areas instantly.
- Enhances Compliance and Reporting
The dashboard simplifies audits and regulatory reporting.
- Enables Data-Driven Decisions
Leadership relies on insights instead of assumptions.
- Saves Time and Effort
Automation eliminates manual reporting and follow-ups.
Who Can Use an Office Incident Report Dashboard?
This dashboard benefits multiple roles across an organization.
Ideal Users Include:
- Safety officers
- HR teams
- Facility managers
- Compliance managers
- Operations leaders
- Senior management
Each role gains tailored insights through filters and visuals.
Best Practices for the Office Incident Report Dashboard in Power BI
Following best practices ensures maximum value from the dashboard.
- Standardize Incident Data
Use consistent incident categories, severity levels, and locations.
- Update Data Regularly
Schedule frequent data refreshes to maintain accuracy.
- Focus on Key KPIs
Track response time, resolution time, and severity trends consistently.
- Train Users Properly
Ensure teams understand slicers, filters, and visuals.
- Review Trends Periodically
Use monthly and quarterly reviews to track improvement.
- Act on Insights Quickly
Convert insights into preventive actions and safety policies.
How Does This Dashboard Improve Decision-Making?
This dashboard empowers leaders to:
- Identify safety risks proactively
- Allocate resources efficiently
- Improve incident response workflows
- Strengthen safety culture
Because decisions rely on data, organizations achieve better safety outcomes.
What Makes Power BI Ideal for Incident Reporting?
Power BI stands out because it offers:
- Interactive analytics
- Scalable data models
- Secure access control
- Seamless Excel integration
- Enterprise-grade reporting
Therefore, it serves as a perfect platform for incident management analytics.
Conclusion: Why Should You Use an Office Incident Report Dashboard in Power BI?
An Office Incident Report Dashboard in Power BI transforms raw incident records into powerful safety intelligence. Instead of reacting to incidents, organizations gain the ability to predict risks, optimize responses, and improve workplace safety continuously.
With structured pages, actionable KPIs, and interactive visuals, this dashboard supports smarter decisions, faster responses, and stronger compliance. As a result, organizations build safer and more resilient workplaces.
Frequently Asked Questions (FAQs)
What is an Office Incident Report Dashboard in Power BI?
It is an interactive dashboard that tracks, analyzes, and visualizes workplace incidents using Power BI.
Who should use this dashboard?
Safety managers, HR teams, facility managers, compliance officers, and leadership teams can use it.
What data does the dashboard require?
It requires incident date, type, severity, location, response time, resolution time, and status.
Can the dashboard handle multiple office locations?
Yes, it supports multi-location analysis using slicers and filters.
Does the dashboard support trend analysis?
Yes, the Monthly Trends page tracks incident patterns over time.
How does the dashboard improve safety?
It highlights risks early, reduces response time, and supports preventive actions.
Can this dashboard integrate with Excel data?
Yes, Power BI integrates seamlessly with Excel incident logs.
Visit our YouTube channel to learn step-by-step video tutorials
Watch the step-by-step video tutorial:
Click to buy Office Incident Report Dashboard in Power BI