Photography studios create a surprising amount of business data: bookings, package types, material cost, labor cost, payment status, lead source, photographer, studio location, and customer rating. A studio with 25 bookings per month creates 300 booking records a year, and those rows can hide the real story if they stay in a plain data table. The Photography Studios Dashboard in Excel turns that booking data into a 7-sheet Excel reporting system with 5 KPI cards, 16 charts, multiple slicers, a Data sheet, and a Support sheet for pivot-powered refreshes.
This dashboard is built for studio owners and operations teams who want to review booking value, profit, cost, service mix, photographer performance, and payment health without paying for a full CRM. You can add your own data, click Refresh All from the Excel Data ribbon, and review the dashboard pages with ready-made visual analysis. Microsoft also documents the standard workflow for refreshing pivot-based reports in Excel here: refresh PivotTable data.
Click to purchase Photography Studios Dashboard in Excel
Key Features of Photography Studios Dashboard in Excel
5 KPI cards on the Overview page: Total Booking Value, Net Gross Profit, Total Bookings, Completed Bookings, and Avg. Rating give you the main studio health indicators before you inspect any chart.
16 ready-made charts: The workbook analyzes booking value, profit margin, ratings, material cost, payment status, lead source, package, photographer, service type, studio, city, region, and labor cost.
Multiple slicers: Slicers let you filter pages quickly and review a focused slice of the dashboard without rebuilding formulas or pivot tables.
Data sheet for your own records: The Data sheet gives you a consistent format for adding booking records. Once your rows follow the same structure, the workbook can update around your studio data.
Support sheet for dynamic reporting: The Support sheet contains pivot tables used to create the dashboard dynamically. You can keep it hidden during normal use and refresh it after updating the data.
Dashboard Pages Explanation
1. Overview Page
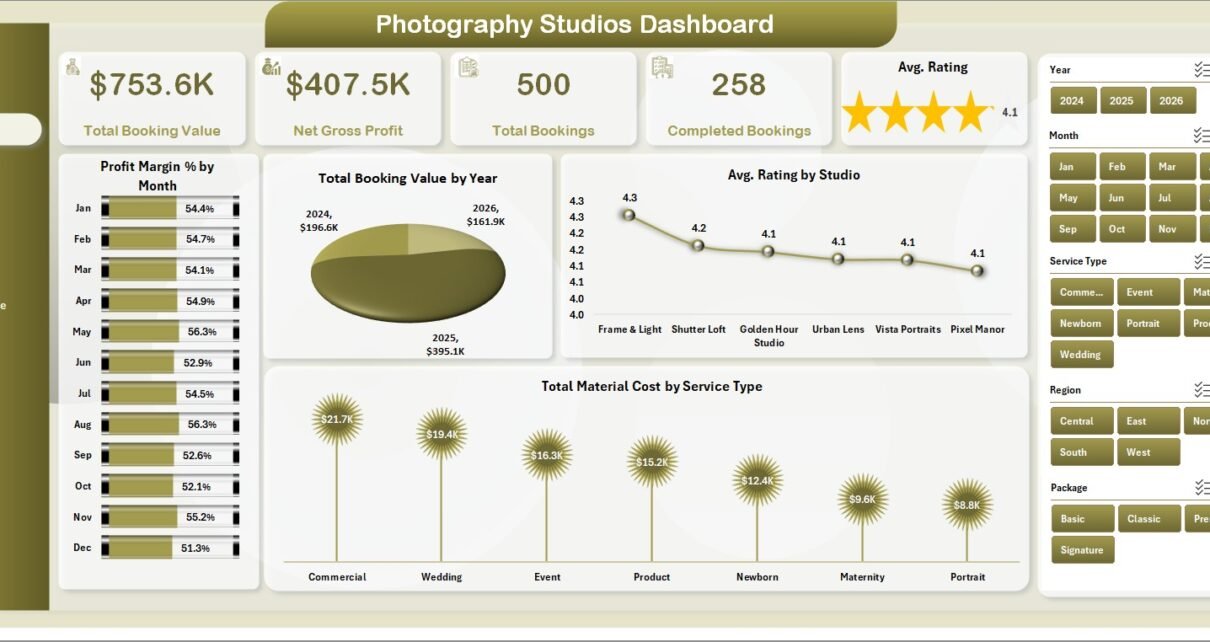
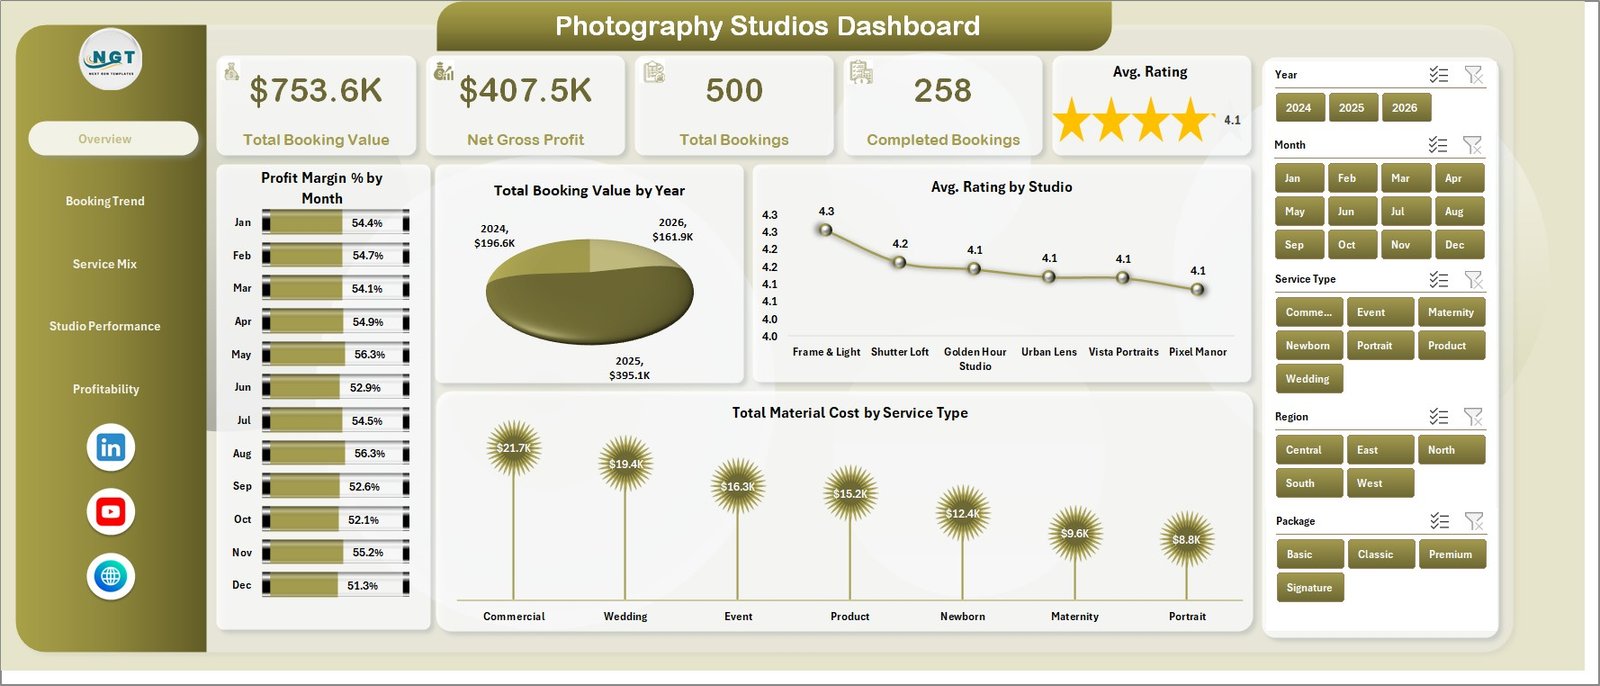
The Overview page is the executive summary of the Photography Studios Dashboard in Excel. At the top, the dashboard shows Total Booking Value, Net Gross Profit, Total Bookings, Completed Bookings, and Avg. Rating. These cards help you see revenue, profit, booking volume, completion status, and customer satisfaction in one place.
Profit Margin % by Month: This chart shows monthly margin movement and helps you see whether profitable months are increasing or declining. It is useful when booking volume is high but net profit is not moving at the same pace.
Total Booking Value by Year: This chart compares annual booking value, making it easy to review year-over-year growth. It helps owners see whether the studio is scaling or flattening over time.
Avg. Rating by Studio: This view compares customer ratings across studio locations. It helps identify which locations deliver the strongest client experience and where coaching may be needed.
Total Material Cost by Service Type: This chart shows the service types that consume the most material cost. It supports cost control, package pricing, and service profitability review.
Photography Studios Dashboard in Excel
2. Booking Trend
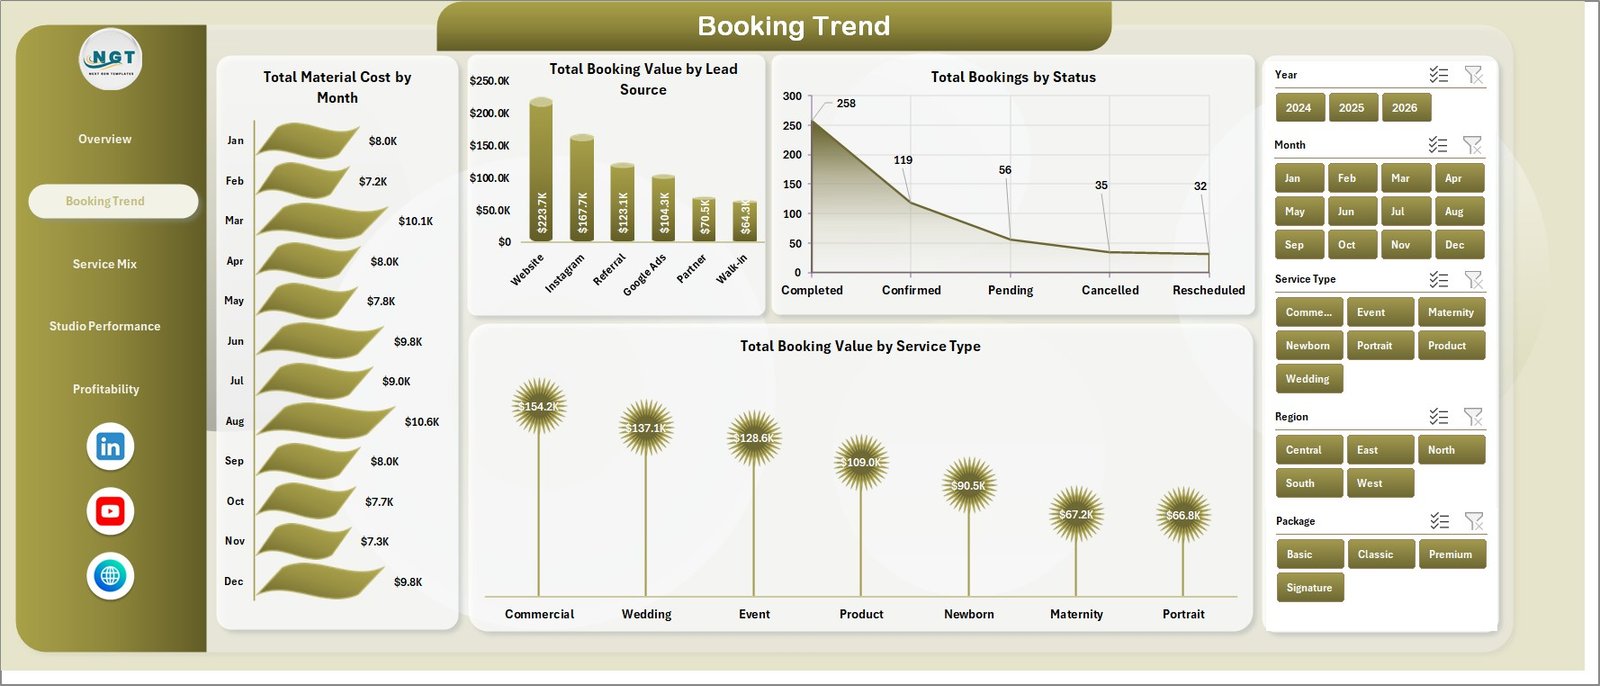
The Booking Trend sheet focuses on demand, booking value, cost movement, lead source performance, and booking status. It helps answer where bookings come from and how they are progressing.
Total Material Cost by Month: This chart tracks how material cost changes month by month. It can highlight seasonal cost pressure from albums, prints, props, editing resources, or other production expenses.
Total Booking Value by Lead Source: This chart shows which channels generate the most booking value. It helps decide whether referrals, ads, social media, walk-ins, or website leads deserve more attention.
Total Bookings by Status: This chart breaks booking count by status, such as completed, pending, cancelled, or other workflow stages. It gives a quick view of booking pipeline health.
Total Booking Value by Service Type: This chart compares the revenue contribution of each photography service. It helps identify which services are most commercially important.
Booking Trend
3. Service Mix
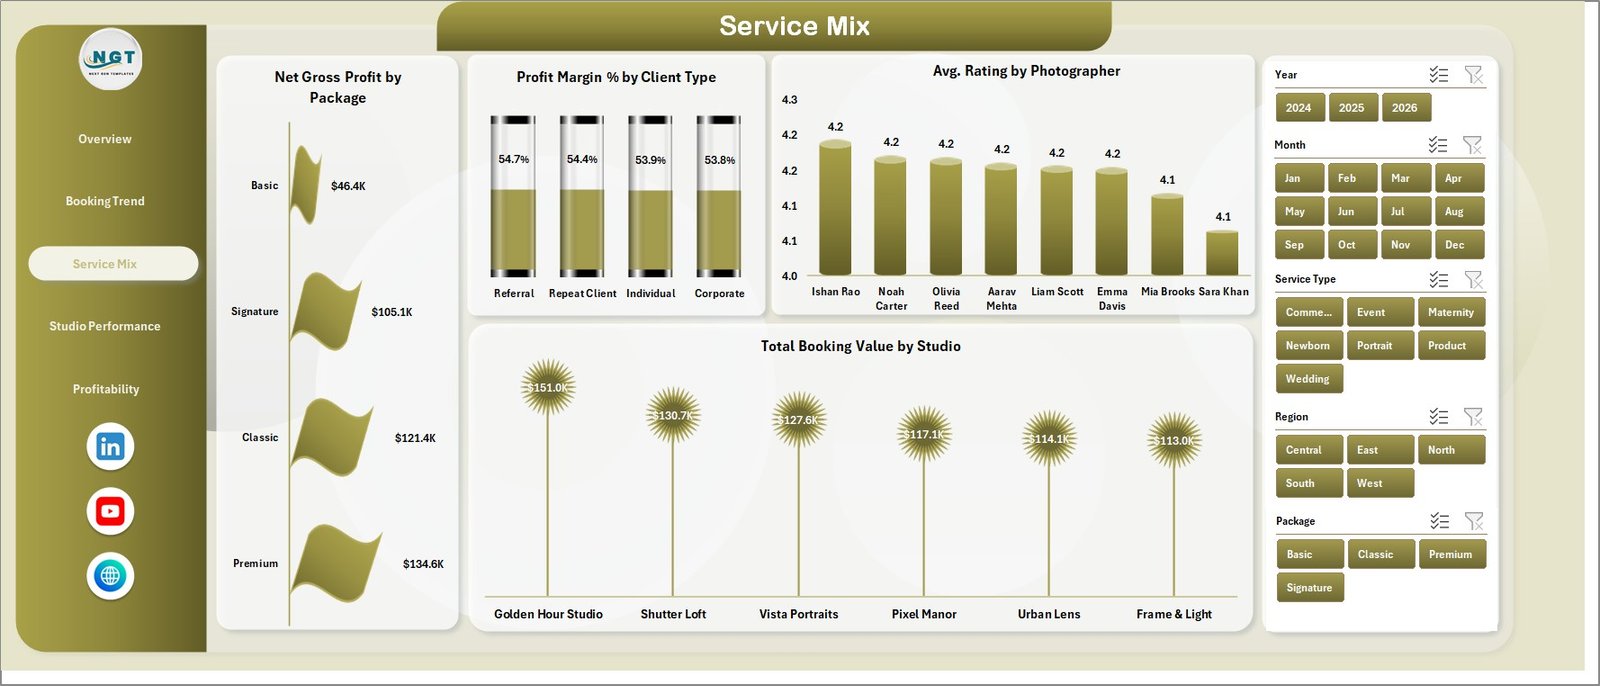
The Service Mix sheet helps you understand packages, client types, photographer ratings, and studio-level booking value. It is designed for reviewing what you sell and who delivers it.
Net Gross Profit by Package: This chart compares profit contribution by package. It helps identify which packages should be promoted, repriced, or simplified.
Profit Margin % by Client Type: This chart compares margins across client types. It helps reveal whether corporate, event, wedding, individual, or other client segments are more profitable.
Avg. Rating by Photographer: This chart compares customer ratings by photographer. It is useful for quality review, coaching, scheduling, and recognition.
Total Booking Value by Studio: This chart compares booking value across studios. It supports location-level planning and resource allocation.
Service Mix
4. Studio Performance
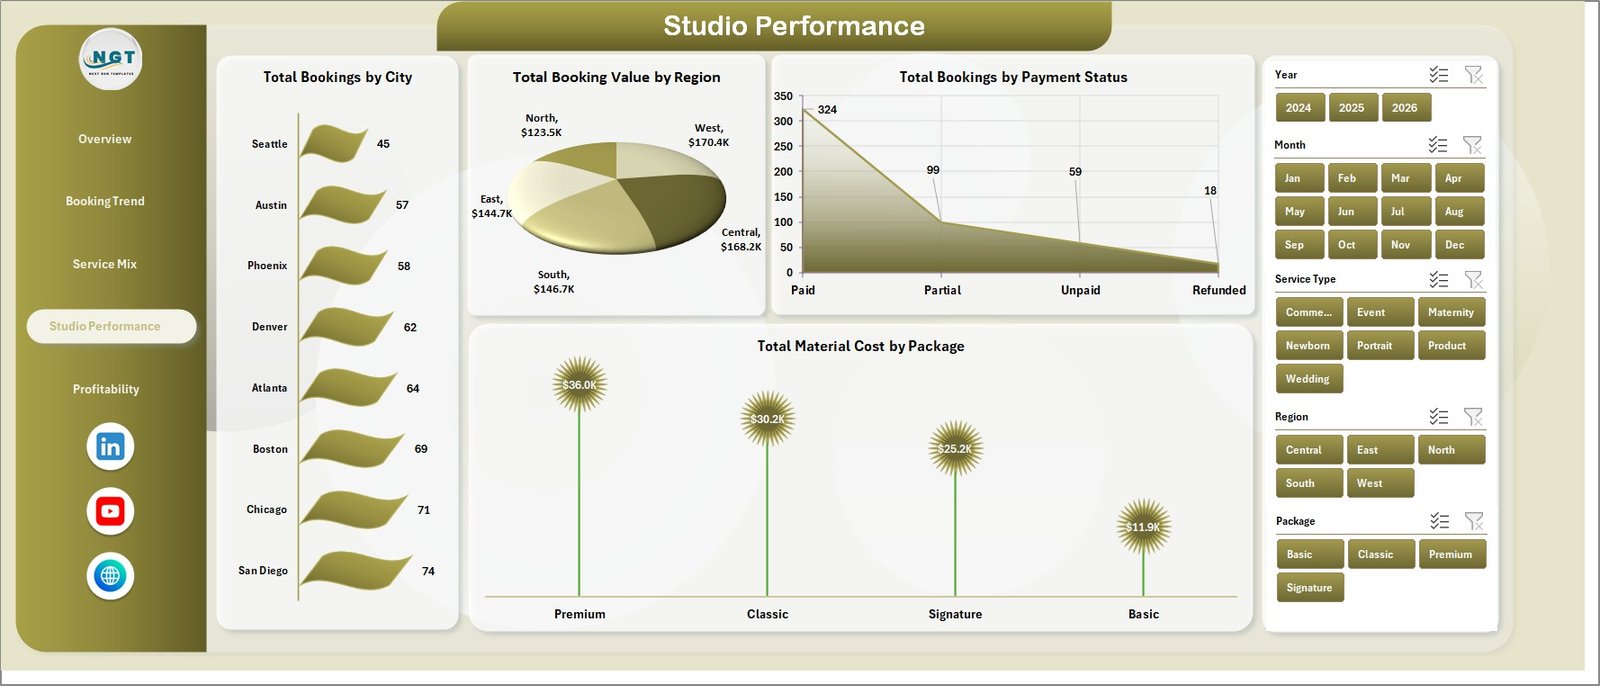
The Studio Performance sheet brings location, payment, and package-cost analysis into one page. It helps owners compare where work is happening and how well bookings convert into paid business.
Total Bookings by City: This chart shows booking volume by city. It helps identify active local markets and plan staffing, travel, and regional campaigns.
Total Booking Value by Region: This chart compares booking value by region. It gives a wider territory view for strategic planning.
Total Bookings by Payment Status: This chart shows paid, pending, partial, unpaid, or other payment groups. It helps teams monitor collections and follow-up priorities.
Total Material Cost by Package: This chart compares package-level material cost. It helps spot packages that may be costly to deliver relative to booking value.
Studio Performance
5. Profitability
The Profitability sheet focuses on margin quality, paid booking quality, photographer-level profit, and labor cost movement. It is the page to review when you want to know whether growth is translating into better profit.
Profit Margin % by Service Type: This chart compares margin by service type. It helps you see which services are actually profitable, not just popular.
Paid Booking % by Lead Source: This chart shows which lead sources convert into paid bookings most reliably. It helps evaluate lead quality and campaign performance.
Net Gross Profit by Photographer: This chart compares profit contribution by photographer. It supports scheduling, incentive, and coaching decisions.
Total Labor Cost by Month: This chart tracks labor cost trends across months. It helps identify staffing pressure during busy seasons and evaluate labor planning.
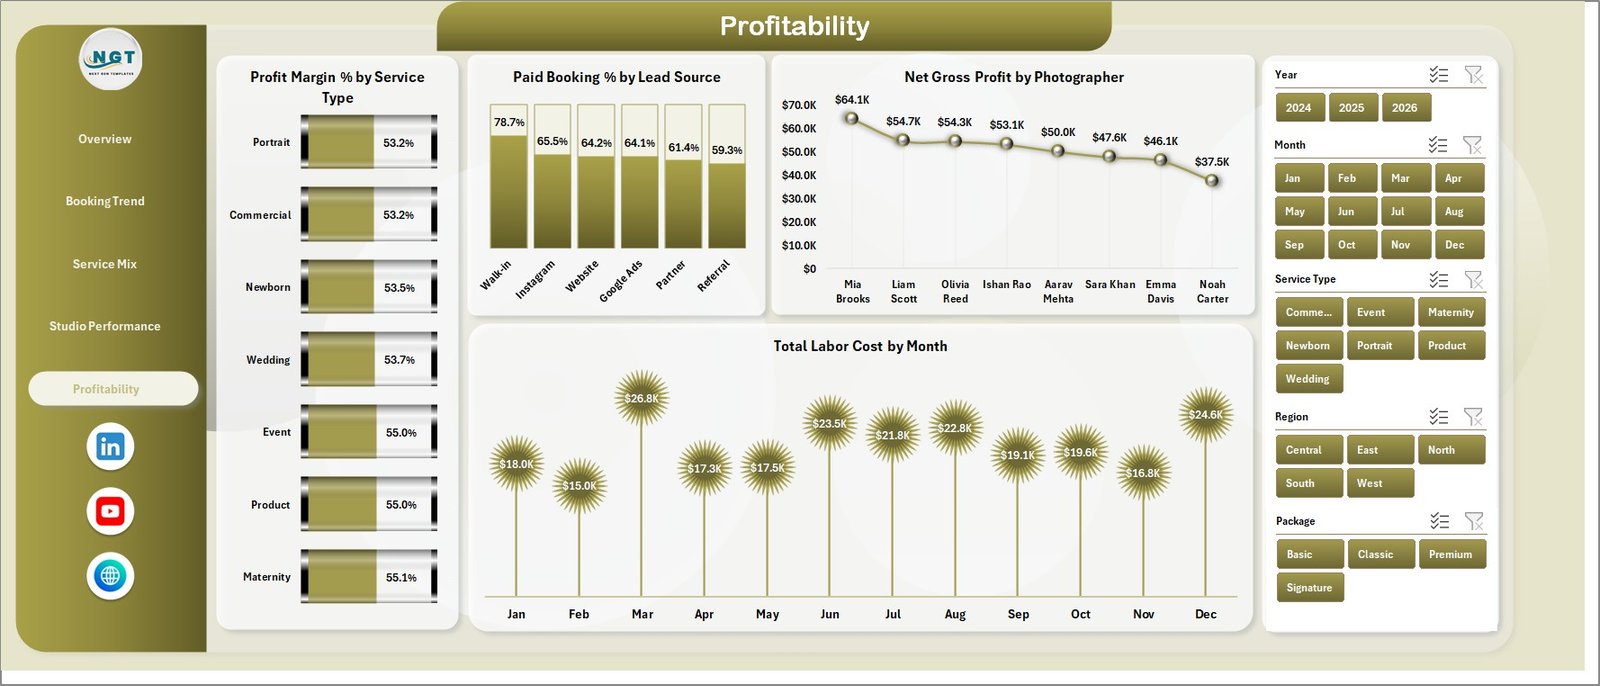
Profitability
6. Data Sheet Tab
The Data sheet is where you add records in the same format provided in the template. This structure keeps the dashboard consistent and helps the pivot tables read your data correctly after every update.

Data Sheet tab
7. Support Sheet Tab
The Support sheet contains multiple pivot tables used to create the dynamic dashboard. After updating the Data sheet, go to the Data tab in the Excel Ribbon and click Refresh All. The pivots and charts will refresh, and this sheet can stay hidden for normal use.

Support sheet tab
Photography Studios Dashboard in Excel vs. Google Sheets vs. Paid CRM/SaaS – Feature Comparison
| Feature | Photography Studios Dashboard in Excel | Google Sheets Dashboard | Paid CRM/SaaS |
|---|---|---|---|
| Cost | $17.99 one-time | One-time or free template | Monthly subscription |
| Platform | Microsoft Excel | Browser-based Google Sheets | Vendor cloud platform |
| Setup time | Replace data and refresh pivots | Copy file and replace data | Longer onboarding |
| Real-time team collaboration | Best with OneDrive or SharePoint | Native Google Drive sharing | Usually included |
| Mobile access | Excel app with limitations | Google Sheets app | Usually included |
| Customizable fields | Fully editable workbook | Editable sheet | Limited by vendor rules |
| Share with link | Available through Microsoft sharing | Native link sharing | Depends on platform |
| Year-1 cost at 5 users | $17.99 plus Excel licensing if needed | Template cost plus Google account | Often hundreds of dollars |
| Pivot refresh | Included | Depends on sheet design | Vendor controlled |
| Photography profitability views | Included | Depends on template | Often limited |
Who Should Use This Template
This template is a good fit for wedding studios, portrait studios, event photographers, commercial photography agencies, studio chains, and managers who already store booking data in Excel. It is also useful for small businesses that want to review financial and operational KPIs before investing in a larger CRM.
It is not the right tool if you need contracts, client portals, galleries, automated invoicing, appointment reminders, or payment processing in the same system. This is an analytics dashboard, not an all-in-one studio management platform.
Real-World Use Cases
Maya, a wedding studio owner: Maya uses lead source charts to identify referral bookings with a higher paid booking percentage. She then increases referral incentives instead of spending more on low-converting ad channels.
Jordan, a portrait studio manager: Jordan compares average rating by photographer with profit by photographer. This helps him balance client satisfaction, scheduling, and coaching conversations.
Priya, an operations lead: Priya reviews labor cost by month and material cost by package before peak season. She uses the dashboard to update pricing and staffing plans with evidence.
Advantages of Photography Studios Dashboard in Excel
The main advantage is speed. You do not need to design a dashboard from scratch, build every chart, or create pivot tables manually. The workbook gives you a ready-made Excel structure for booking performance, cost control, studio comparison, service mix, and profitability review.
Another advantage is ownership. Your data remains in Excel, and you can edit the workbook as your studio changes. The template is also a one-time purchase, which is helpful for studios that want reporting without monthly software fees.
Opportunities for Improvement
The dashboard can become even more useful when paired with clean booking data. If your studio has inconsistent names for photographers, service types, packages, or lead sources, standardize those values before analysis. You can also add Power Query, extra formulas, or custom pivots if your team wants deeper automation.
Best Practices
Update the Data sheet on a consistent schedule, ideally weekly or monthly. Keep the same column order, avoid blank key fields, and use consistent names for service types, studios, regions, and photographers.
After every data update, click Refresh All from the Excel Data ribbon. Review the Overview first, then use the deeper pages to investigate booking trends, service mix, studio performance, and profitability.
Explore Relevant Templates
- Photography Business Dashboard in Google Sheets
- Photography Business Dashboard in Power BI
- Photography Business KPI Dashboard in Excel
- Excel Dashboard Templates
Frequently Asked Questions
What is the Photography Studios Dashboard in Excel?
It is a ready-to-use Excel dashboard template for tracking photography studio bookings, booking value, profit, cost, ratings, payment status, lead source, service type, package, studio, region, and photographer performance.
How many sheets are included?
The workbook includes Overview, Booking Trend, Service Mix, Studio Performance, Profitability, Data Sheet, and Support Sheet tabs.
How do I update the dashboard?
Replace the sample records in the Data sheet, keep the same format, then click Refresh All from the Excel Data ribbon. The pivot tables and charts will update.
Can I use my own photographers and service types?
Yes. You can add your own photographer names, service types, packages, cities, regions, studios, lead sources, and payment statuses in the Data sheet.
Is the Support sheet required?
Yes, it powers the dashboard through pivot tables. You can keep it hidden during normal use, but it should remain in the workbook.
Does this replace a photography CRM?
No. It is for reporting and analytics. It does not manage contracts, galleries, invoices, client portals, or payment collection.
About the Author
Built by PK – Microsoft Certified Professional with 15+ years of Excel, Google Sheets, and Power BI experience. Founder of NextGenTemplates, reaching 300K+ subscribers across YouTube channels. Every template is hand-built and tested before release.
Conclusion
The Photography Studios Dashboard in Excel is a practical reporting template for studio owners who want to understand bookings, profit, cost, service mix, payment health, and photographer performance from one workbook. With 5 KPI cards, 16 charts, slicers, and pivot-based refreshes, it gives photography teams a clear way to turn booking records into decisions.
Visit our YouTube channel for step-by-step Excel tutorials: Youtube.com/@PKAnExcelExpert