Plant nurseries create more data than many owners expect: units sold, order count, revenue, gross profit, procurement cost, product categories, regions, nurseries, sales channels, customer types, staff care cost, quality ratings, fulfillment status, delivered orders, and city demand. A nursery processing 50 orders per week can create more than 2,600 records per year, and that is enough for margin leaks, fulfillment delays, and procurement cost pressure to hide in ordinary spreadsheets. The Plant Nurseries Dashboard in Power BI turns those records into a 5-page PBIX report with KPI cards, slicers, and ready-made visuals for faster sales, procurement, quality, and operations review.
This Power BI dashboard is built for nursery owners, greenhouse teams, garden center managers, agriculture analysts, and operations leaders who want a repeatable reporting file without designing every visual from scratch. Open the PBIX file in Power BI Desktop, replace or connect the sample source, refresh the report, and use slicers to analyze selected products, regions, customer groups, staff members, channels, or fulfillment statuses. Microsoft explains the Power BI Desktop environment here: Power BI Desktop documentation.
Click here to purchase Plant Nurseries Dashboard in Power BI
Key Features of Plant Nurseries Dashboard in Power BI
5 Power BI report pages: The template includes Overview, Sales Trend, Product Mix, Nursery Ops, and Inventory Quality pages. Each page focuses on a different management question for nursery sales, procurement, product mix, operations, and fulfillment quality.
5 executive KPI cards: The Overview page highlights Total Units Sold, Total Revenue, Total Orders, Gross Profit, and Delivered Orders. These cards help managers see sales volume, order activity, profit, and delivery performance before drilling into the charts.
16 ready-made chart views: The report covers profit margin, procurement cost by region, gross profit by product category, revenue by month, revenue by channel, revenue by customer type, procurement cost by nursery, quality rating by staff, region revenue, city orders, fulfillment status, care cost by staff, regional margin, and fulfillment rate by channel.
Interactive slicers: Slicers make the report useful during weekly reviews. Instead of rebuilding charts manually, users can filter by available fields such as month, region, nursery, product category, customer type, sales channel, fulfillment status, staff, or city.
Editable PBIX format: Because this is a Power BI file, analysts can edit pages, measures, visuals, colors, labels, relationships, and source connections in Power BI Desktop.
Dashboard Pages Explanation
1 – Overview Page
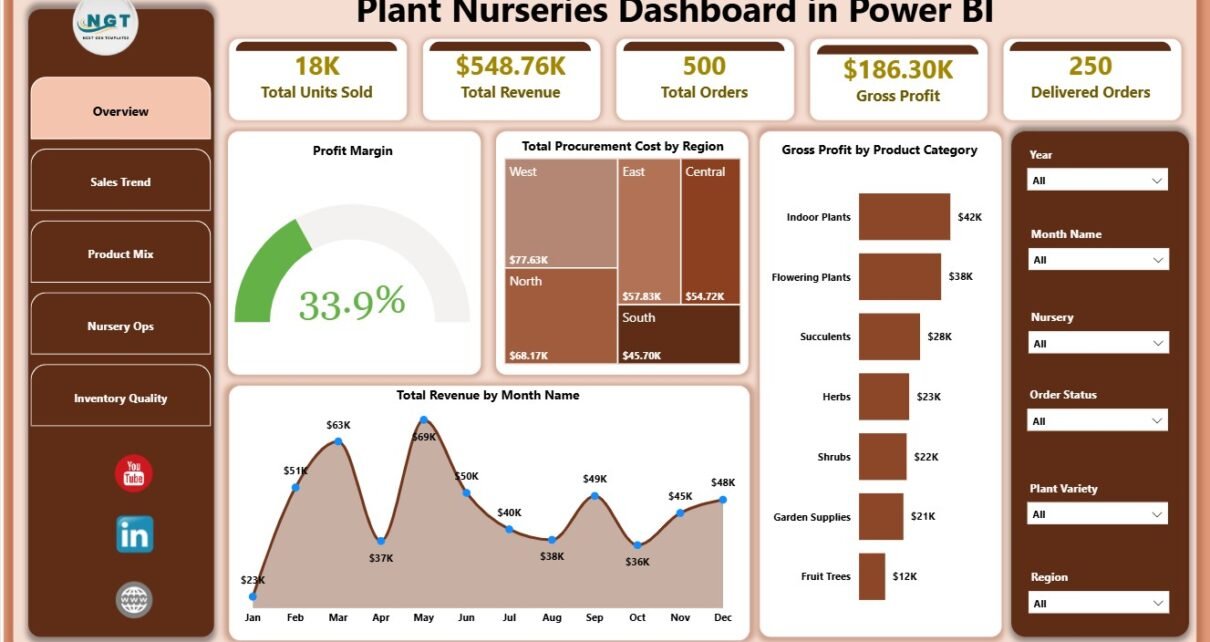
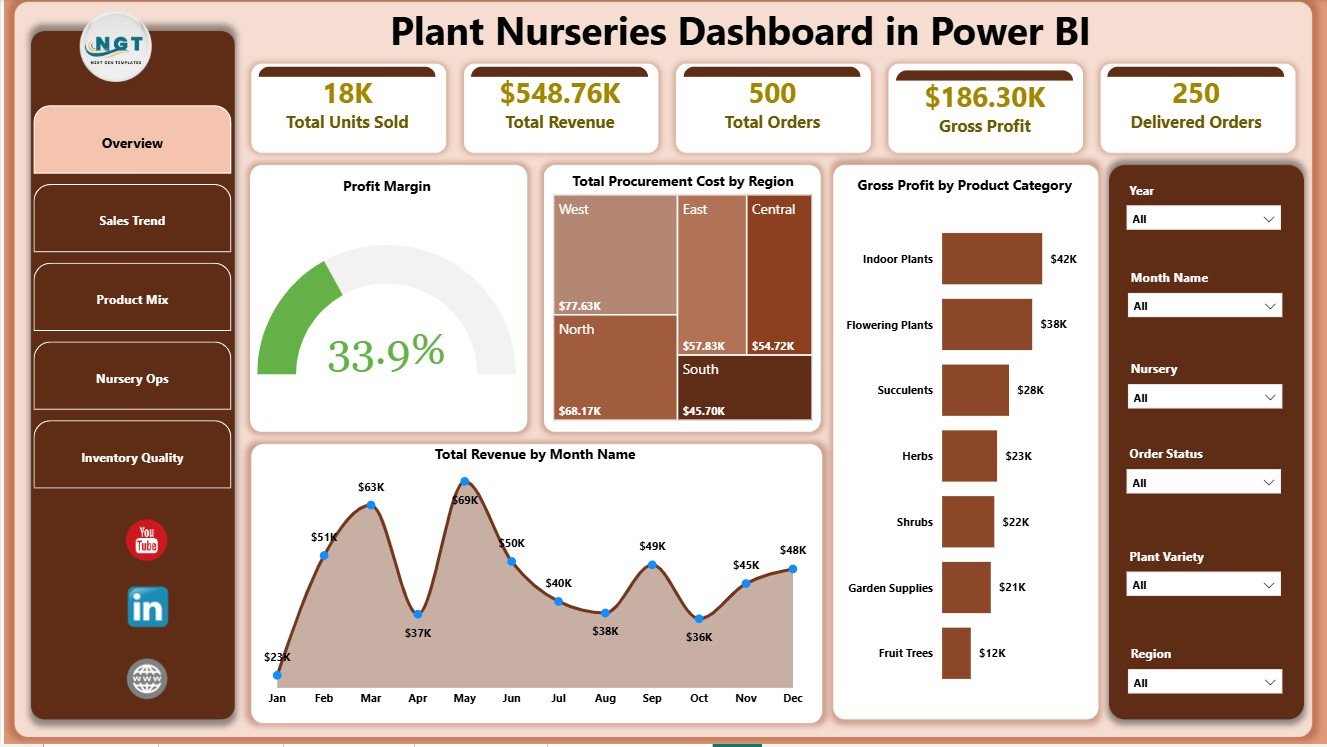
The Overview page is the executive summary of the Plant Nurseries Dashboard in Power BI. The top cards show Total Units Sold, Total Revenue, Total Orders, Gross Profit, and Delivered Orders, so users can quickly review nursery volume, sales value, profitability, order activity, and completed fulfillment.
Profit Margin by Overall Dashboard Selection: This chart summarizes profitability for the active slicer selection. It helps users see whether a selected region, nursery, product category, or sales channel is producing a healthy margin.
Total Procurement Cost by Region: This chart compares procurement cost across regions. It helps identify where supplier cost, freight, sourcing mix, or regional purchasing behavior is creating higher expense pressure.
Gross Profit by Product Category: This chart ranks product categories by gross profit contribution. It supports decisions about which plant categories deserve more attention, shelf space, or promotion.
Total Revenue by Month Name: This chart shows revenue movement across months. It helps managers spot seasonality, peak planting periods, slower months, and timing patterns in nursery demand.
Plant Nurseries Dashboard in Power BI
2 – Sales Trend
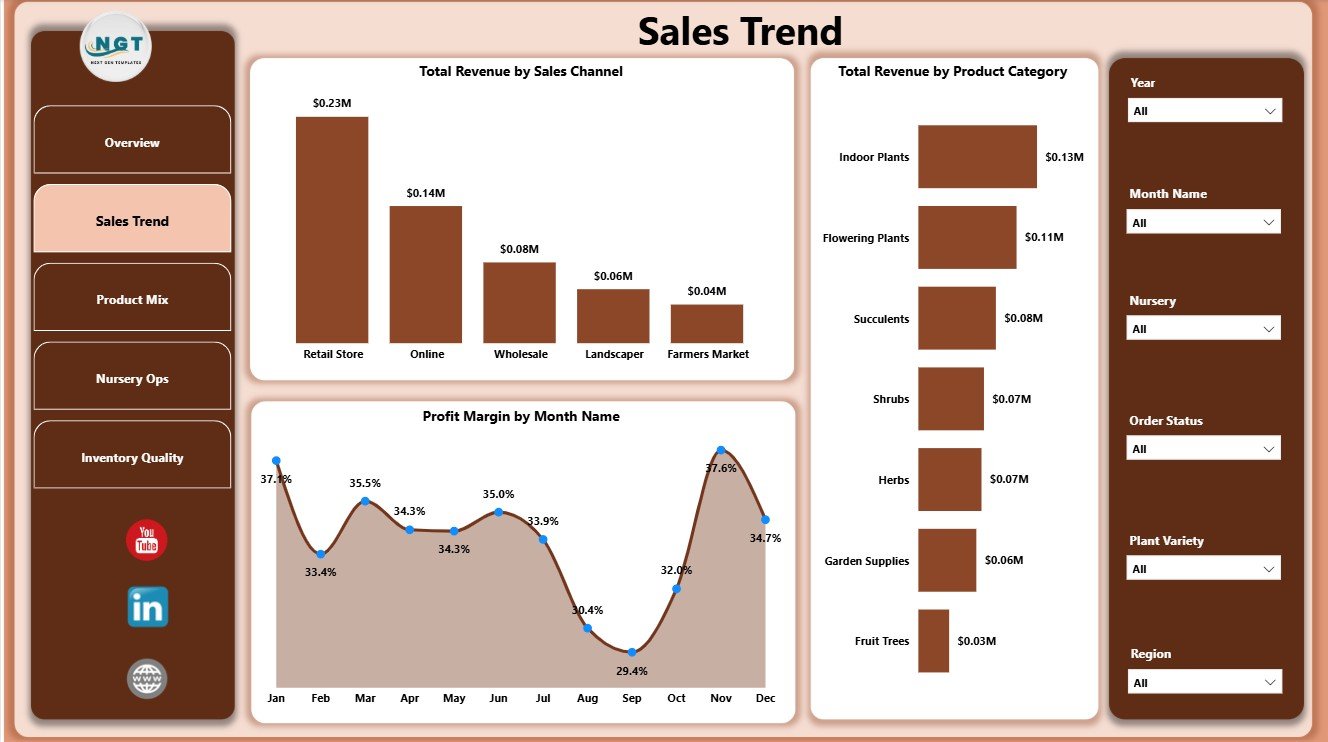
The Sales Trend page explains how sales value and margin move across channels, product categories, and months. It is useful for weekly sales meetings, promotion planning, and seasonal review.
Total Revenue by Sales Channel: This chart compares revenue across sales channels. It helps identify whether retail, wholesale, online, landscaping, marketplace, or other channels are contributing most to nursery sales.
Total Revenue by Product Category: This chart shows which product categories generate the most revenue. It helps teams understand category-level demand before planning purchasing or promotion.
Profit Margin by Month Name: This chart tracks margin by month. It helps distinguish high-revenue months from high-profit months, which is important when procurement cost and care cost vary by season.
Sales Trend
3 – Product Mix
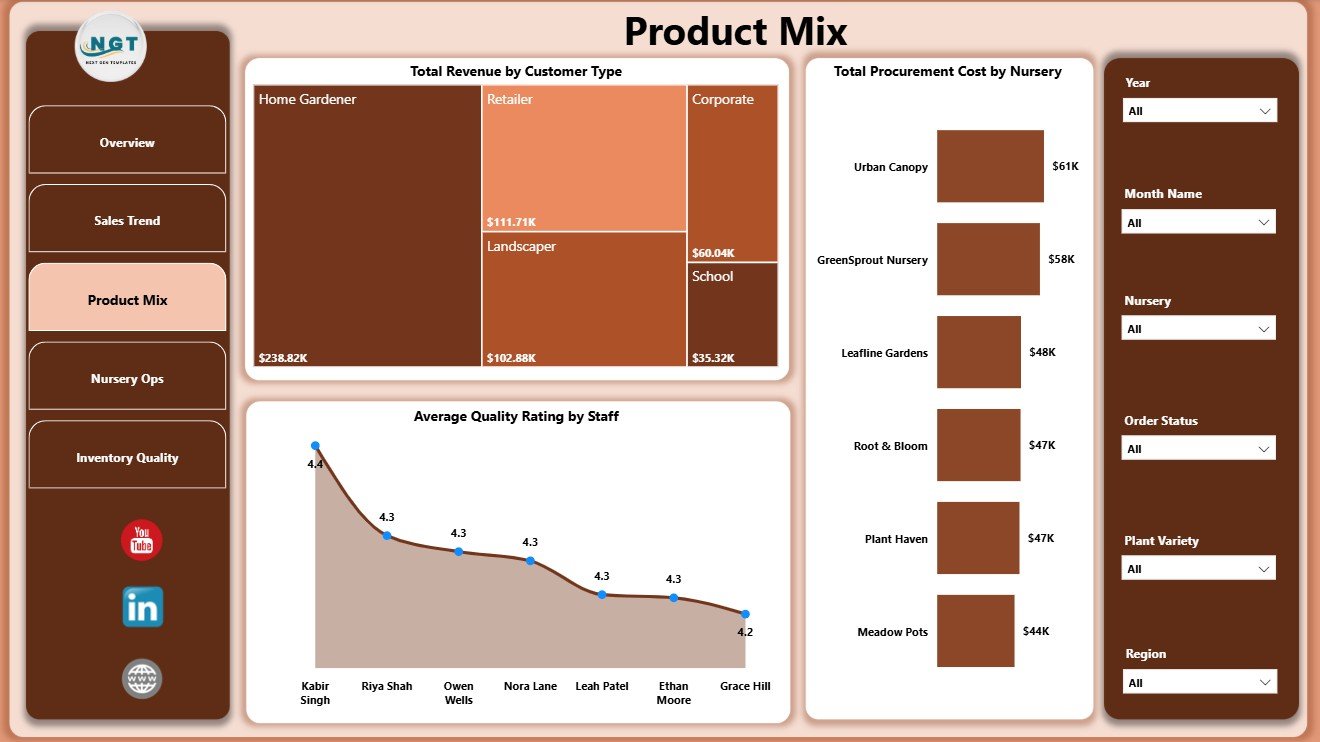
The Product Mix page helps users understand how customer groups, nurseries, and staff quality ratings shape results. It is the page to use when the team wants to understand what is selling, who is buying, and where cost or quality patterns appear.
Total Revenue by Customer Type: This chart compares revenue by customer segment. It helps teams distinguish retail buyers, wholesale customers, landscapers, commercial accounts, or other customer groups.
Total Procurement Cost by Nursery: This chart shows procurement cost by nursery. It helps compare nursery-level sourcing, stock movement, and cost concentration across growing or selling locations.
Average Quality Rating by Staff: This chart compares staff-level quality ratings. It helps managers recognize strong performance and identify where coaching, inspection, or process review may be needed.
Product Mix
4 – Nursery Ops
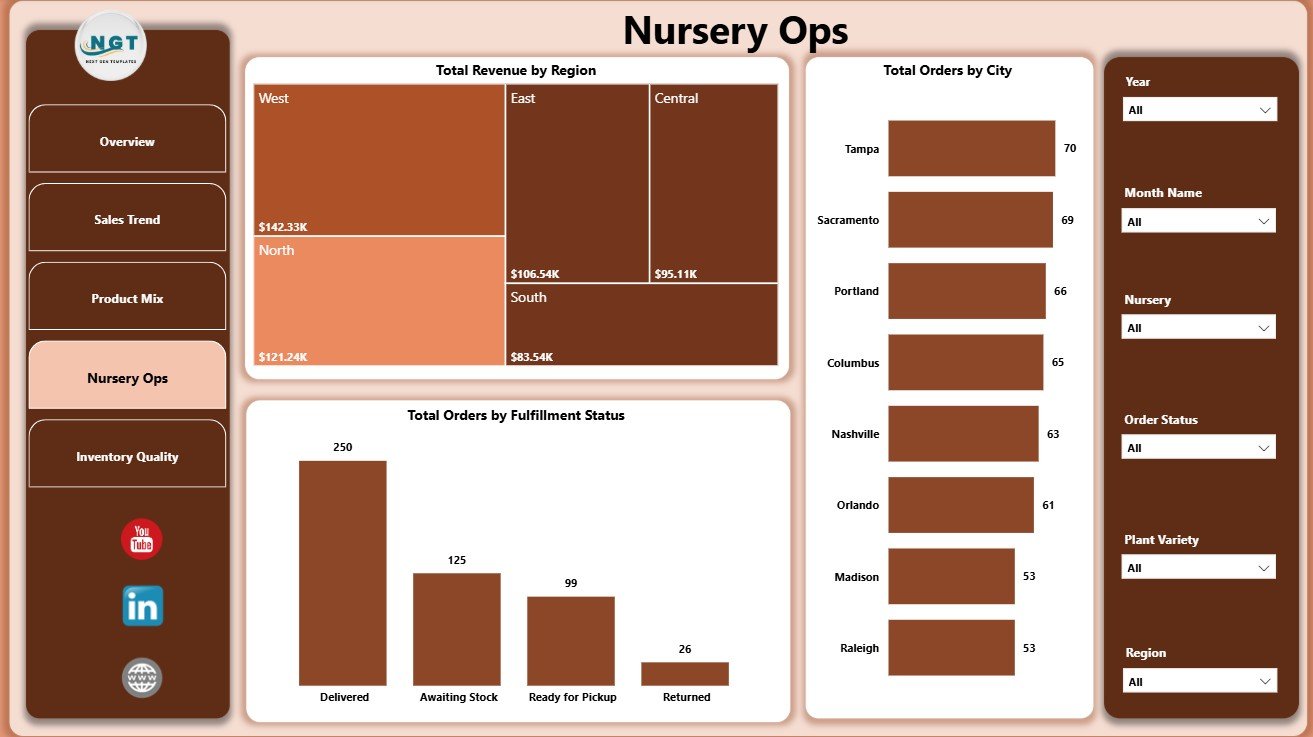
The Nursery Ops page focuses on region, city, and fulfillment status. It helps operations teams compare geographic demand and monitor how orders are moving through the fulfillment process.
Total Revenue by Region: This chart compares revenue contribution across regions. It helps users see which territories are strongest and which areas may need sales, pricing, or stock review.
Total Orders by City: This chart shows order count by city. It supports delivery planning, local marketing, branch comparison, and service-area demand review.
Total Orders by Fulfillment Status: This chart splits orders by fulfillment stage. It helps teams track delivered, pending, delayed, cancelled, or other operational statuses depending on the source data.
Nursery Ops
5 – Inventory Quality
The Inventory Quality page connects care cost, regional margin, and fulfillment reliability. It is useful when the team wants to balance sales growth with stock quality, plant care effort, and delivery consistency.
Total Care Cost by Staff: This chart compares care cost by staff member. It helps managers understand where care activity is concentrated and where labor or handling process may need review.
Profit Margin by Region: This chart compares profitability across regions. It helps separate high-revenue regions from regions that produce healthier margins.
Fulfillment Rate by Sales Channel: This chart shows fulfillment reliability by channel. It helps identify whether certain sales routes complete orders more consistently than others.
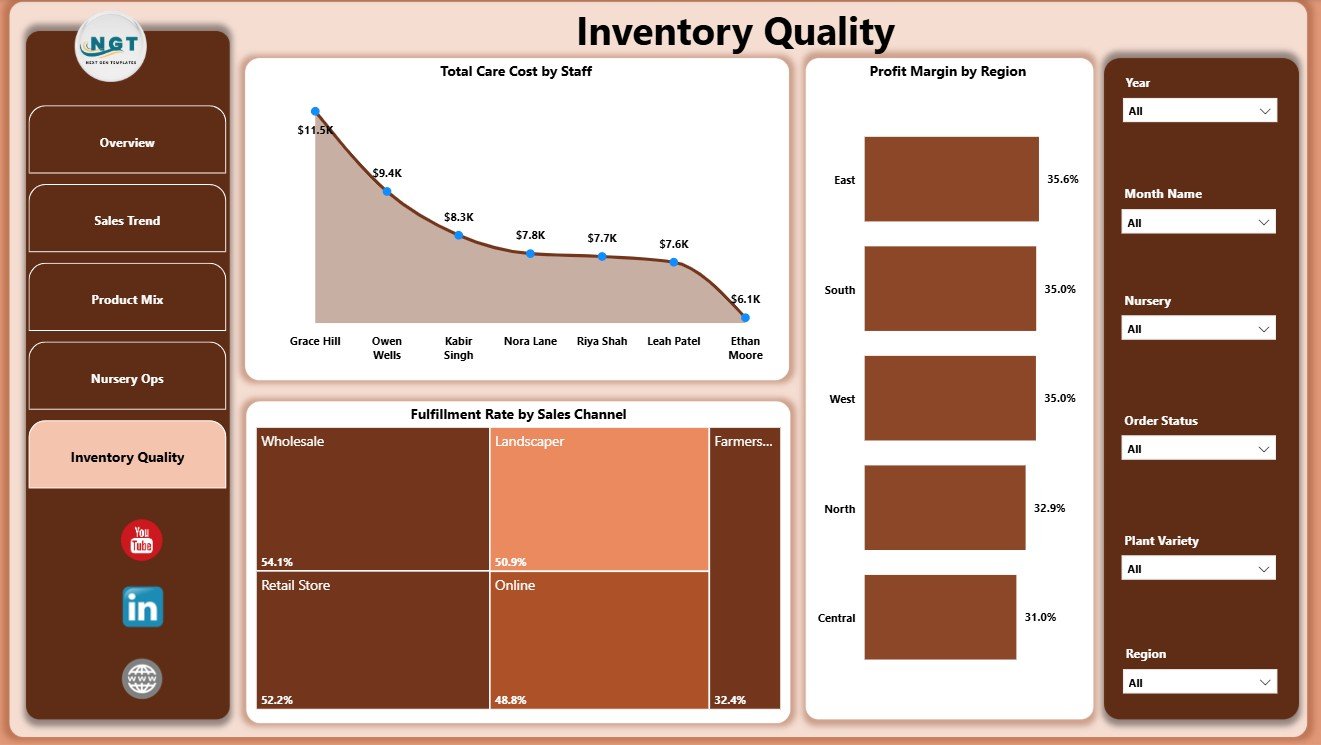
Inventory Quality
Plant Nurseries Dashboard in Power BI vs. Tableau vs. Paid CRM/SaaS – Feature Comparison
| Feature | Plant Nurseries Dashboard in Power BI | Tableau or Qlik alternative | Paid nursery or retail SaaS |
|---|---|---|---|
| Cost | $17.99 one-time sale price | License cost plus report build time | Monthly or annual subscription |
| Platform | Power BI Desktop and optional Power BI Service | Tableau or Qlik environment | Vendor-hosted app |
| Setup time | Open PBIX, replace source, refresh | Build data model and visuals manually | Onboarding and configuration |
| Real-time team collaboration | Available after publishing to Power BI Service | Available by plan | Usually included |
| Mobile access | Available through Power BI mobile after publishing | Available through vendor app | Usually included |
| Customizable fields | Edit model, measures, visuals, slicers, and pages | Editable with analyst skills | Often limited by vendor plan |
| Share with link | Available through workspace permissions | Available through platform permissions | Usually login controlled |
| Year-1 cost at 5 users | Template price plus Microsoft licensing choice | License cost plus analyst time | Often hundreds or thousands per year |
| Nursery-specific analytics | Revenue, orders, gross profit, procurement, care cost, quality, fulfillment, region, city, staff, and channel reporting included | Requires custom design | Depends on reporting module |
Who Should Use This Template
This template is a good fit for plant nursery owners, garden center managers, greenhouse teams, agriculture analysts, procurement managers, fulfillment leads, inventory quality managers, and consultants who already maintain structured nursery data and want a Power BI reporting layer.
It is not the right fit if you need live point-of-sale processing, barcode scanning, stock deduction, supplier ordering, accounting, customer relationship management, greenhouse automation, or ERP workflow. This is an analytics dashboard, not a transaction system.
Real-World Use Cases
Anika, nursery owner: Anika reviews Total Units Sold, Total Revenue, Gross Profit, and Delivered Orders every Monday. She uses the Sales Trend page to decide which product categories and channels need attention for the week.
Rohan, procurement manager: Rohan compares Total Procurement Cost by Region and Total Procurement Cost by Nursery before supplier calls. The report helps him see where sourcing cost is rising and where negotiation may help.
Meera, operations analyst: Meera uses city orders, fulfillment status, staff quality rating, total care cost, and fulfillment rate to prepare monthly reviews for multiple nursery locations.
Advantages of Plant Nurseries Dashboard in Power BI
The biggest advantage is speed. You do not need to design five Power BI pages, decide every chart, or build the report layout from a blank file. The dashboard already focuses on the questions nursery teams ask about revenue, orders, procurement, margin, fulfillment, staff, and quality.
Another advantage is flexibility. Because it is a PBIX file, your team can adapt the dashboard as your reporting process changes. You can rename visuals, modify measures, update source connections, add fields, change colors, or publish the report to Power BI Service when your Microsoft setup supports it.
Opportunities for Improvement
The dashboard depends on clean source data. Before refreshing, standardize values for region, nursery, product category, sales channel, customer type, staff, city, and fulfillment status. Small spelling differences can create duplicate categories in slicers and charts.
Larger nurseries may eventually connect the PBIX file to SharePoint, SQL, Excel exports, a cloud database, or an ERP export. If you want to learn more about connecting data sources, Microsoft provides a helpful Power BI data connection guide.
Best Practices
- Keep a backup copy of the original PBIX before editing visuals, measures, or source connections.
- Validate KPI cards against your source data after the first refresh.
- Use consistent names for nurseries, regions, cities, staff members, channels, and categories.
- Review gross profit and profit margin together so revenue growth is not mistaken for profitable growth.
- Use slicers deliberately during meetings so everyone understands the active filter context.
- Document custom measures or source changes if multiple analysts will maintain the file.
Explore Relevant Templates
You may also like Plant Nurseries Dashboard in Excel, Garden Center Dashboard in Power BI, Organic Seeds Providers Dashboard in Power BI, and Floriculture KPI Dashboard in Power BI.
Browse more Power BI Dashboard templates and Power BI templates.
Frequently Asked Questions
What does the Plant Nurseries Dashboard in Power BI track?
It tracks units sold, revenue, orders, gross profit, delivered orders, profit margin, procurement cost, product category, sales channel, customer type, nursery, quality rating, staff, region, city, fulfillment status, care cost, and fulfillment rate.
Can I use my own plant nursery data?
Yes. Replace or connect the sample source with your structured data, then refresh the Power BI report.
Do I need Power BI Desktop?
Yes. Power BI Desktop is recommended for opening, editing, and refreshing the PBIX file. Power BI Service is optional for sharing and scheduled refresh.
Can I customize the visuals?
Yes. You can edit pages, slicers, visuals, colors, labels, measures, relationships, and source connections in Power BI Desktop.
Is this a live inventory system?
No. It is an analytics dashboard for prepared data, not a live POS, barcode scanner, ERP, accounting system, or inventory-control platform.
Can this work for multiple locations?
Yes. The report includes region, city, and nursery-level analysis, making it useful for comparing multiple branches, growing sites, or sales territories when your source data includes those fields.
About the Author
Built by PK – Microsoft Certified Professional with 15+ years of Excel, Google Sheets, and Power BI experience. Founder of NextGenTemplates, reaching 300K+ subscribers across YouTube channels. Every template is hand-built and tested before release.
Conclusion
The Plant Nurseries Dashboard in Power BI gives nursery teams a practical way to review revenue, orders, gross profit, procurement cost, product category performance, customer type revenue, nursery cost, staff quality rating, regional performance, city demand, fulfillment status, care cost, and fulfillment reliability. With five focused pages and slicer-based filtering, it can support weekly sales reviews, procurement meetings, quality checks, and monthly operations reporting.
Click here to purchase Plant Nurseries Dashboard in Power BI
Instant download. One-time payment. No subscription.
Visit our YouTube channel for step-by-step video tutorials: Youtube.com/@PK-AnExcelExpert
Last updated: July 25, 2026