Most ethics offices have the data. What they do not have is a way to show it. Cases land through a hotline, a web portal, a manager referral and an inbox; they get logged in a spreadsheet; and then, once a quarter, somebody spends two days rebuilding the same board slide from scratch.
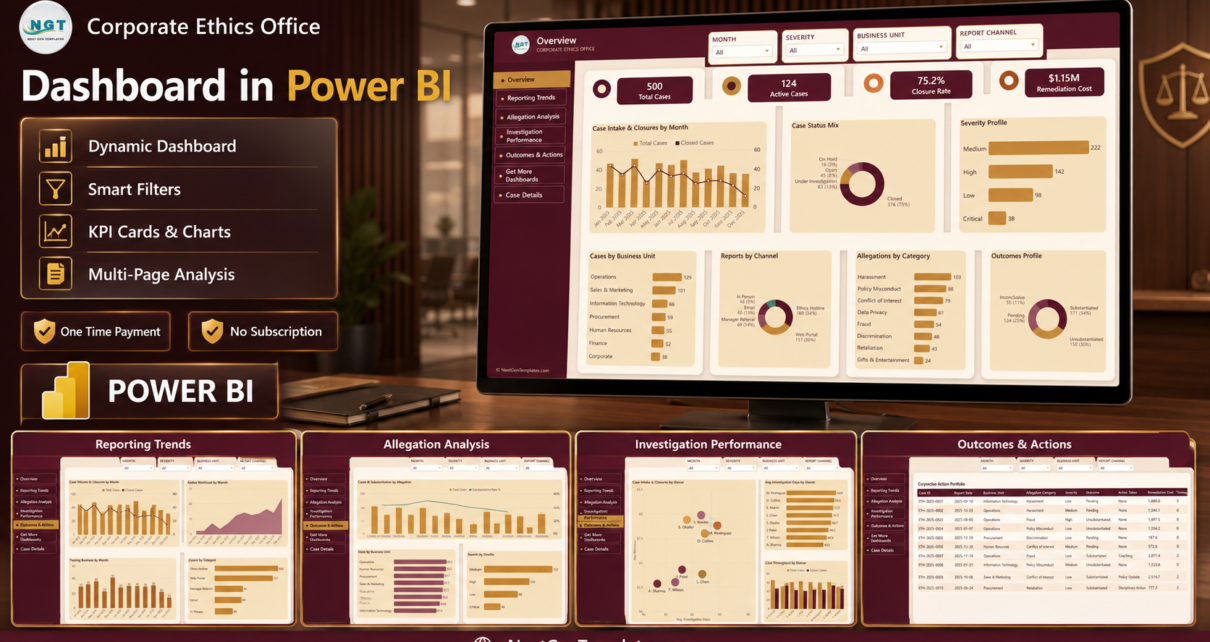
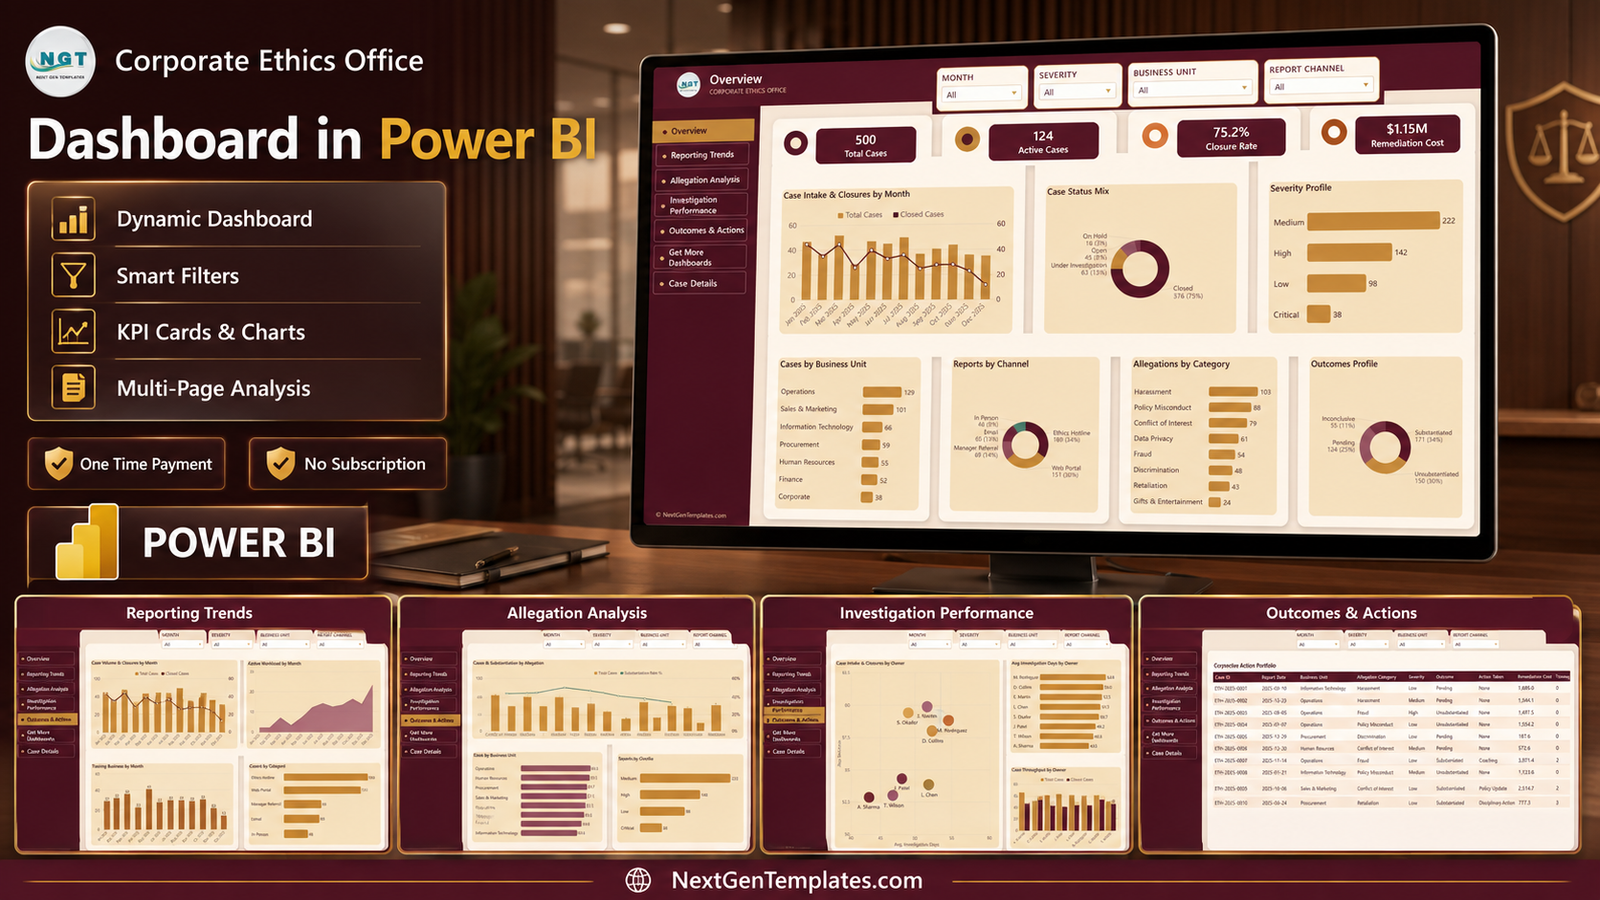
The Corporate Ethics Office Dashboard in Power BI is that slide, already built. It ships with 500 sample ethics cases spanning the whole of 2025, 17 data columns per case, 9 DAX measures and 9 report pages – six visible, plus a hidden Case Details drillthrough and two tooltip pages. Four slicers stay in sync across every analysis page, so one filter click rebuilds the entire report. In the sample data that is 500 total cases, 124 still active, a 75.2% closure rate and $1.15M of remediation cost, spread over 7 business units, 8 allegation categories, 5 report channels and 5 regions.
Key Features of the Corporate Ethics Office Dashboard in Power BI
- Nine pages, six of them visible. Overview, Reporting Trends, Allegation Analysis, Investigation Performance, Outcomes & Actions and Get More Dashboards, plus a hidden Case Details drillthrough and two 280×360 tooltip pages named Category Detail and Trend Detail.
- Four synced slicers – Month, Severity, Business Unit and Report Channel – sitting in the header of every analysis page.
- Nine DAX measures: Total Cases, Active Cases, Closed Cases, Closure Rate %, Avg. Investigation Days, Avg. Risk Score, Substantiation Rate %, Total Remediation Cost and Total Training Referrals.
- A 17-column case table covering Case ID, Report Date, Business Unit, Region, Report Channel, Allegation Category, Severity, Investigation Owner, Reporter Type, Employees Involved, Investigation Days, Remediation Cost, Risk Score, Training Referrals, Status, Outcome and Action Taken.
- A left navigation rail on every page, so the report behaves like an app rather than a stack of tabs.
- A custom bronze-on-burgundy theme with drawn page backgrounds, applied consistently across all nine pages.
Dashboard Pages Explanation
1. Overview
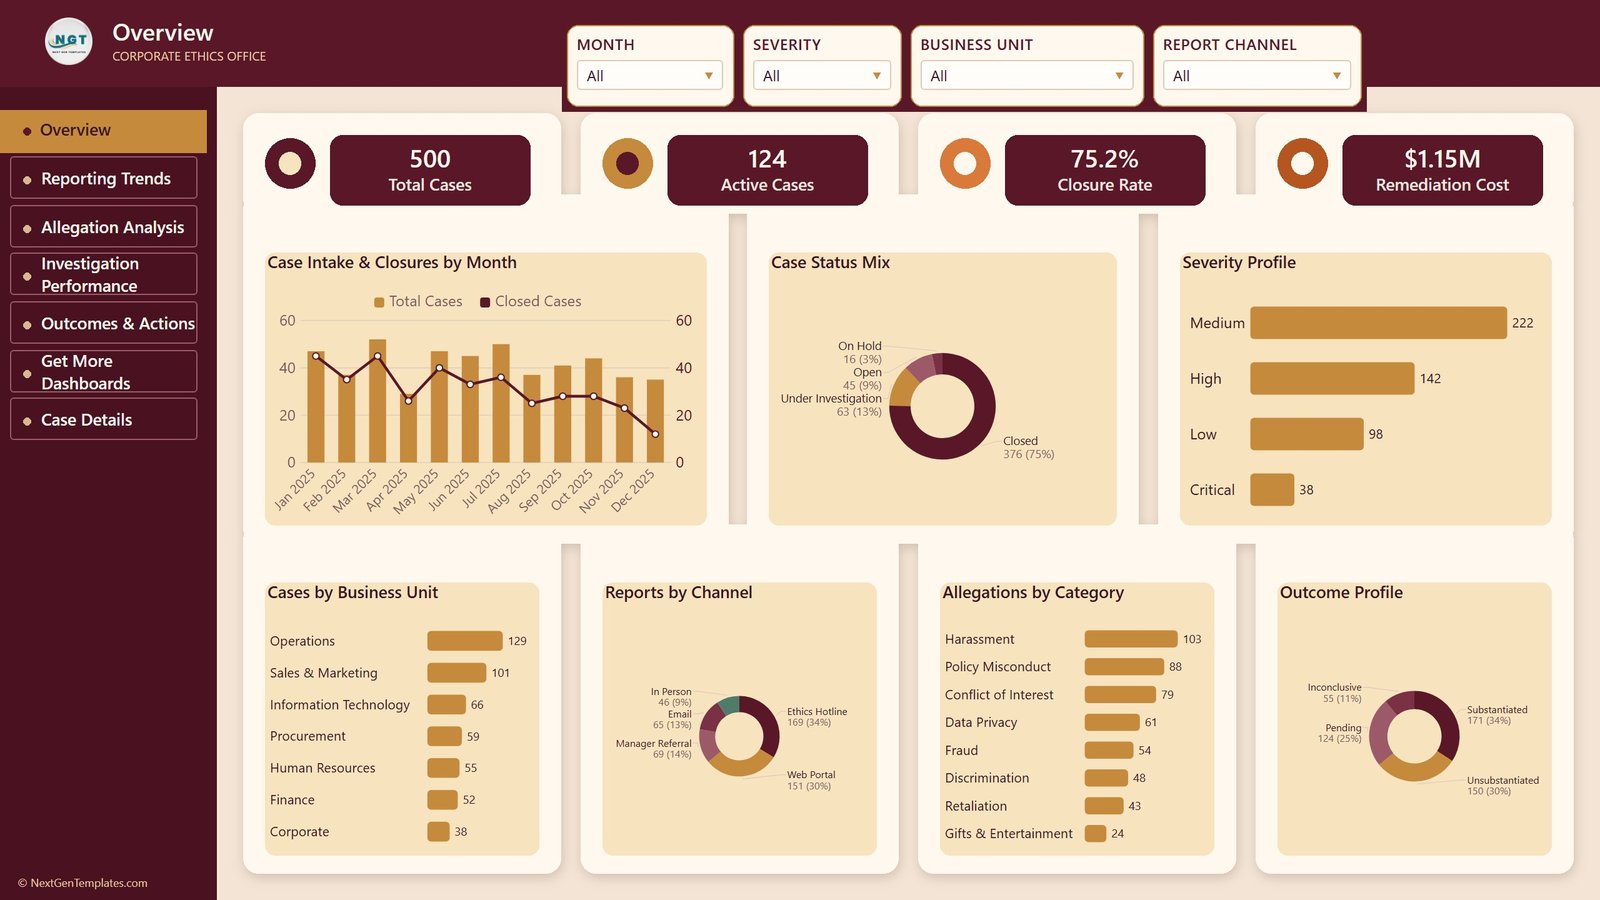
Four KPI cards sit across the top: 500 Total Cases, 124 Active Cases, 75.2% Closure Rate and $1.15M Remediation Cost. Below them, Case Intake & Closures by Month plots monthly volume as columns with closures as a line, and Case Status Mix breaks the caseload into 376 closed (75%), 63 under investigation (13%), 45 open (9%) and 16 on hold (3%). Severity Profile shows Medium 222, High 142, Low 98 and Critical 38. The bottom row carries Cases by Business Unit (Operations leads with 129), Reports by Channel, Allegations by Category and Outcome Profile.
2. Reporting Trends
Four charts about time. Case Volume & Closures by Month repeats the intake combo at full width. Active Workload by Month is the one worth watching: in the sample it climbs from 2 open cases in January to 23 by December, which is exactly the backlog signal a monthly count of new cases hides. Training Referrals by Month runs from 41 in May down to 13 in December, and Cases by Report Channel ranks Ethics Hotline 169, Web Portal 151, Manager Referral 69, Email 65 and In Person 46.
3. Allegation Analysis
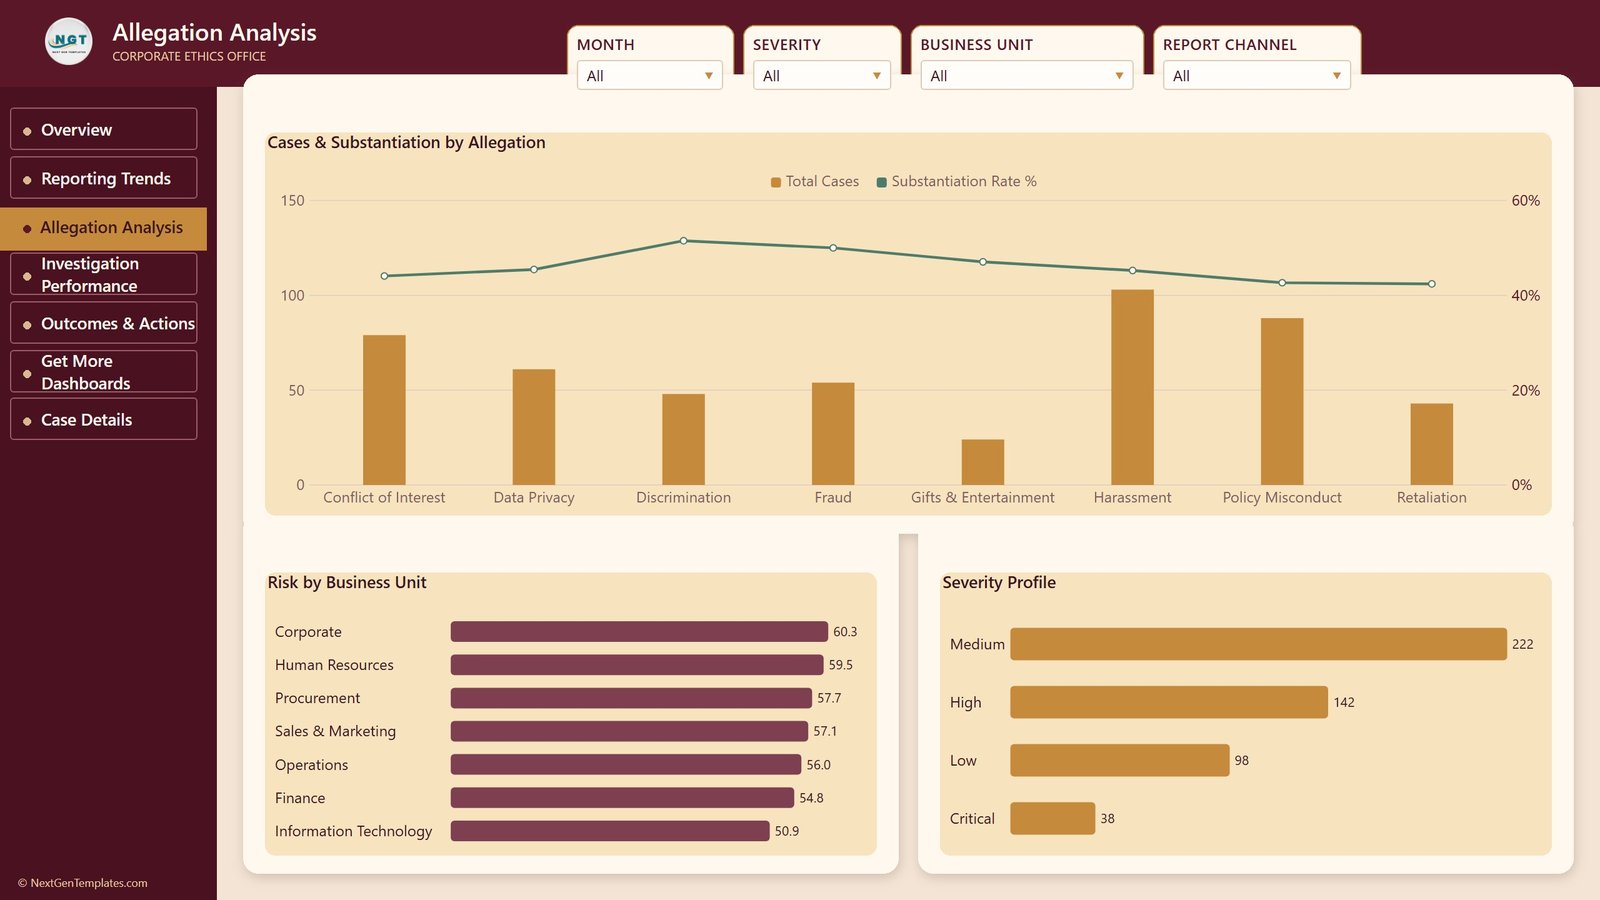
Cases & Substantiation by Allegation is a dual-axis chart: total cases as columns, substantiation rate as a line. It exists to stop the obvious mistake of reading volume as risk – Harassment is the biggest column at 103 cases, but the substantiation line peaks over Discrimination. Underneath, Risk by Business Unit ranks average risk score from Corporate at 60.3 down to Information Technology at 50.9, and Severity Profile repeats the four-band split.
4. Investigation Performance
The bubble chart plots Avg. Investigation Days against Avg. Risk Score for each of the eight investigation owners. Alongside it, Avg Investigation Days by Owner ranks them from M. Rodriguez at 54.8 days down to A. Sharma at 43.5, and Case Throughput by Owner puts total cases against closed cases per owner. Read together they answer the question a caseload table cannot: is this investigator slow, or are they carrying the hard cases? In the sample the two cluster – the slower owners sit in the high-risk quadrant – which is an argument for rebalancing, not for a performance conversation.
5. Outcomes & Actions
The Corrective Action Portfolio, a case-level table with Case ID, Report Date, Business Unit, Allegation Category, Severity, Outcome, Action Taken, Remediation Cost and Training Referrals. This is the page that closes the loop: across the 500 sample cases, 304 carry no action, 54 coaching, 48 a written warning, 42 a policy update, 38 disciplinary action and 14 termination, generating 336 training referrals in total.
6. Case Details (hidden drillthrough)
Right-click any bar, bubble or slice and drill through to a 13-column case table that adds Region, Reporter Type, Investigation Days, Risk Score and Status to the fields above, with a back button in the header. It is hidden from the navigation on purpose – you reach it from the data, not from a menu.
Power BI vs. Excel vs. Paid GRC Software – Feature Comparison
| This Power BI dashboard | Tableau or Qlik build | Paid GRC / hotline platform | |
|---|---|---|---|
| Cost | $17.99 one time | Per-user subscription, billed annually | Annual contract, quoted per employee |
| Platform | Power BI Desktop (free) | Tableau Desktop or Qlik Sense | Vendor-hosted SaaS |
| Setup time | Under an hour to swap the data | Days to model and design | Weeks of implementation |
| Case intake and hotline | No – analysis only | No | Yes, that is the product |
| Editable visuals and DAX | Yes, nothing is locked | Yes | Vendor-controlled reports |
| Share with colleagues | Publish to Power BI Service, or send the file | Server or Cloud licence | Included in the contract |
| Year-1 cost at 5 users | $17.99 total | Five paid seats | Full annual contract |
| Investigator throughput view | Yes – days and risk per owner | Build it yourself | Usually an add-on module |
Who Should Use This Template
Ethics and compliance officers who already keep case data somewhere and need a quarterly view they can defend. Internal audit leads who want substantiation rate and remediation cost side by side. HR business partners looking at how allegations distribute across business units. And Power BI analysts who would rather adapt a finished model – measures, theme, drillthrough and tooltips already wired – than start from an empty canvas.
It is not the right tool if you need case intake. There are no report forms, no anonymity workflow, no evidence storage and no chain-of-custody log, and it does not connect live to a hotline provider. It is a reporting layer over data you already have.
Real-World Use Cases
Quarterly board reporting
Set the Month slicer to the quarter, screenshot Overview, and the four KPI cards plus the status and severity splits answer the standard board questions before anyone asks them.
Deciding where the next control review goes
Risk by Business Unit ranks average risk score across all seven units. When Corporate scores 60.3 and IT scores 50.9 on comparable case volumes, that is a targeting argument rather than a company-wide sweep.
Making the case for another investigator
Active Workload by Month climbing month on month, combined with Case Throughput by Owner, turns a staffing request into a chart instead of an opinion.
Checking whether the hotline is actually being used
Reports by Channel splits intake five ways. If manager referrals dominate and the anonymous hotline is quiet, that is a finding about trust, not about volume.
Advantages of the Corporate Ethics Office Dashboard in Power BI
- The averages are genuine averages. Avg. Investigation Days lands between 43.5 and 54.8 days per owner and Avg. Risk Score between 50.9 and 60.3 per unit – values you can sanity-check against the raw data, not sums wearing an average label.
- Filters stay put. Four synced slicers mean a Month or Severity choice made on Overview is still applied on Investigation Performance.
- Row-level evidence is one right-click away through the Case Details drillthrough, which matters when somebody challenges a number in a meeting.
- Nothing is locked. Measures, theme JSON, page backgrounds and visuals are all editable in the free Power BI Desktop.
- One-time payment. No per-seat subscription and no renewal.
Opportunities for Improvement
Being straight about the limits:
- The data source is a static Excel import. Refreshing means updating Data.xlsx or repointing the Power Query source – there is no live connector to a case management system.
- Region is in the model but barely on the pages. It appears in Case Details; a regional view would need adding.
- Reporter Type and Employees Involved are unused by the visible pages, although both are in the table and ready to chart.
- There is no ageing or SLA visual. Active Workload by Month shows the backlog growing but not how old the oldest open case is.
- The sample is a single calendar year, so year-over-year comparisons need you to load a second year first.
Best Practices
- Anonymise before you load. Strip names and free-text allegations from the export; the dashboard only needs the categorical fields.
- Keep the 17 column headers exactly as shipped. Rename the values inside Business Unit or Allegation Category freely – the measures do not care – but changing a header breaks the model.
- Agree what “closed” means before you publish a closure rate. The measure counts the Status column; the definition has to be yours.
- Read volume and substantiation together. The dual-axis chart on Allegation Analysis exists precisely because the biggest category is not always the riskiest one.
- Restrict who sees the drillthrough. Case Details is row level. If you publish to the Power BI Service, use workspace roles or row-level security rather than trusting the page being hidden.
- Refresh on a schedule you can defend – monthly, at the same point in the cycle, so the trend lines mean something.
Explore Relevant Templates
- Corporate Ethics Office Dashboard in Excel – the same case data in Excel, with pivot tables and slicers instead of DAX.
- Compliance Monitoring Dashboard in Power BI – controls, obligations and exceptions rather than cases.
- Audit & Internal Controls Dashboard in Google Sheets – findings and remediation tracking.
- Corporate Governance KPI Dashboard in Google Sheets – a board-level governance scorecard.
- Power BI Dashboard Mega Collection – 15 Power BI templates in one bundle.
Frequently Asked Questions
Does it connect to my hotline or case management system?
No. It imports from the bundled Data.xlsx. Export your cases into that workbook, or repoint the Power Query source at your own file or database, then refresh.
Do I need a paid Power BI licence?
Not to open or edit it. Power BI Desktop is free from Microsoft. A paid licence is only needed to publish to the Power BI Service and share in a browser.
Are the cases and investigators real?
No. All 500 cases, the eight investigation owners and every figure quoted here are generated sample data, included so the model can be checked before real data goes anywhere near it.
Does this make my organisation compliant?
No. It is a reporting template – not a compliance programme, a policy, or legal advice.
Can I add my own branding?
Yes. The theme is a standard Power BI theme JSON and the page backgrounds are image files; both can be replaced in Power BI Desktop.
How large a case file will it take?
The sample is 500 rows and nothing in the model is hard-coded to that. Power BI’s import engine handles far larger case tables comfortably.
What is actually in the download?
One ZIP with three files – the .pbix report, the Data.xlsx source workbook, and a Power BI Dashboard user manual in PDF.
About the Author
Built by PK – Microsoft Certified Professional with 15+ years of Excel, Google Sheets, and Power BI experience. Founder of NextGenTemplates, reaching 300K+ subscribers across YouTube channels. Every template is hand-built and tested before release.
Conclusion
An ethics office is judged on whether it can show its work. This dashboard does the showing: 500 cases reduced to four numbers on Overview, then opened back up through allegation mix, investigator throughput and a case-level corrective action portfolio – with a right-click drillthrough for the moment somebody wants to see the underlying rows. It will not take your reports or run your investigations. It will end the two days of slide-building every quarter.
Get the Corporate Ethics Office Dashboard in Power BI for $17.99 (regular $29.99) – instant download, lifetime access and free updates.
For more Excel and Power BI walkthroughs, subscribe at youtube.com/@PKAnExcelExpert.