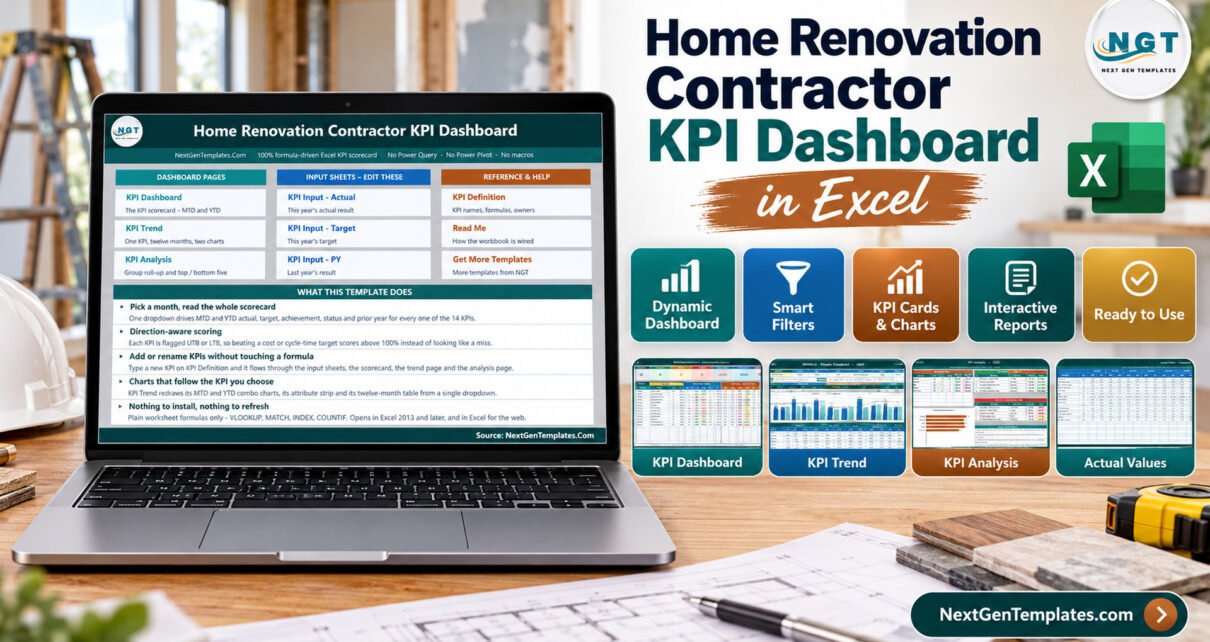
This renovation contractor KPI dashboard in Excel tracks 15 KPIs across 5 groups on 11 worksheets, with a single month dropdown driving MTD and YTD actual, target, achievement, status and prior-year columns for every metric. The scorecard sheet carries seven summary cards and one row per KPI; the sheets are wired for 22 KPI rows, so seven more can be added without touching a formula. There is no Power Query, no data model, no macro and no add-in – every number is a plain worksheet formula.
Most remodelling firms already know their revenue. What they usually cannot see in one place is whether jobs finished on the contracted date, whether they finished inside the signed contract value, how much of the crew’s week went to punch-list rework, and whether last quarter’s sales push quietly pushed delivery quality down. This workbook puts those questions on one page and answers them the same way every month.
What this template is – and what it is not
It is an Excel reporting template over data the buyer types in. It does not establish compliance with building codes, permitting, licensing, lien or home-improvement-contract law in any jurisdiction. It is not a structural, electrical, plumbing, gas or safety assessment, an inspection record or a warranty. It does not produce estimates, bids or contracts that are binding, accurate or fit to hand a customer, and it does not replace a licensed contractor’s statutory duties. Every margin, cycle-time, change-order, punch-list and satisfaction number in the shipped file is buyer-entered demo data, there to show the model working.
Key Features of the renovation contractor KPI dashboard in Excel
- 15 KPIs in 5 groups. Delivery (Projects Completed, On-Time Completion Rate, Average Project Cycle Time), Financial (On-Budget Completion Rate, Change-Order Rate, Gross Margin, Average Project Value), Sales (Quote-to-Close Rate, Lead-to-Quote Rate, Backlog), Quality (Punch-List / Rework Rate, Warranty Callback Rate, Customer Satisfaction), Workforce (Crew Utilisation, Recordable Safety Incidents).
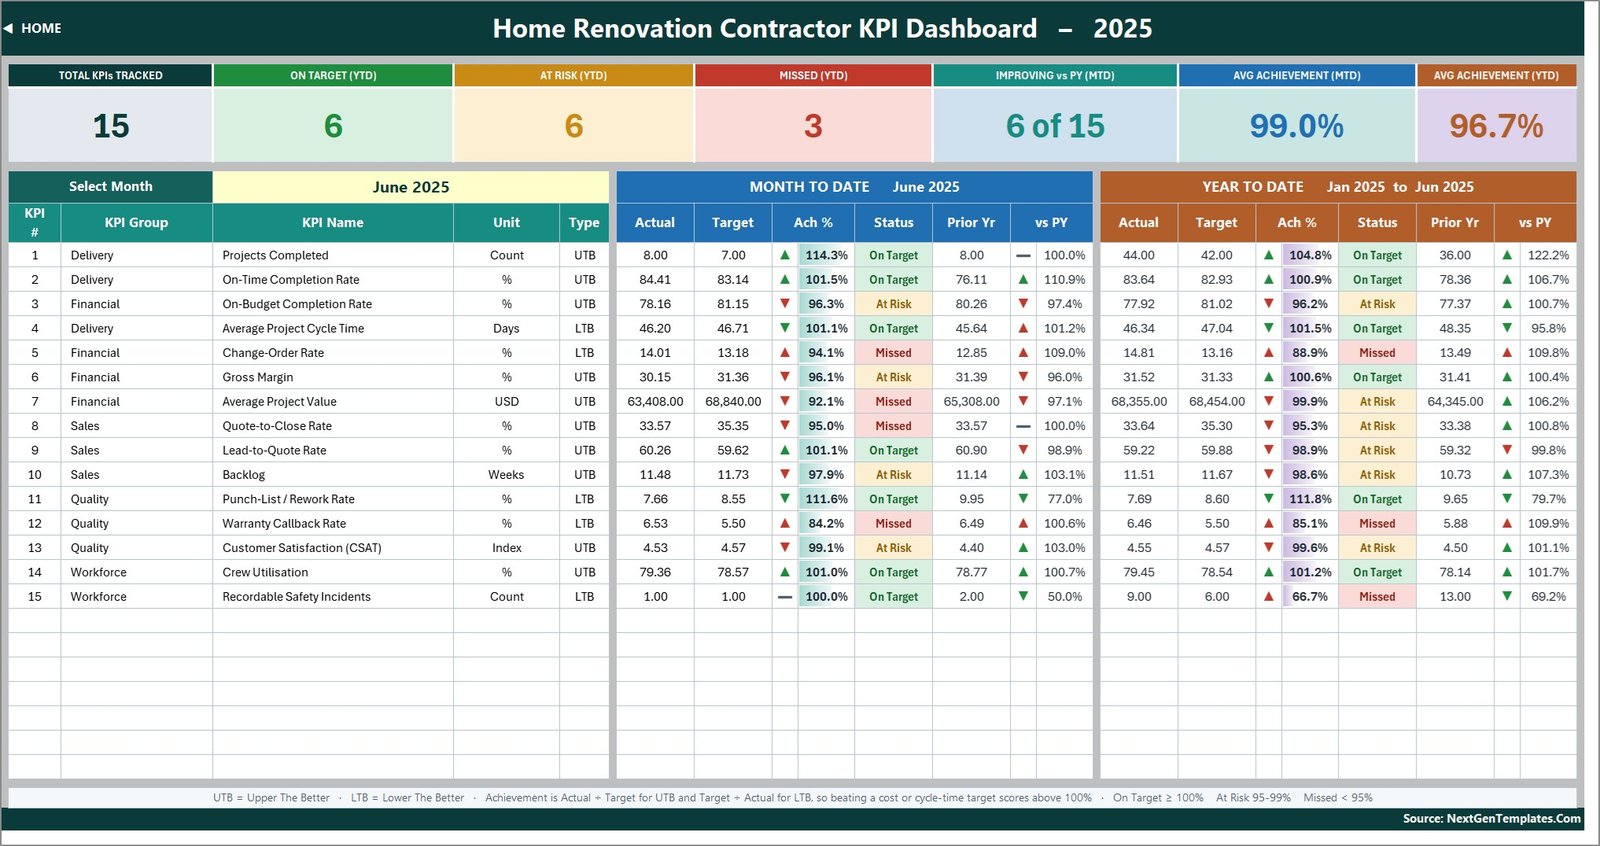
- A single month picker. Cell D6 on the KPI Dashboard sheet holds a dropdown of the twelve months of the reporting year. The scorecard rows, the seven summary cards and the entire KPI Analysis page follow it. The shipped sample opens on June 2025.
- Direction-aware achievement. Every KPI is flagged UTB or LTB. Achievement is Actual divided by Target for a UTB metric and Target divided by Actual for an LTB metric, so beating a cycle-time or change-order target scores above 100% rather than reading as a shortfall.
- Editable status thresholds. On Target from 100%, At Risk 95-99%, Missed below 95%, written as ordinary IF formulas in columns L and U of the scorecard – change them to match your own governance.
- Prior-year arrows coloured by direction, not by movement. The glyph shows raw direction; conditional formatting reads the UTB/LTB flag to colour it, so a falling change-order rate shows green and a rising one shows red.
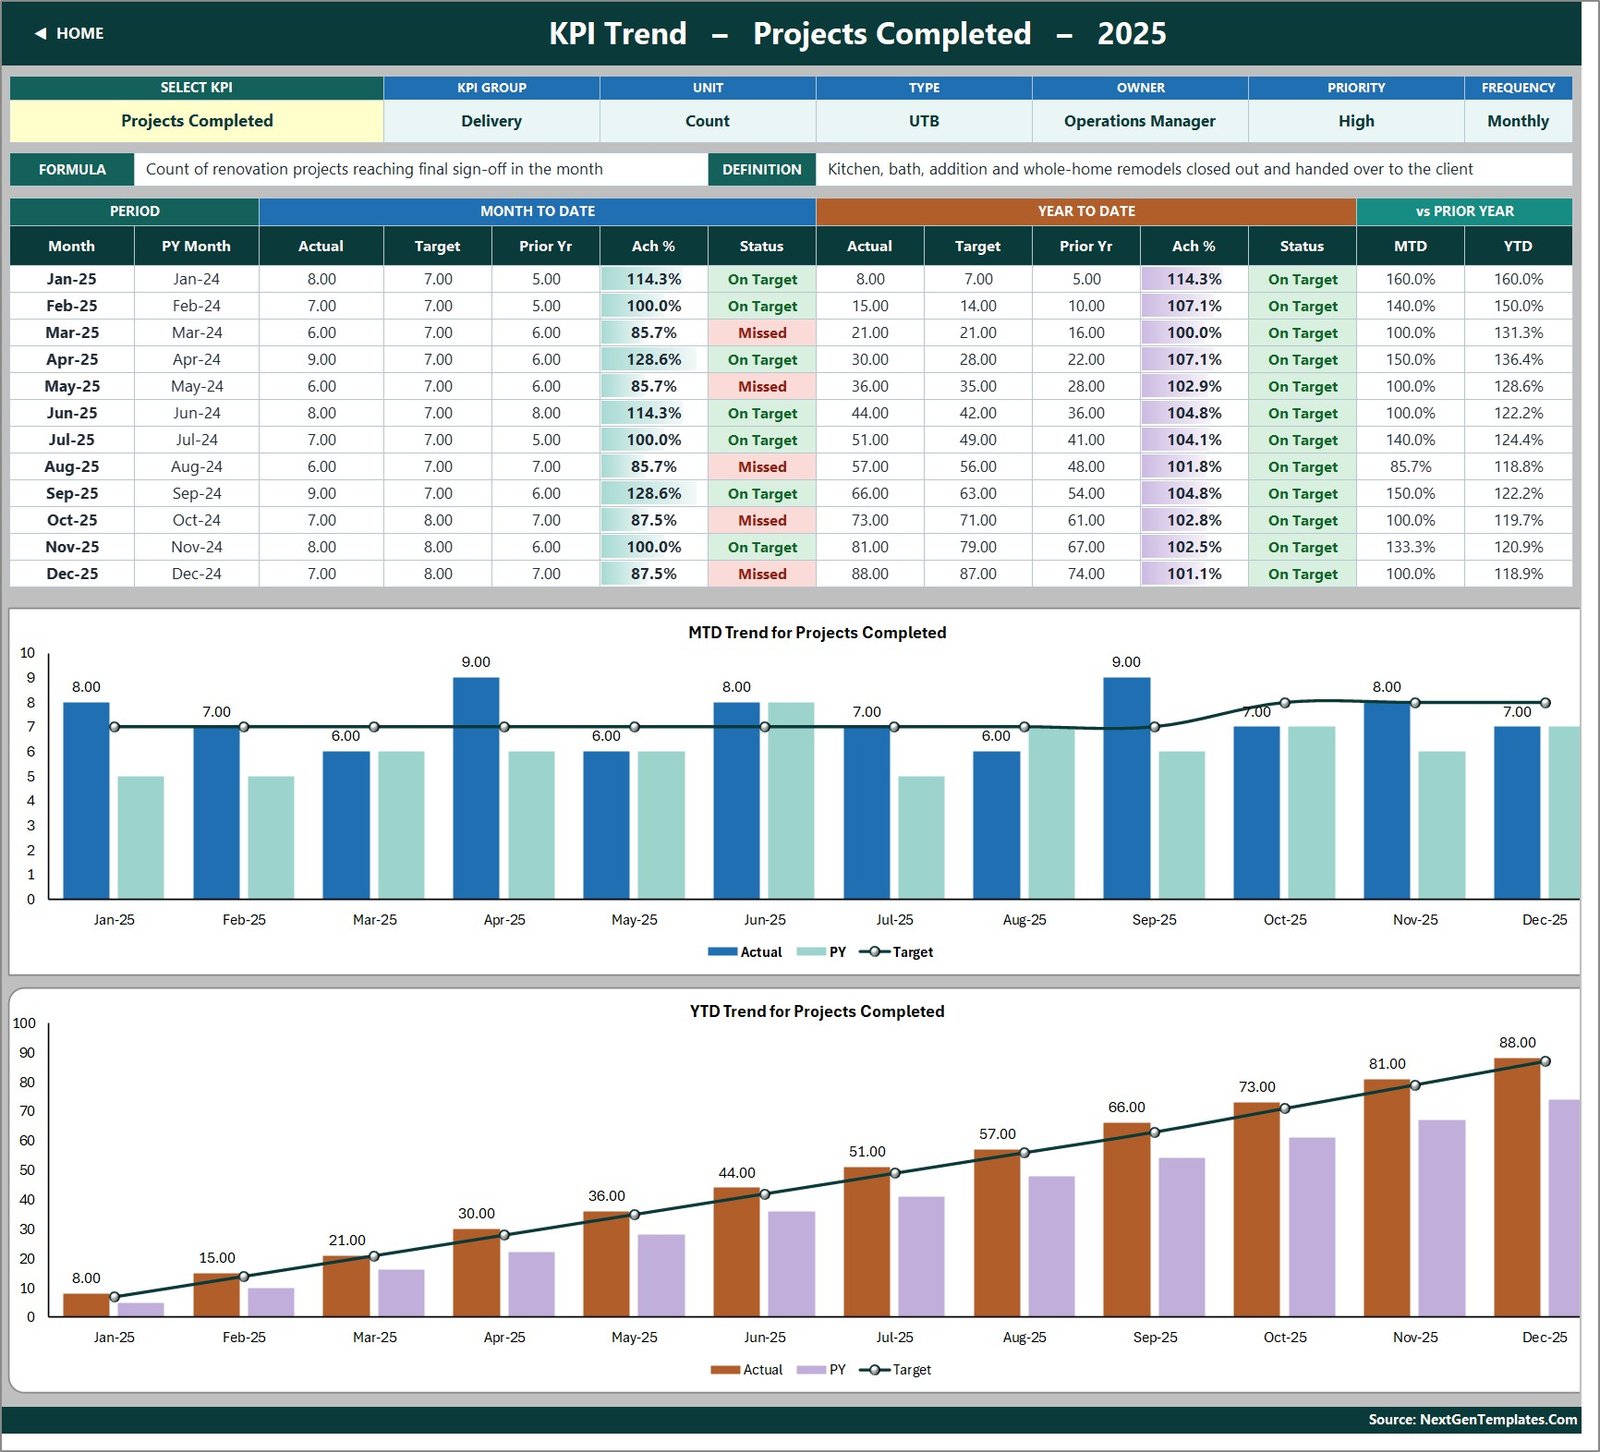
- Three charts. MTD Trend and YTD Trend on the KPI Trend page plot actual and prior-year columns against a target line for whichever KPI you pick; KPI Analysis draws Average YTD Achievement by KPI Group.
- Room for 22 KPIs. Fifteen rows are filled and the rest are live and empty.
Dashboard Pages Explanation
Home
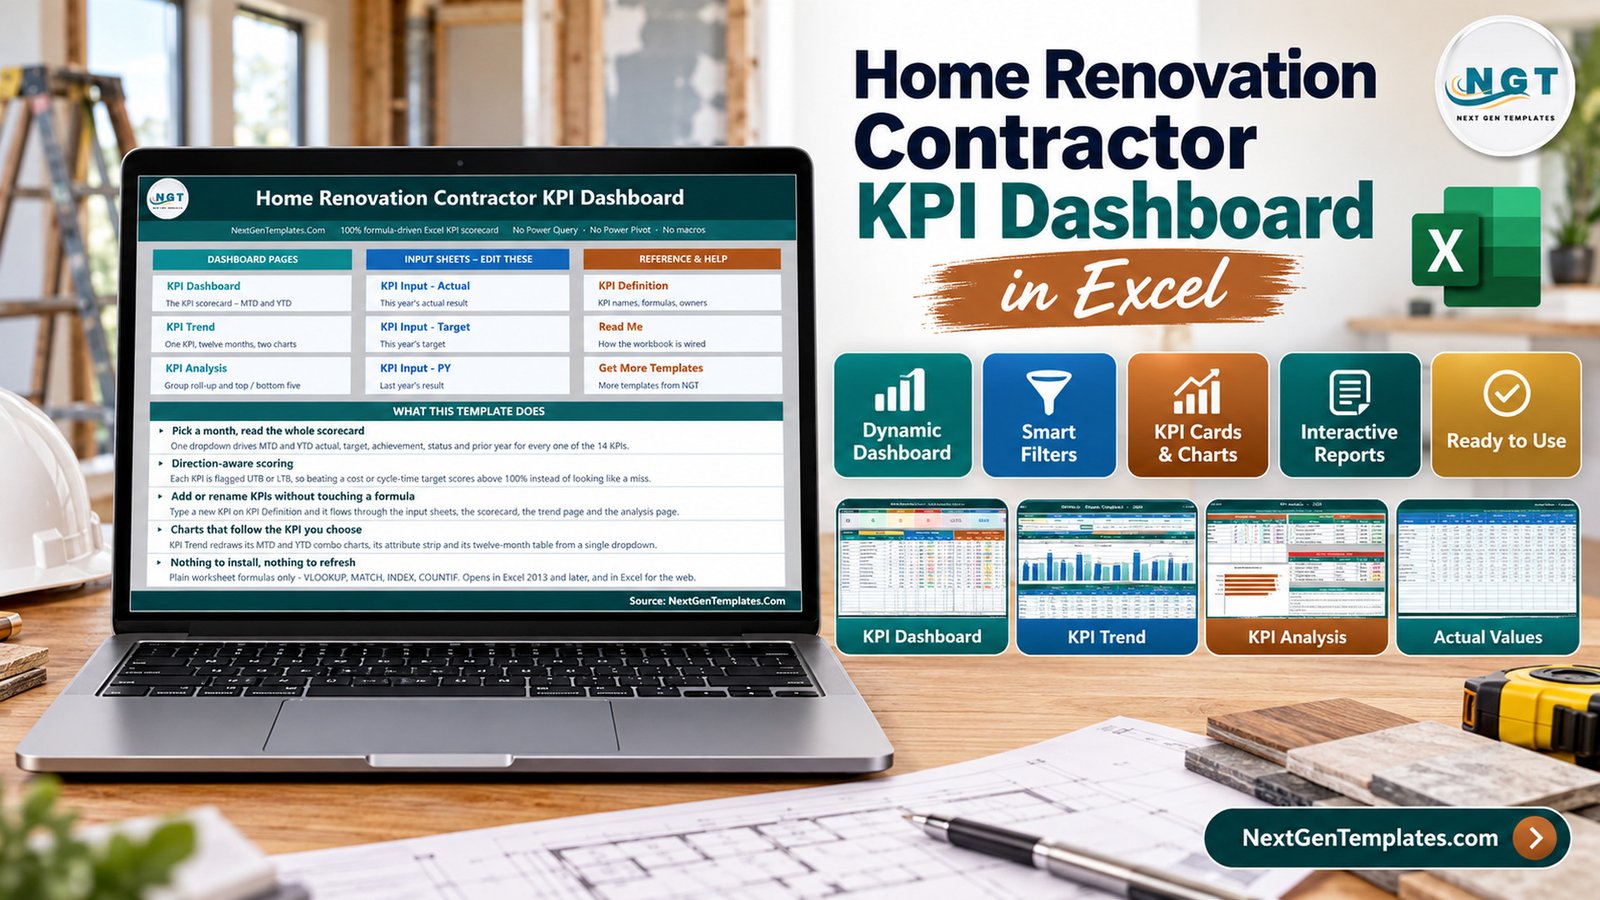
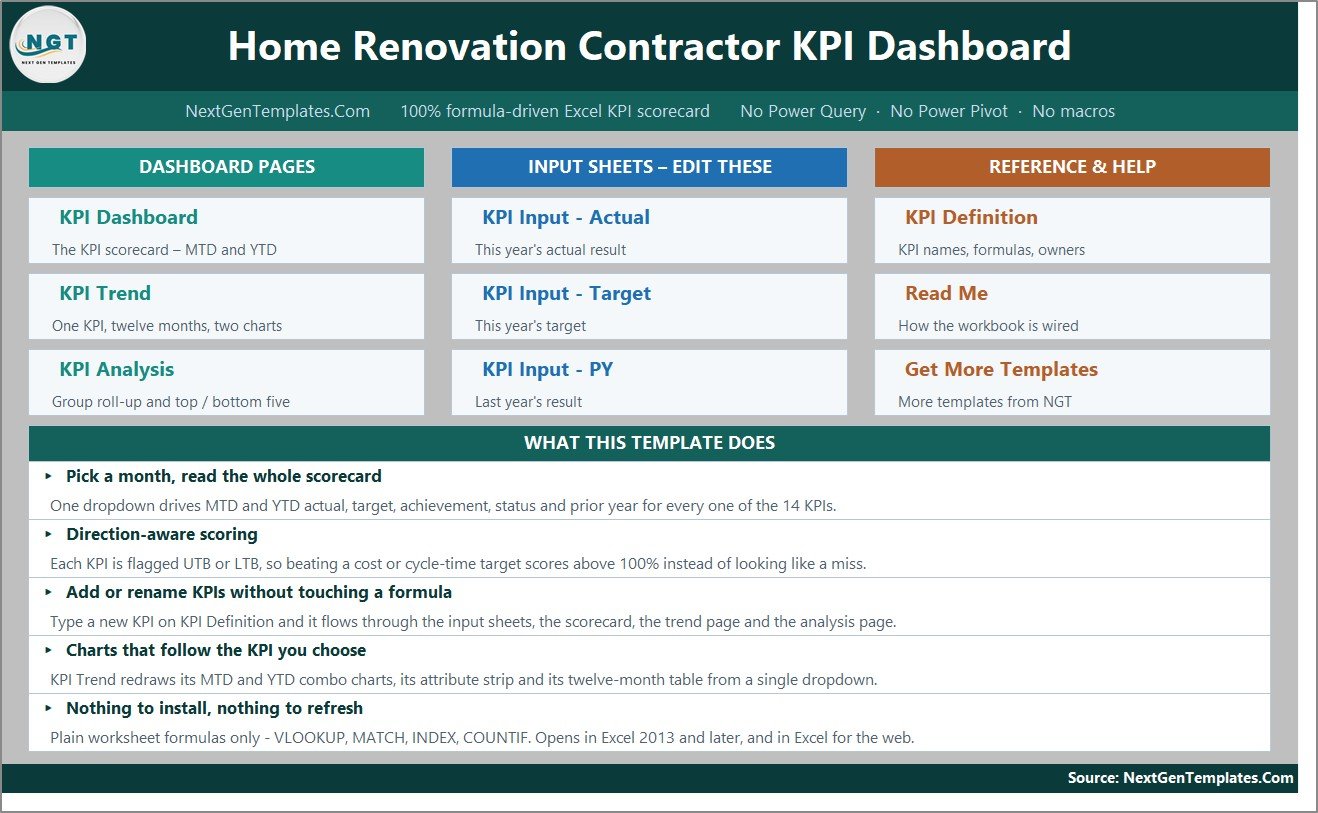
A navigation hub in three card columns – Dashboard Pages, Input Sheets and Reference & Help – above a “What This Template Does” panel covering the month picker, direction-aware scoring, KPI editing and the formula-only build.
KPI Dashboard
Seven summary cards – Total KPIs Tracked, On Target (YTD), At Risk (YTD), Missed (YTD), Improving vs PY (MTD), Avg Achievement (MTD), Avg Achievement (YTD) – sit above one row per KPI, each row split into an MTD block and a YTD block holding Actual, Target, Ach %, Status, Prior Yr and vs PY. On the shipped June 2025 sample those cards read 15, 6, 6, 3, “6 of 15”, 99.0% and 96.7%.
KPI Trend
One KPI at a time. A dropdown selects it, an attribute strip shows group, unit, type, owner, priority and frequency, a twelve-month table lists MTD and YTD actual, target, prior year, achievement and status, and the two combo charts redraw underneath. In the sample the page opens on Projects Completed, whose monthly figures run 8, 7, 6, 9, 6, 8, 7, 6, 9, 7, 8, 7 to a year-end 88.
KPI Analysis
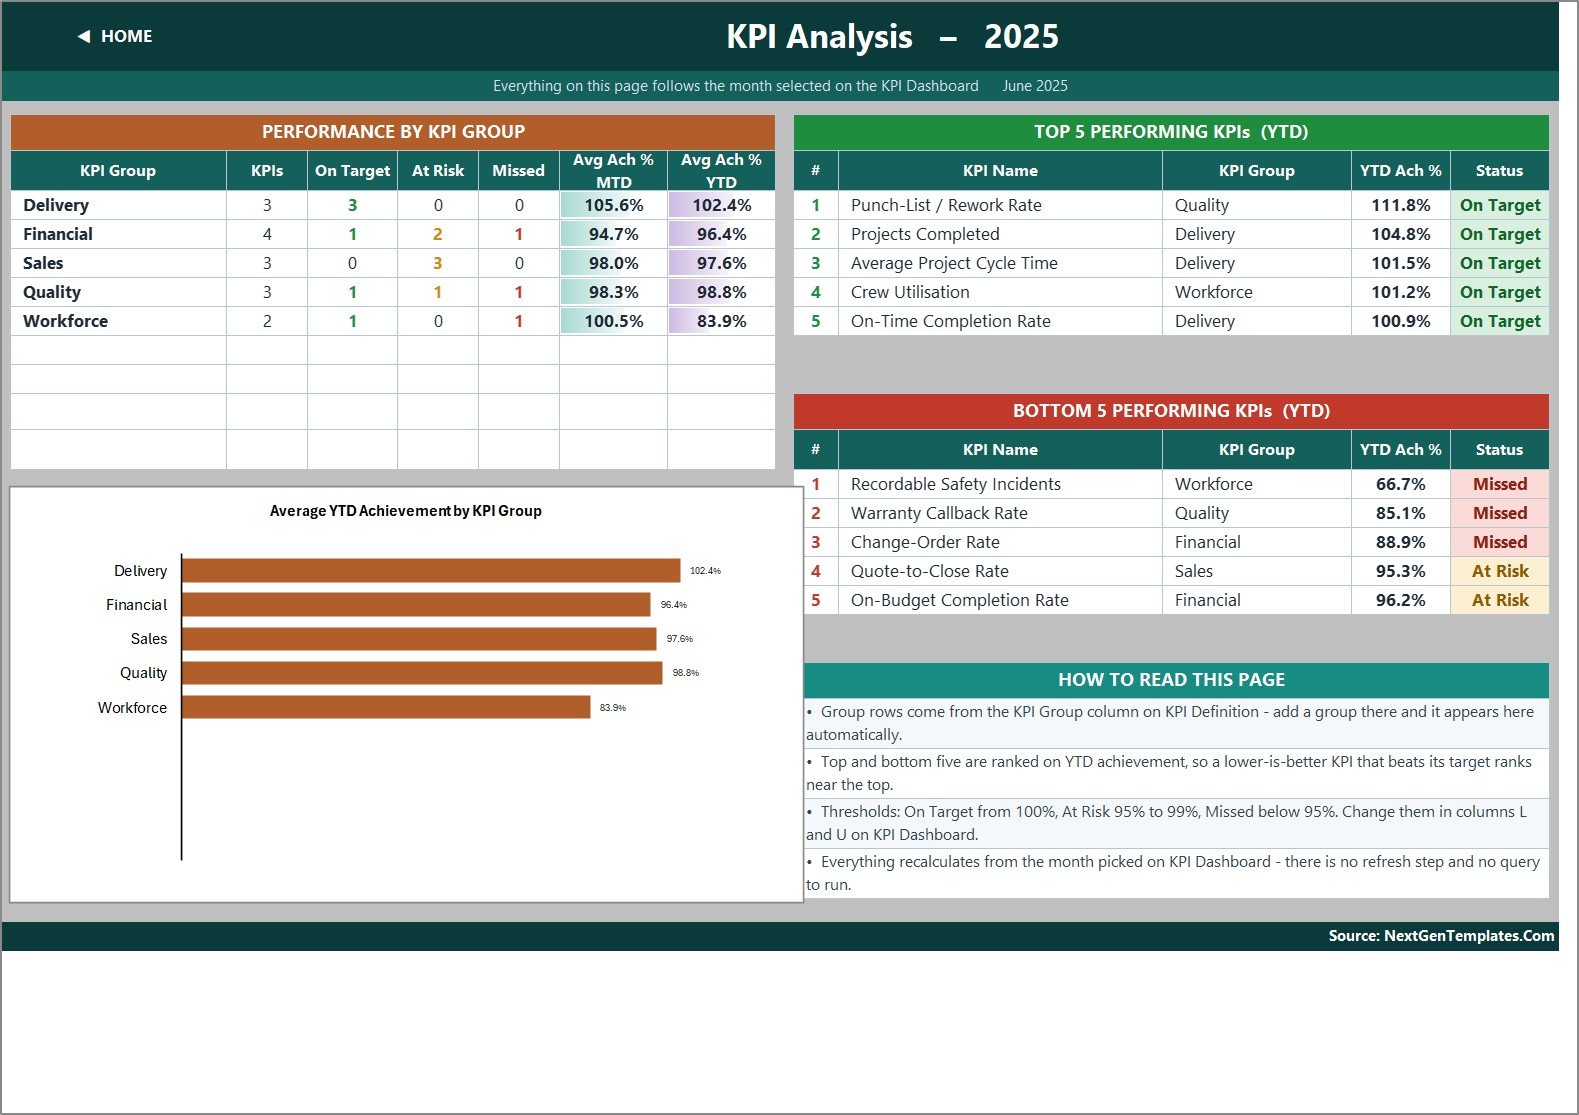
Achievement rolled up by KPI group with On Target, At Risk and Missed counts per group, a bar chart of Average YTD Achievement by KPI Group, and Top 5 and Bottom 5 tables ranked on YTD achievement. On the sample month the top of the list is Punch-List / Rework Rate at 111.8% and the bottom is Recordable Safety Incidents at 66.7%.
The three input sheets and KPI Definition
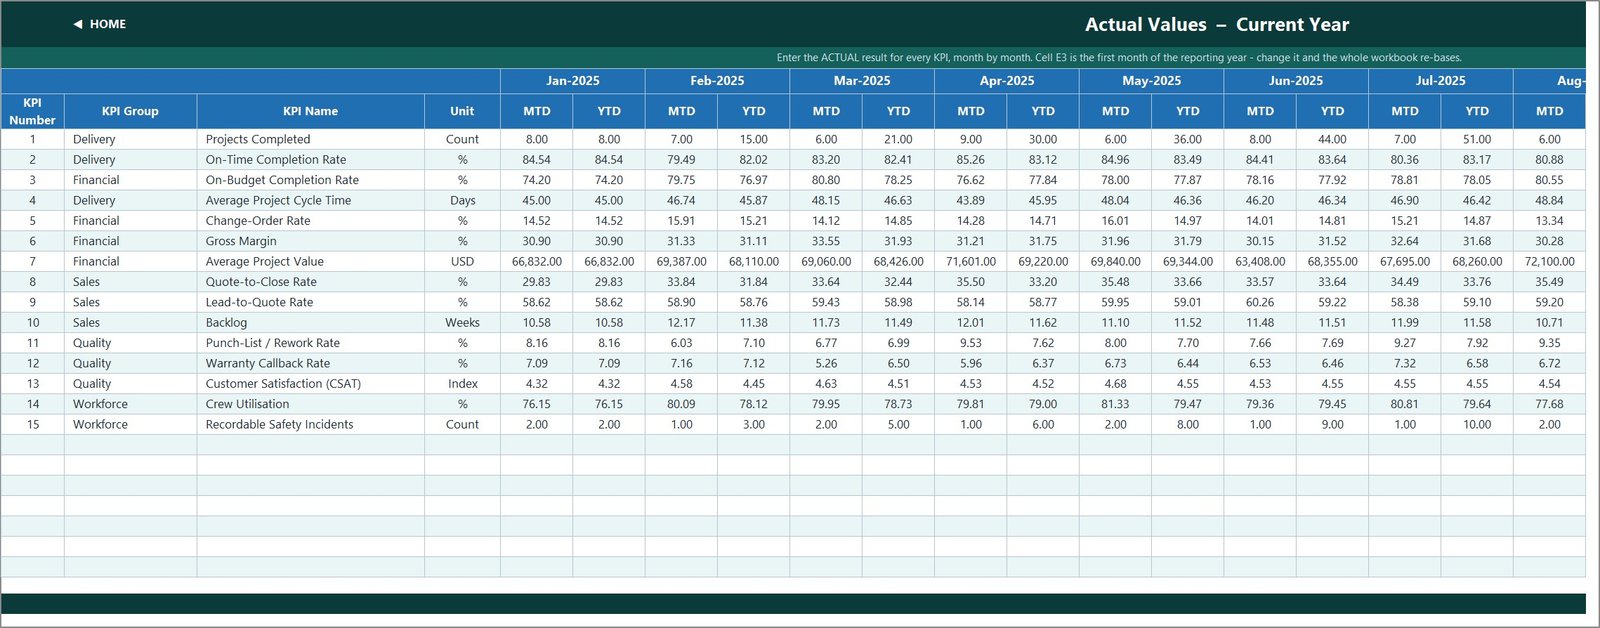
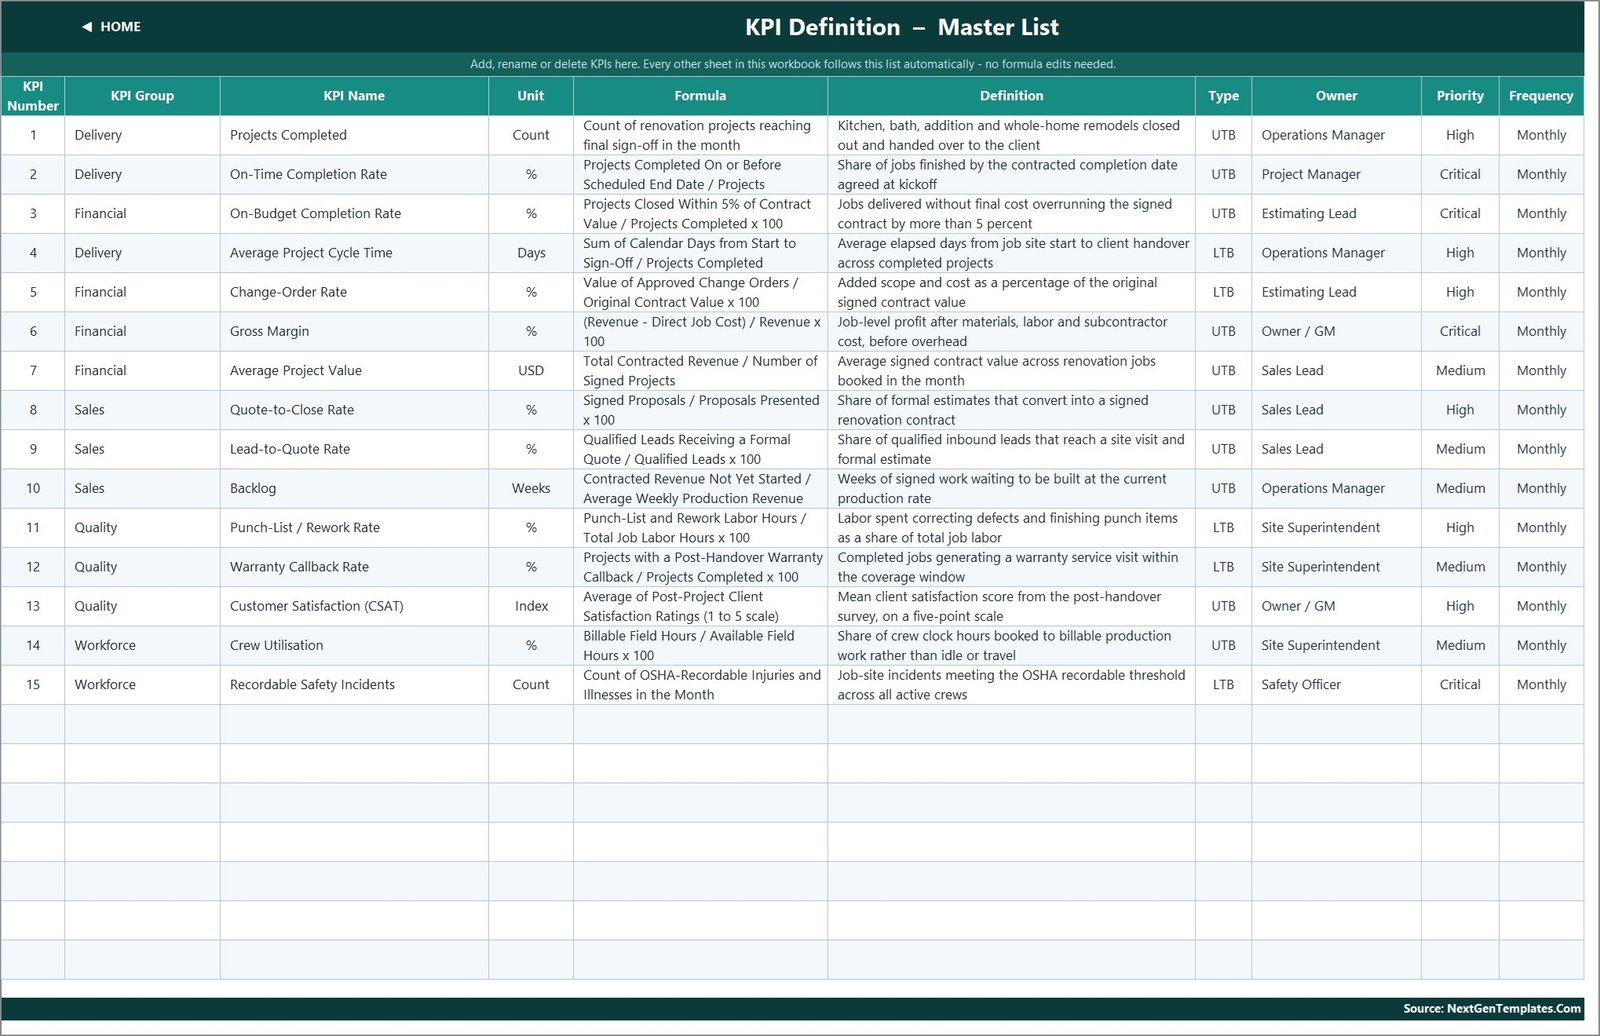
KPI Input – Actual, KPI Input – Target and KPI Input – PY share one grid: a row per KPI and an MTD and a YTD column for each month. Cell E3 on the Actual sheet sets the first month of the reporting year and everything else re-bases from it, including the prior-year headers, which shift back twelve months automatically. KPI Definition is the master list all three read – number, group, name, unit, formula, definition, UTB/LTB type, owner, priority and frequency.
Read Me
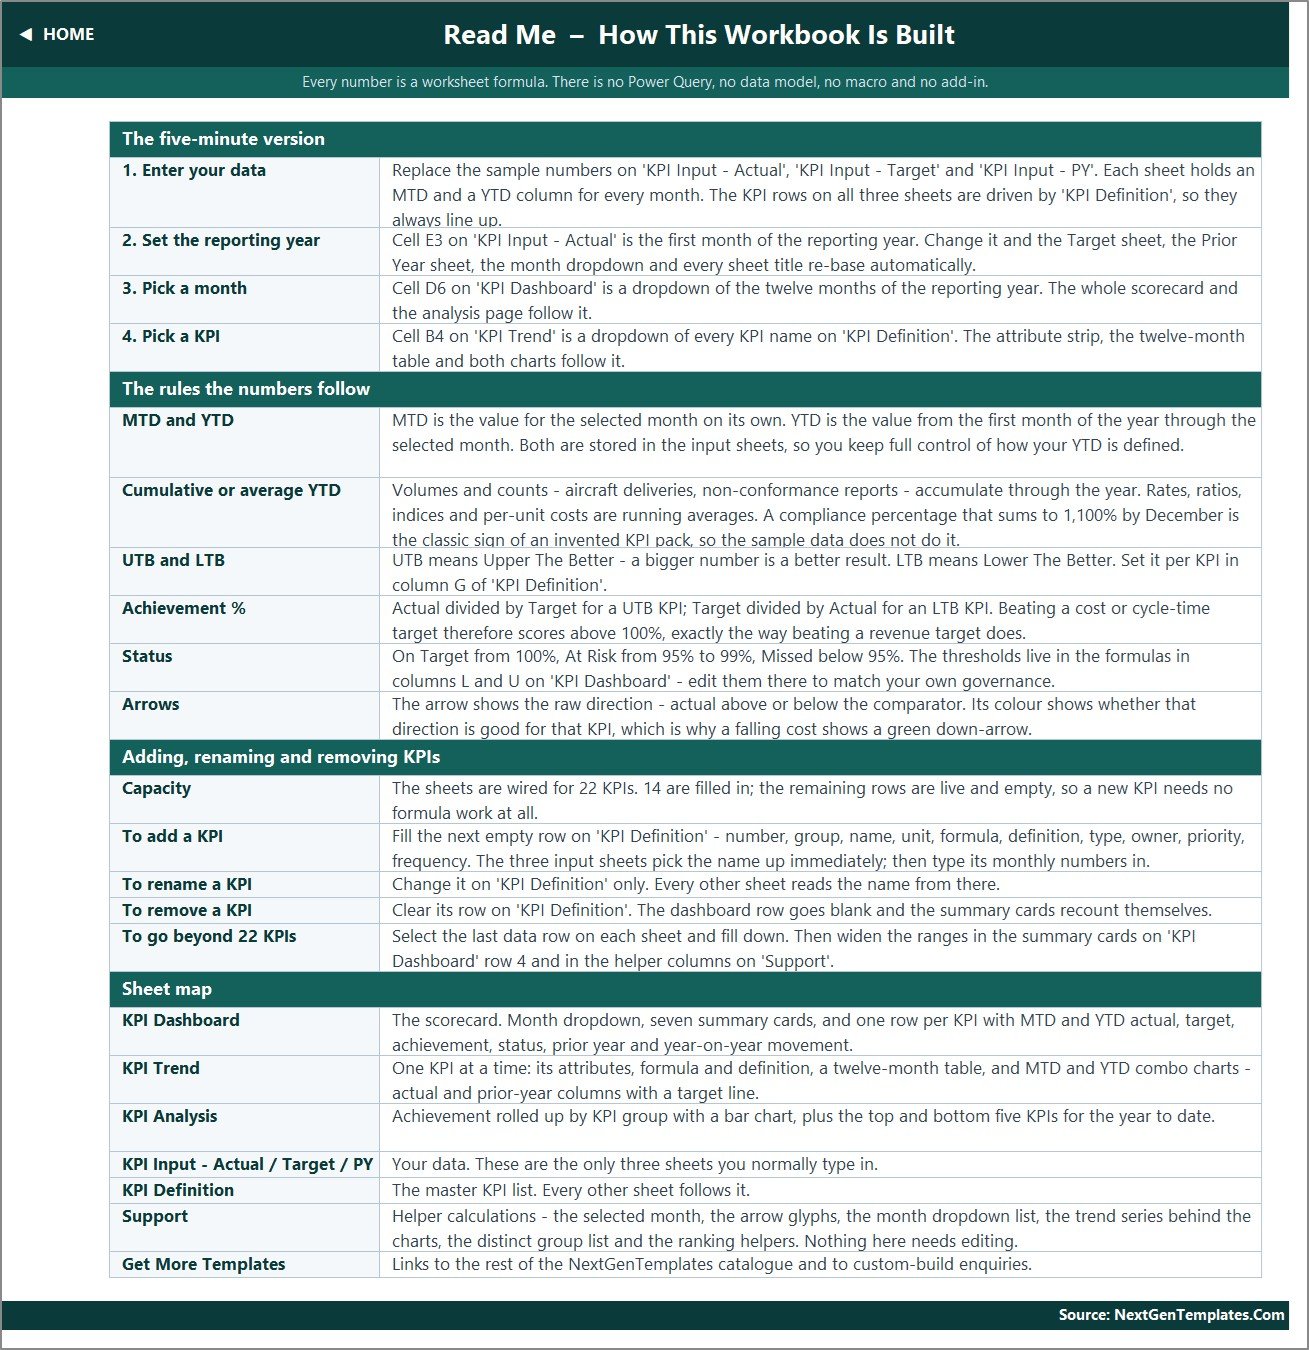
The rules page: the five-minute setup, MTD versus YTD, cumulative versus average YTD, UTB and LTB, the achievement and status formulas, the arrow logic, how to add, rename or remove a KPI, and a sheet-by-sheet map.
Renovation contractor KPI dashboard in Excel vs. a Google Sheets build vs. paid construction SaaS – feature comparison
| Decision point | This Excel workbook | Google Sheets equivalent | Buildertrend / Houzz Pro / CoConstruct |
|---|---|---|---|
| Cost | $12.99 one-time | One-time template price | $99-$499 per month |
| Platform | Excel 2013+ and Excel for the web | Browser only | Web plus mobile apps |
| Setup time | Replace sample numbers on three input sheets | Copy the file, then replace numbers | Implementation, onboarding and data migration |
| Real-time team collaboration | OneDrive / SharePoint co-authoring | Native multi-user editing | Built in |
| Mobile access | Excel mobile app, read-focused | Browser on any device | Native field apps |
| Customisable KPI formulas | Every formula visible and editable | Editable | Fixed reporting modules |
| Share with a link | OneDrive link | Native share link | Client portal |
| Year-1 cost at 5 users | $12.99 | Template price plus any Workspace seats | $1,200-$6,000+ |
| Scheduling, estimating, invoicing, client portal | Not included – reporting only | Not included | Core product |
For a remodelling business that wants a disciplined monthly KPI review without paying per-seat fees for modules it will not use, this workbook sits in the sweet spot – beside, not instead of, whatever estimating or scheduling tool is already in place.
Who Should Use This Template
Perfect for:
- Owner-operators and small remodelling firms running roughly 5-12 jobs a month who already work in Excel.
- Project managers and site superintendents who want schedule, cost, quality and safety on one page.
- Estimating and sales leads who need lead-to-quote and quote-to-close sitting beside delivery metrics.
- Anyone running a recurring owner’s meeting who wants the same layout every month.
Not a fit if:
- You need estimating, bidding or contract generation – this produces nothing customer-ready or binding.
- You need a compliance, permitting, licensing or inspection record.
- You need subcontractors updating status from their phones, GPS job tracking or integrated invoicing.
- You expect the numbers to arrive on their own; every figure here is typed in by you.
Real-World Use Cases
A kitchen-and-bath remodeler closing six jobs a month opens the scorecard before the Monday owner’s meeting. On-Time Completion Rate is On Target but On-Budget Completion Rate is At Risk, so the meeting goes to estimating accuracy rather than to the schedule – a conversation that would not have surfaced from a revenue report.
A site superintendent reads Punch-List / Rework Rate and Warranty Callback Rate as a pair. Rework falling while callbacks climb usually means finishing work is being signed off too early; both sit in the Quality group, so the pattern shows up in one block of rows.
An estimating lead opens KPI Trend on Change-Order Rate and shows twelve months against target and prior year. A single month’s change-order percentage invites an argument; a twelve-month line invites a decision about scoping.
Advantages of the renovation contractor KPI dashboard in Excel
The workbook is a one-time purchase with no per-seat cost, which matters for a trade business where the people who need to see the numbers are not the people who need software licences. Because it is formula-only, every calculation is traceable: you can click any achievement cell and read the arithmetic. Nothing is hidden in a query, a data model or a macro, so it opens on any machine with Excel 2013 or later and in Excel for the web, and it will still open in five years.
Keeping actuals, targets and prior-year values on three separate sheets also makes the numbers auditable before a review. When a figure looks wrong you check one cell on one input sheet rather than unpicking a calculation chain. For general spreadsheet questions, Microsoft’s Excel support pages cover the underlying functions used here.
Opportunities for Improvement
Two copy defects ship in this build and are visible on the page images above. The Home sheet and the Read Me sheet both describe the workbook as covering 14 KPIs while the file actually carries 15 – the Total KPIs Tracked card counts 15 correctly, so it is the prose that is wrong, not the model. And the Read Me row headed “Cumulative or average YTD” still illustrates cumulative measures with “aircraft deliveries, non-conformance reports”, leftover text from an aerospace build with nothing to do with renovation contracting. Both are ordinary text cells and take seconds to correct.
Two cosmetic points beyond that: the scorecard’s value columns all use one #,##0.00 number format, so count KPIs such as Projects Completed and Recordable Safety Incidents render as 8.00 and 1.00; and the fixed row height on KPI Definition clips the longest formula string, so KPI 2 displays “… / Projects” while the cell itself contains “… / Projects Completed x 100”.
Every number was recomputed from the shipped input sheets before this review and it reconciles. All twelve YTD columns on all three input sheets agree with their MTD series – sums for the two count KPIs, running averages for the other thirteen. The 6 / 6 / 3 status counts add to 15, both average-achievement cards are the true means of the fifteen achievement figures, the “6 of 15” improving card matches a direction-aware count, and every group average and both ranking tables on KPI Analysis recompute exactly. There is no wrong denominator, no misplaced unit and no digit-grouping fault on the USD metric.
Best Practices
- Set the reporting year in cell E3 on KPI Input – Actual first. Every sheet title, header and dropdown re-bases from it, so changing it later is cheap but changing it after you have typed a year of data is confusing.
- Edit KPI Definition before you enter numbers. Renaming a KPI later is safe, but re-deciding whether it is UTB or LTB after you have looked at six months of statuses is not.
- Give every KPI a named owner in the definition sheet. A KPI without an owner is a number nobody updates.
- Fill the prior-year sheet even if it is approximate. The vs PY columns and the prior-year series on both trend charts are what turn a snapshot into a trend.
- Delete all the sample rows before the first real review, so nobody quotes a demo figure in a client meeting.
Explore Relevant Templates
If this fits your trade, the same scorecard pattern exists for several adjacent ones: the Elevator Maintenance KPI Dashboard in Excel, the Window and Door Installation KPI Dashboard in Excel, the Glass Installation KPI Dashboard in Excel, the Garage Door Service KPI Dashboard in Excel and the Solar Panel Installation KPI Dashboard in Excel.
Other editions in preparation. Two sibling builds of this same scorecard exist and are still drafts, so they are named here rather than linked: Home Renovation Contractor KPI Dashboard in Power BI (product ID 94798) and Home Renovation Contractor KPI Dashboard in Google Sheets (product ID 94801). A Home Renovation Contractor KPI Scorecard in Excel is also being prepared – that is a different product, a ten-KPI single-page card layout rather than this fifteen-KPI dashboard.
Frequently Asked Questions
Does this make our renovation work compliant or our estimates accurate?
No. The renovation contractor KPI dashboard in Excel is a reporting template over numbers you type in. It does not establish code compliance, permitting, licensing or contract validity, it is not an inspection or safety assessment, and it produces no estimate or bid you can rely on or give to a customer.
Is the data in the file real?
No. Every shipped figure – margins, cycle times, change-order rates, punch-list rates, satisfaction scores and safety counts – is demo data. Replace all of it on the three input sheets before treating any number as a fact about your business.
What KPIs does it track?
Fifteen, in five groups: Projects Completed, On-Time Completion Rate, Average Project Cycle Time, On-Budget Completion Rate, Change-Order Rate, Gross Margin, Average Project Value, Quote-to-Close Rate, Lead-to-Quote Rate, Backlog, Punch-List / Rework Rate, Warranty Callback Rate, Customer Satisfaction, Crew Utilisation and Recordable Safety Incidents.
Can I add my own KPIs?
Yes. The sheets are wired for 22 rows and 15 are used, so seven more need no formula work – type the KPI on KPI Definition and it appears on the input sheets, the scorecard, the trend dropdown and the analysis page. Past 22, fill the last row down and widen the summary-card ranges.
How long does setup take?
Under an hour when your monthly numbers already exist somewhere. Set the reporting year in one cell, edit the KPI Definition rows, then paste twelve months of MTD and YTD values onto the Actual, Target and Prior Year sheets.
Are macros required?
No. There are no macros, no Power Query, no Power Pivot and no add-ins. It is a plain .xlsx of worksheet formulas, so nothing needs enabling and nothing needs refreshing.
How does this compare with Buildertrend or Houzz Pro?
Those are full construction platforms billed monthly, covering estimating, scheduling, invoicing and client portals. This is a one-time reporting layer. It will not run your jobs; it gives you a consistent monthly KPI review alongside whatever system does.
About the Author
Built by PK – Microsoft Certified Professional with 15+ years of Excel, Google Sheets and Power BI experience. Founder of NextGenTemplates, reaching 300K+ subscribers across YouTube channels. Every template is hand-built and tested before release.
Conclusion
A renovation business does not usually fail because nobody looked at revenue. It fails because change orders crept, punch-list hours ate the margin, and nobody put those two facts next to each other in the same month. That is the job this workbook does, and it does it with plain formulas you can read.
Click here to purchase the Home Renovation Contractor KPI Dashboard in Excel.
Instant download · One-time payment · No subscription.
For step-by-step video tutorials, visit Youtube.com/@PK-AnExcelExpert.
Last updated: September 2026.