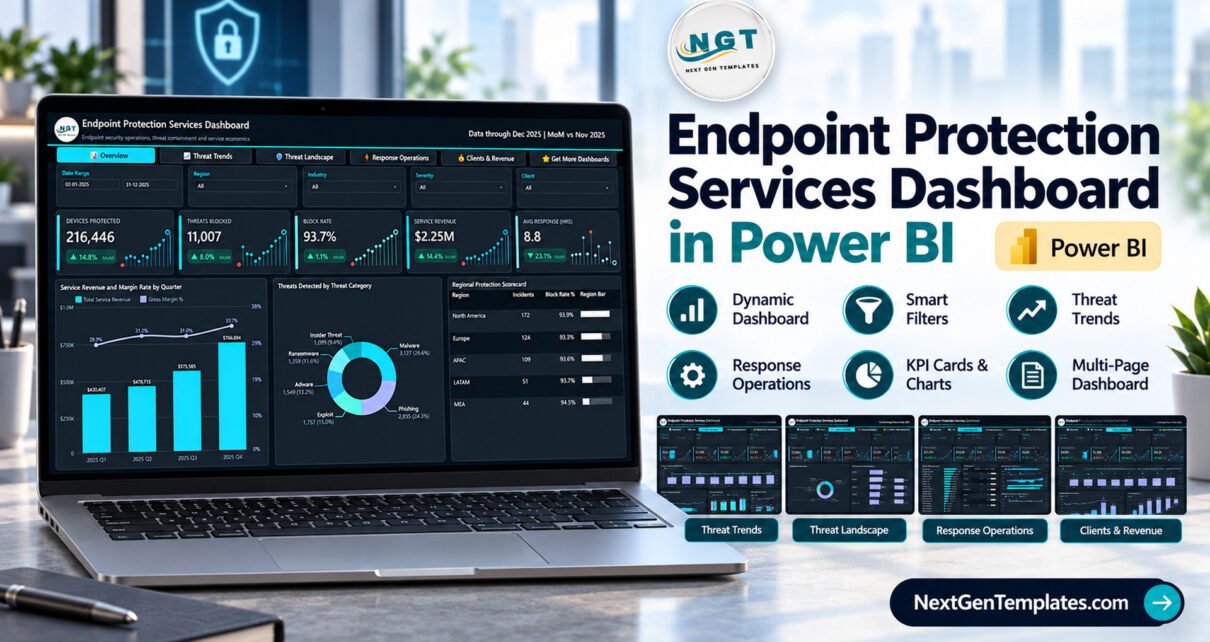
The Endpoint Protection Services Dashboard in Power BI reports on 500 sample service incidents across 20 client accounts, seven industries and five regions. Its five analysis pages carry 25 KPI cards, and the sample shows 11,746 threats detected, a 93.7% block rate, an 8.8-hour average response and $2.25M in service revenue at a 31.6% margin rate.
Security service teams usually hold this information in three places: a ticketing export, an endpoint console report and a finance sheet. This Power BI template brings the three views together, so you can see whether containment is improving, which analysts are stretched and which clients actually make money, all from one refreshable file.
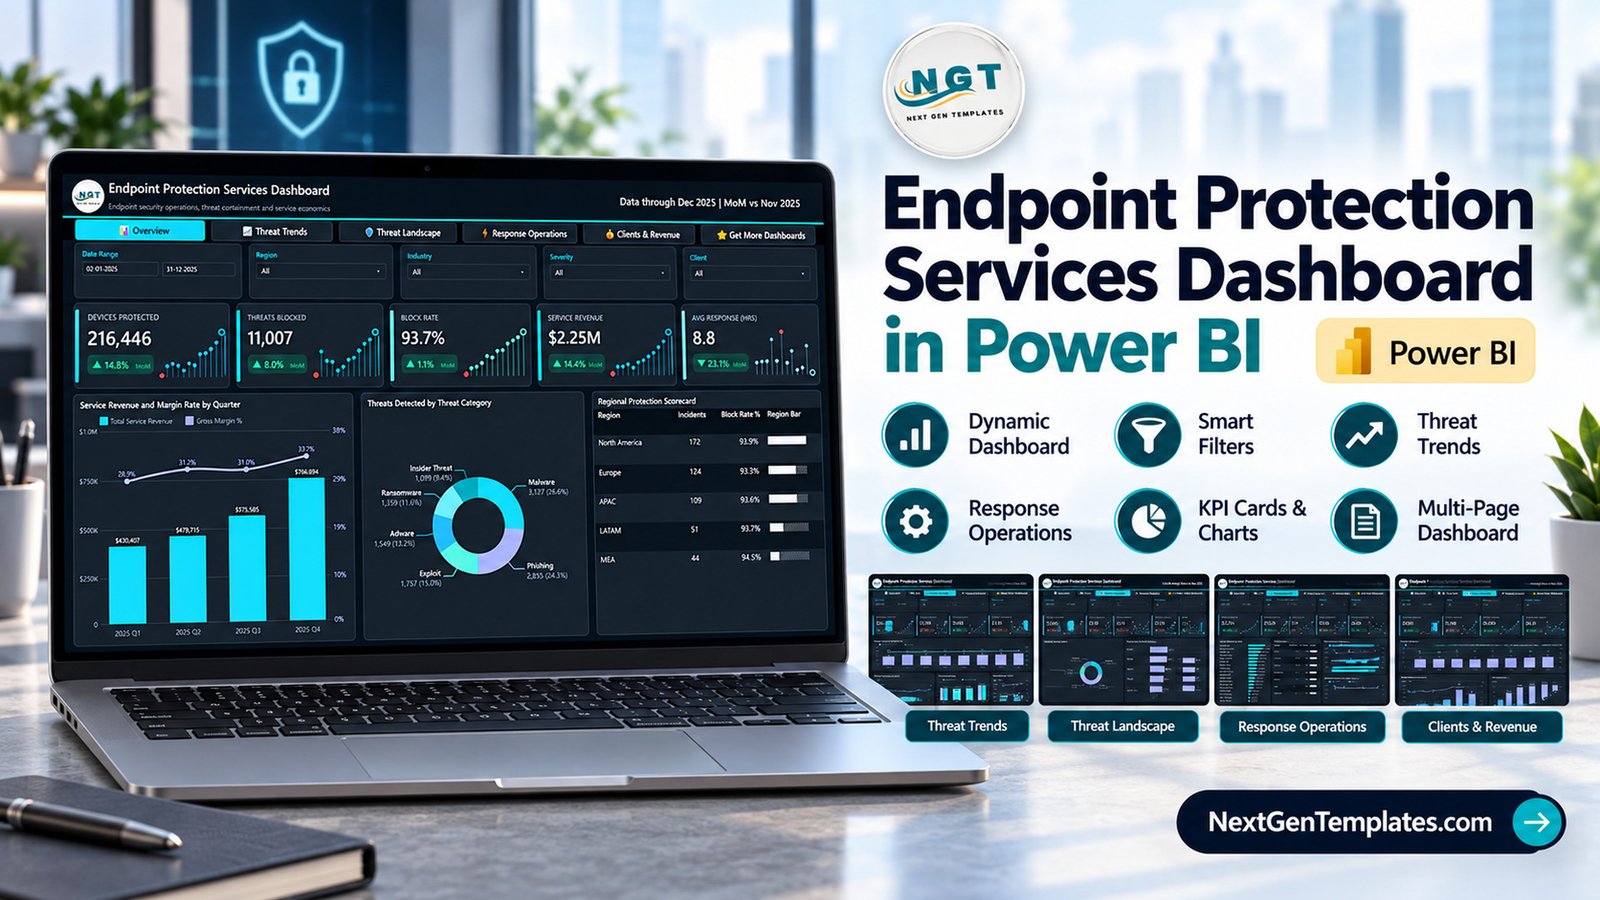
Important: this is a reporting template built on fictional sample data. It does not scan endpoints, detect or block threats, or connect to antivirus or EDR software, and it makes no certification or compliance claim. It analyses the records you give it.
Key Features of Endpoint Protection Services Dashboard in Power BI
- Five linked analysis pages: Overview, Threat Trends, Threat Landscape, Response Operations and Clients & Revenue, plus a Get More Dashboards panel with a page navigation bar across the top.
- Consistent slicer row: Date Range, Region, Industry and Severity on every page, with a fifth page-specific slicer for Client, Threat Category, Detection Method, Analyst or Device Type.
- Month-on-month KPI cards: every card shows the current value, a coloured MoM change badge and a 12-month sparkline. The sample covers January to December 2025 and compares December with November.
- Hidden Details drillthrough page: right-click a client, industry, region, device type or OS platform on any visual to open the underlying incident rows.
- Two tooltip pages: Metric Detail and Trend Detail appear when you hover over visuals, adding context without cluttering the canvas.
- Simple import model: one Excel sheet of 20 columns feeds the whole report, including Incident ID, Service Date, Client, Threat Category, Severity, Detection Method, Analyst, Status, Detection Minutes, Response Hours, Service Revenue and Service Cost.
- Registered custom theme: the dark cyan styling lives in one theme file, so restyling the report for your brand is a quick change.
Dashboard Pages Explanation
Overview
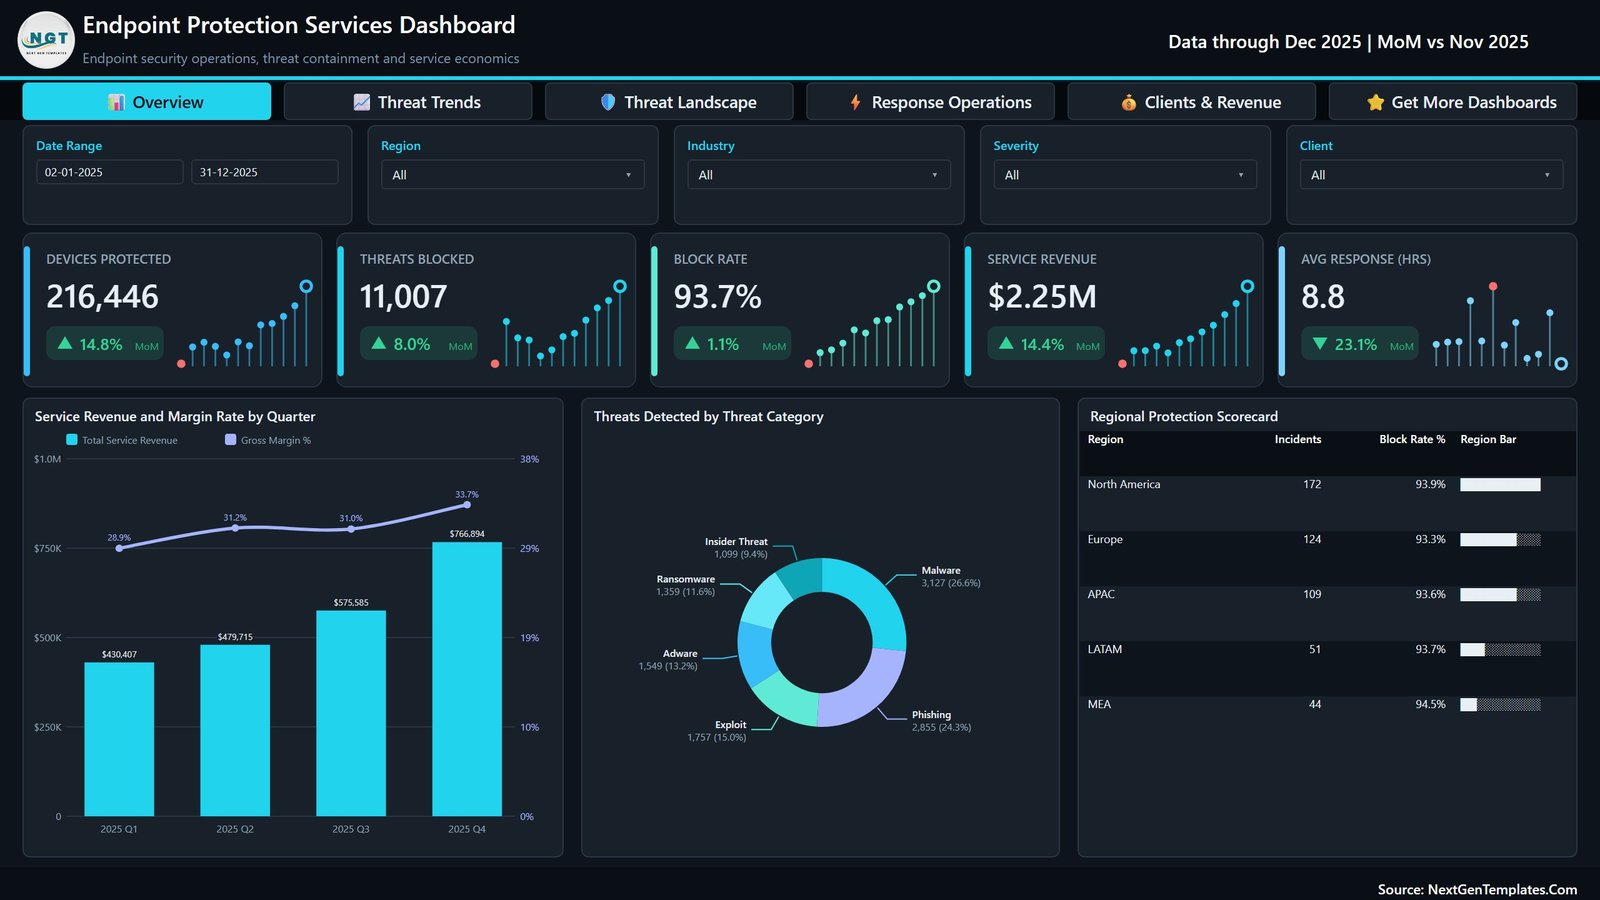
The Overview page shows Devices Protected (216,446), Threats Blocked (11,007), Block Rate (93.7%), Service Revenue ($2.25M) and Avg Response (8.8 hours). Service Revenue and Margin Rate by Quarter shows revenue rising from $430,407 in Q1 to $766,894 in Q4 while margin rate moves from 28.9% to 33.7%. Threats Detected by Threat Category splits volume across Malware, Phishing, Exploit, Adware, Ransomware and Insider Threat, and the Regional Protection Scorecard lists incidents and block rate for North America, Europe, APAC, LATAM and MEA.
Threat Trends
This page shows Incidents Handled (500), Threats Detected (11,746), Threats Blocked, Block Rate and Threats per Incident (23.5). Threats Detected and Block Rate by Month tracks the block rate climbing from 89.2% in January, Devices Protected by Month shows the protected estate growing, Threat Volume by Quarter compares detected and blocked threats, and the Quarterly Threat Scorecard lists incidents, threats missed and block rate for each quarter.

Threat Landscape
The Threat Landscape page shows Threats Detected, Critical Incidents (68), Critical Share (13.6%), Threats Missed (739) and Threats per 1K Devices (54.3). Incidents by Severity splits the 500 incidents into Critical, High, Medium and Low. Threats Detected by Threat Category ranks the six categories, Threat Outcome by OS Platform compares detected and missed threats for Windows, macOS, Linux, iOS and Android, and Incidents by Detection Method covers Behavioral AI, Signature, EDR Telemetry, Cloud Sandbox and Manual Review.

Response Operations
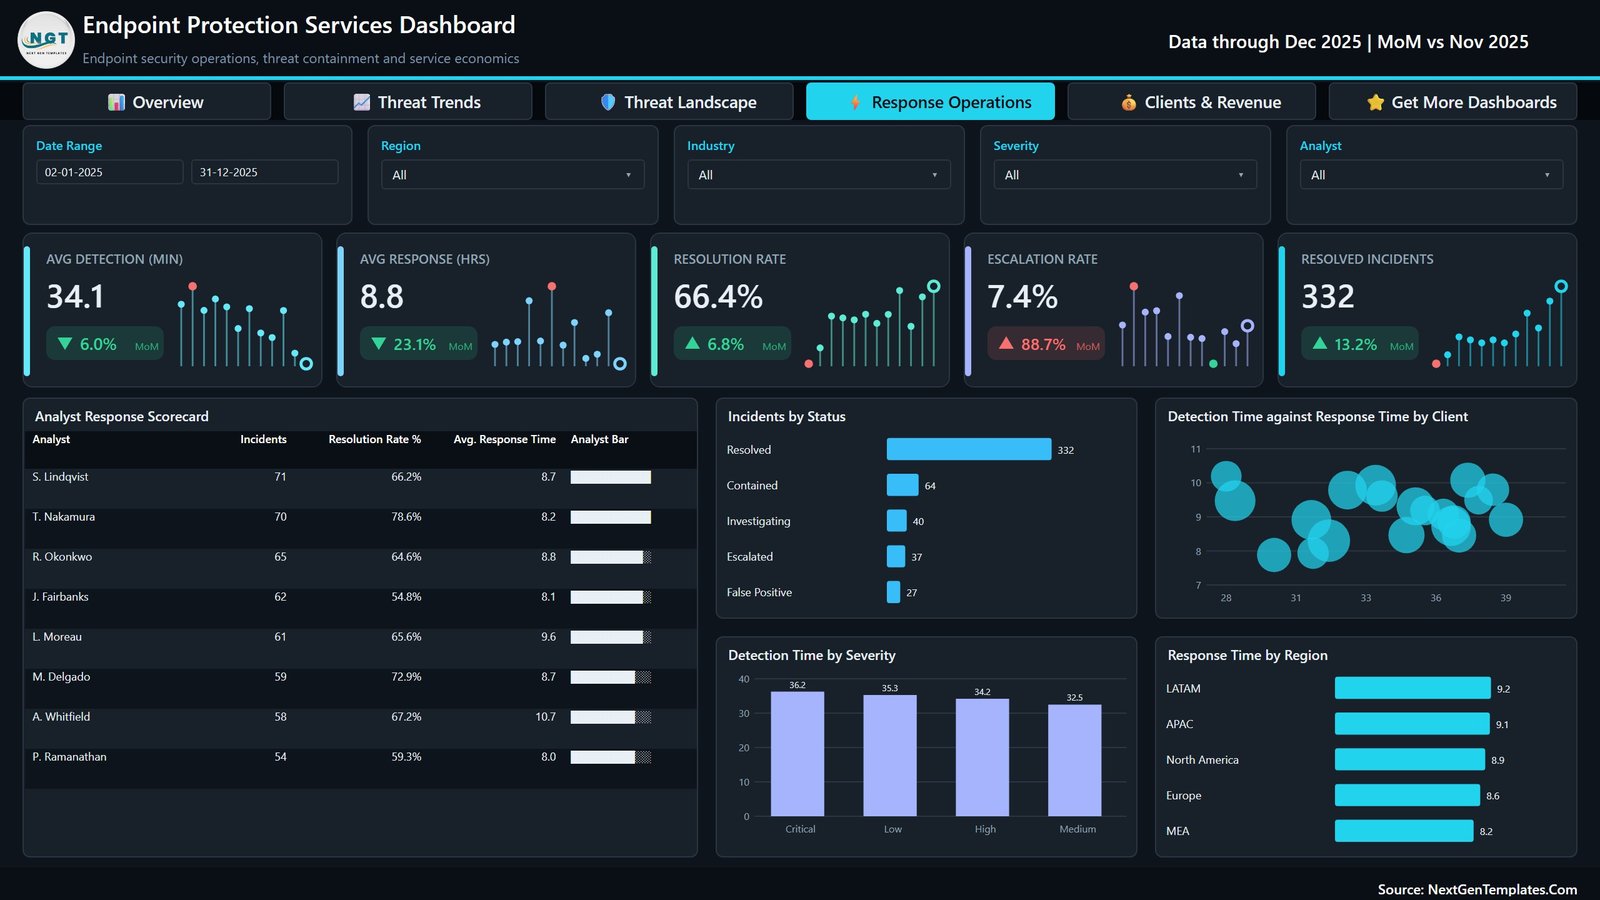
This page shows Avg Detection (34.1 minutes), Avg Response (8.8 hours), Resolution Rate (66.4%), Escalation Rate (7.4%) and Resolved Incidents (332). The Analyst Response Scorecard compares eight analysts on incidents, resolution rate and average response time. Incidents by Status splits work into Resolved, Contained, Investigating, Escalated and False Positive, while Detection Time against Response Time by Client, Detection Time by Severity and Response Time by Region show where delays build up.
Clients & Revenue
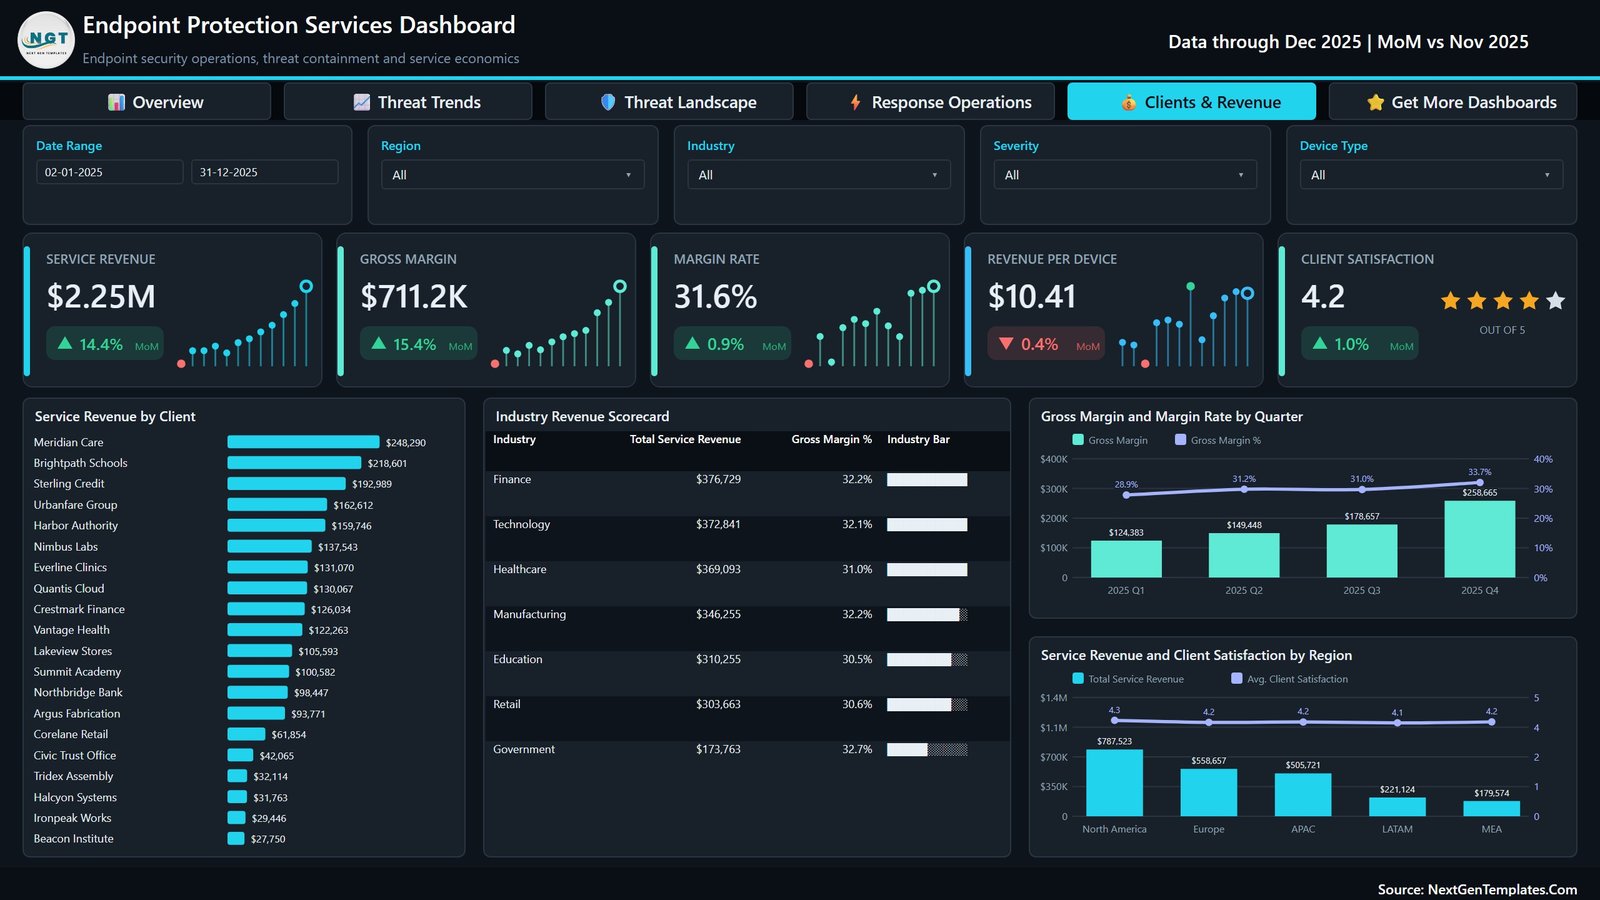
The Clients & Revenue page shows Service Revenue, Gross Margin ($711.2K), Margin Rate (31.6%), Revenue per Device ($10.41) and Client Satisfaction (4.2 out of 5). Service Revenue by Client ranks 20 accounts, the Industry Revenue Scorecard compares revenue and gross margin percentage for seven industries, Gross Margin and Margin Rate by Quarter tracks profitability, and Service Revenue and Client Satisfaction by Region pairs income with satisfaction scores.
Power BI Template vs. Tableau / Qlik vs. PSA and RMM Suites: Feature Comparison
| Feature | Endpoint Protection Services Dashboard in Power BI | Tableau / Qlik build | PSA / RMM reporting suite |
|---|---|---|---|
| Cost | $17.99 one-time | Subscription licence plus build time | Recurring subscription |
| Platform | Power BI Desktop (free, Windows) | Tableau or Qlik | Vendor cloud portal |
| Setup time | Minutes with the sample file | Days to design | Onboarding project |
| Real-time team collaboration | After publishing to a workspace | On server or cloud | Built in |
| Mobile access | Power BI mobile app after publishing | Yes | Yes |
| Customizable fields | Full report and model edit | Yes | Vendor-defined options |
| Share with link | Through Power BI Service licensing | Yes | Client portal |
| Year-1 cost at 5 users | $17.99 plus any Power BI licences you hold | Five subscription seats | Per-seat or per-endpoint fees |
| Threats, response and margin together | Yes, five linked pages | Only if you build it | Often split across modules |
For security service teams that want containment, response and margin reporting without another subscription, this template sits in the sweet spot.
Who Should Use This Template
Perfect for:
- Managed security service providers reporting endpoint work across many client accounts
- IT service managers who review block rate, response time and analyst load every month
- Finance leads at security firms who need margin by client and industry
- Power BI learners studying a multi-page model with drillthrough and tooltip pages
Not a fit if:
- You need antivirus, EDR or threat detection software rather than a report
- You need live streaming from a security console or an audited compliance pack
Real-World Use Cases
Maya runs service delivery at a 12-person managed security provider. Before each monthly client review she filters the report to that client, checks the block rate trend on Threat Trends, and opens Clients & Revenue to confirm the account still earns a healthy margin.
Daniel leads a small internal IT security team. He uses Threat Landscape to show leadership how missed threats split by OS platform and detection method, which helps him argue for extra coverage on the platforms with the most misses.
Priya manages a team of eight analysts. The Analyst Response Scorecard shows her who carries the most incidents and whose resolution rate is slipping, so she can rebalance the queue before response times stretch.
Advantages of Endpoint Protection Services Dashboard in Power BI
- One-time cost: $17.99 on sale instead of another monthly reporting subscription.
- Operations and finance in one file: block rate, response time and gross margin share the same slicers.
- Fast to adopt: the flat 20-column source makes it easy to map a ticketing or console export.
- Built to extend: the model, theme and visuals are fully editable in Power BI Desktop.
- Cross-checked sample: the numbers reconcile, for example 11,746 detected minus 11,007 blocked equals 739 missed, which makes the file a reliable learning model.
Opportunities for Improvement
- The model is a single flat table, so client details such as contract value or seat count need a separate lookup table if you want them.
- There is no SLA target column, so the report shows response time but not SLA attainment against a contracted target.
- MoM badges compare only the latest month with the month before; year-over-year comparison would need extra measures.
- Data arrives by refreshing an Excel file, not by a direct connector to a security console.
- Power BI Desktop runs on Windows, and sharing through Power BI Service follows Microsoft licensing.
Best Practices
- Keep one row per incident and use the exact column headers so every measure keeps working.
- Record Detection Minutes and Response Hours consistently from the same clock events.
- Enter Service Cost alongside revenue for every row, or the margin figures will overstate profit.
- Refresh monthly and export the Overview page as a PDF for client reviews.
- Read Microsoft’s guide to drillthrough in Power BI Desktop before adding your own drill targets.
Explore Relevant Templates
- Also available as: Endpoint Protection Services Dashboard in Excel, with its own walkthrough in our post on the Excel edition of this dashboard.
- Cyber Risk Management Dashboard in Power BI for risk exposure reporting.
- Cybersecurity Startups Dashboard in Power BI for growth and revenue analysis.
- Cybersecurity Incident KPI Dashboard in Power BI for a month-picker KPI view of incidents.
- Cybersecurity Service Management System Web App to run service jobs day to day.
Frequently Asked Questions
What does the Endpoint Protection Services Dashboard in Power BI measure?
It measures devices protected, threats detected, blocked and missed, block rate, detection and response times, resolution and escalation rates, service revenue, gross margin, revenue per device and client satisfaction, across five pages filtered by date, region, industry and severity.
Does this template detect threats or protect devices?
No. It is a Power BI report over an Excel table of service records. It does not install on endpoints, scan files or link to antivirus or EDR tools, and it makes no certification or compliance claim. You supply records exported from your own systems.
How long does setup take?
The sample file opens ready to explore. Mapping your own incidents into the 20 source columns and pressing Refresh usually takes under an hour, depending on how clean your export is. The standard pages need no DAX editing.
How does it compare with a PSA or RMM reporting module?
A PSA or RMM suite runs operations on a recurring fee. This template costs $17.99 once and focuses on reporting, combining containment, response speed and service margin in one editable Power BI file.
What software do I need?
Power BI Desktop, which Microsoft offers free for Windows, and Excel or another tool that edits .xlsx files. Sharing through Power BI Service follows Microsoft’s licensing rules.
Can I add my own clients, analysts and regions?
Yes. Clients, industries, regions, analysts, severities and detection methods all come from the data, so new values appear in the slicers and charts automatically after a refresh.
About the Author
Built by PK — Microsoft Certified Professional with 15+ years of Excel, Google Sheets, and Power BI experience. Founder of NextGenTemplates, reaching 300K+ subscribers across YouTube channels. Every template is hand-built and tested before release.
Conclusion
If your team sells or runs endpoint security services, this Power BI template gives you one place to review containment, response performance and client profitability each month, without adding a subscription or building a report from scratch.
Click here to Purchase the Endpoint Protection Services Dashboard in Power BI
Instant download · One-time payment · No subscription
Watch more tutorials at Youtube.com/@PKAnExcelExpert
Last updated: September 2026