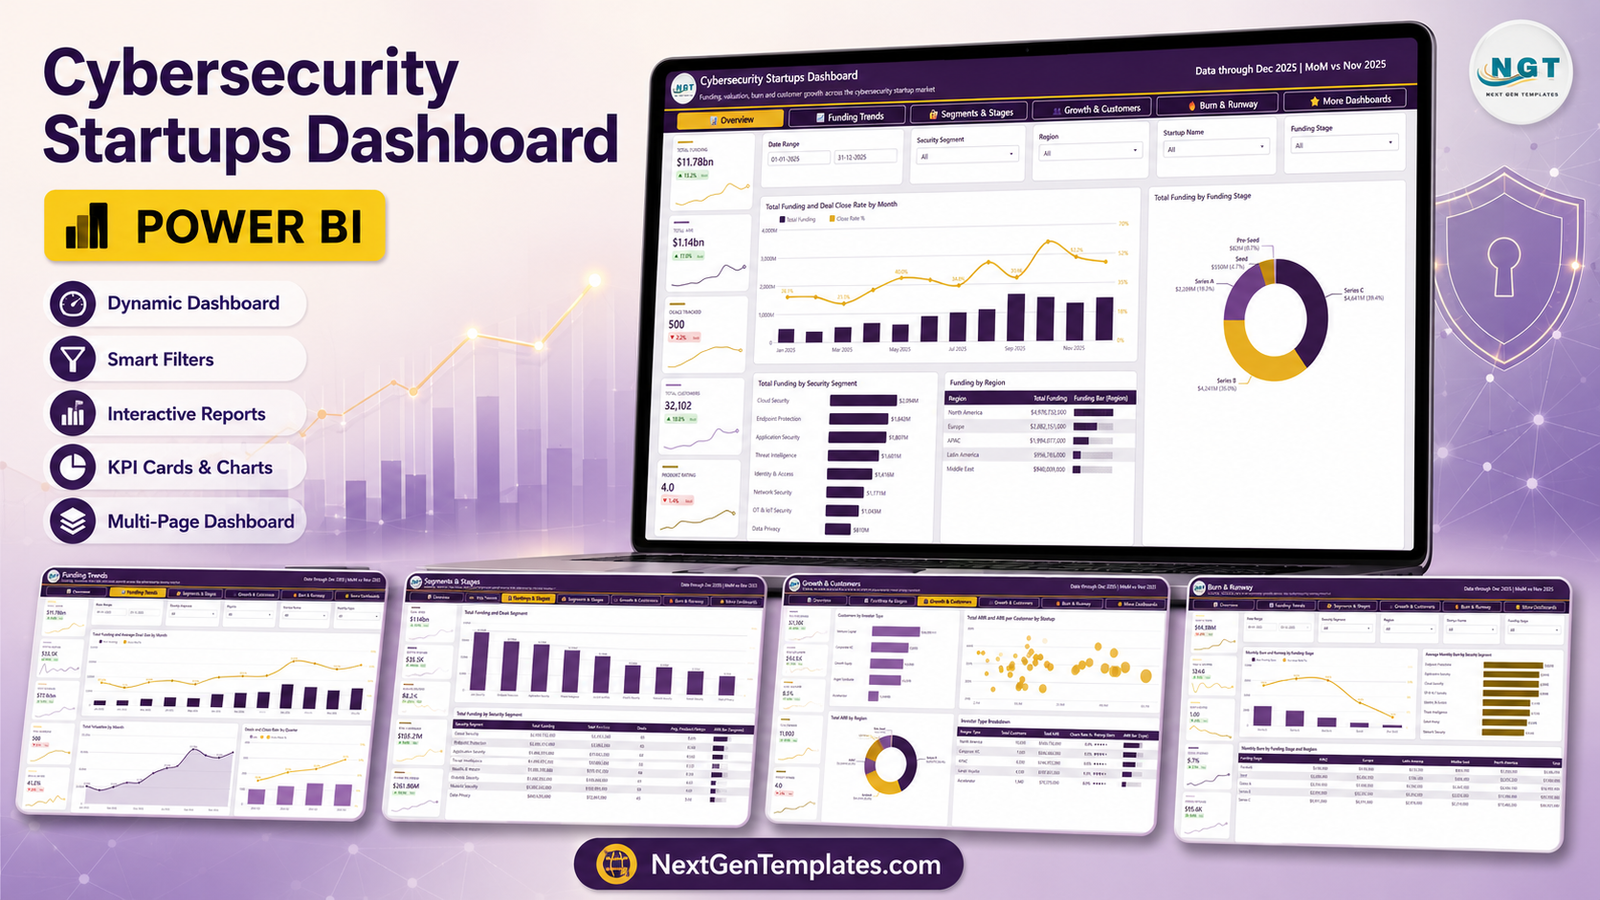
The Cybersecurity Startups Dashboard in Power BI is a finished .pbix report that takes a flat list of security-startup funding rounds and turns it into a five-page investor view. Out of the box it reads $11.78bn of tracked funding, $77.61bn of aggregate valuation, $1.14bn of ARR and 500 sample deals, spread across 8 security segments, 5 funding stages, 5 regions, 5 investor types and 5 deal statuses. Nineteen distinct KPI cards, seventeen charts and tables, four synced slicers and a hidden drillthrough page are wired up before you open it.
Two things to be clear about up front, because the topic invites the wrong assumption. First, this is a market and portfolio analytics report about cybersecurity companies – it does not monitor threats, vulnerabilities, CVEs, patch status, SIEM alerts or compliance controls, and it says nothing about your own security posture. Second, the 500 rows are realistic sample records, not live market data; there is no Crunchbase, PitchBook or CB Insights connection. You replace them with your own pipeline or portfolio and refresh. Cybersecurity Startups Dashboard in Power BI
Key Features of the Cybersecurity Startups Dashboard in Power BI
- Five analysis pages – Overview, Funding Trends, Segments & Stages, Growth & Customers and Burn & Runway, reached from a navigation strip at the top of every page, plus a closing Get More Dashboards page.
- 19 distinct KPI cards filling 25 card slots – Total Funding, Total ARR, Deals Tracked, Total Customers, Product Rating, Avg Deal Size, Total Valuation, Deal Close Rate, ARR per Customer, Valuation Multiple, Avg Valuation, Funding per Startup, Customer Churn, Total Headcount, Monthly Burn, Runway (Months), Burn Multiple, Capital Efficiency and ARR per Employee.
- A MoM delta and a sparkline on every card – the arrow compares the current month with the prior one, and the 12-point trend line underneath keeps a single figure from being read out of context.
- Six slicers on each page – Date Range, Security Segment, Region and Startup Name are synced across all five pages; the sixth slot swaps to Funding Stage, Deal Status or Investor Type depending on what the page is for.
- A hidden Details drillthrough page – defined on six fields (Startup Name, Security Segment, Funding Stage, Region, Investor Type, Deal Status), so a right-click on almost any visual lands on the underlying rows.
- Two hidden tooltip pages – Metric Detail and Trend Detail, both 280×360, replace the default single-line hover tooltip with a small chart.
- 37 DAX measures referenced by the visuals – all named in plain English, so the model doubles as a worked DAX example.
- 500 sample deal records in 16 columns – Deal ID, Date, Startup Name, Security Segment, Funding Stage, Region, Investor Type, Deal Status, Funding Raised, Valuation, ARR, Customer Count, Customers Churned, Headcount, Monthly Burn and Product Rating. Cybersecurity Startups Dashboard in Power BI
Dashboard Pages Explanation
Page 1 – Overview
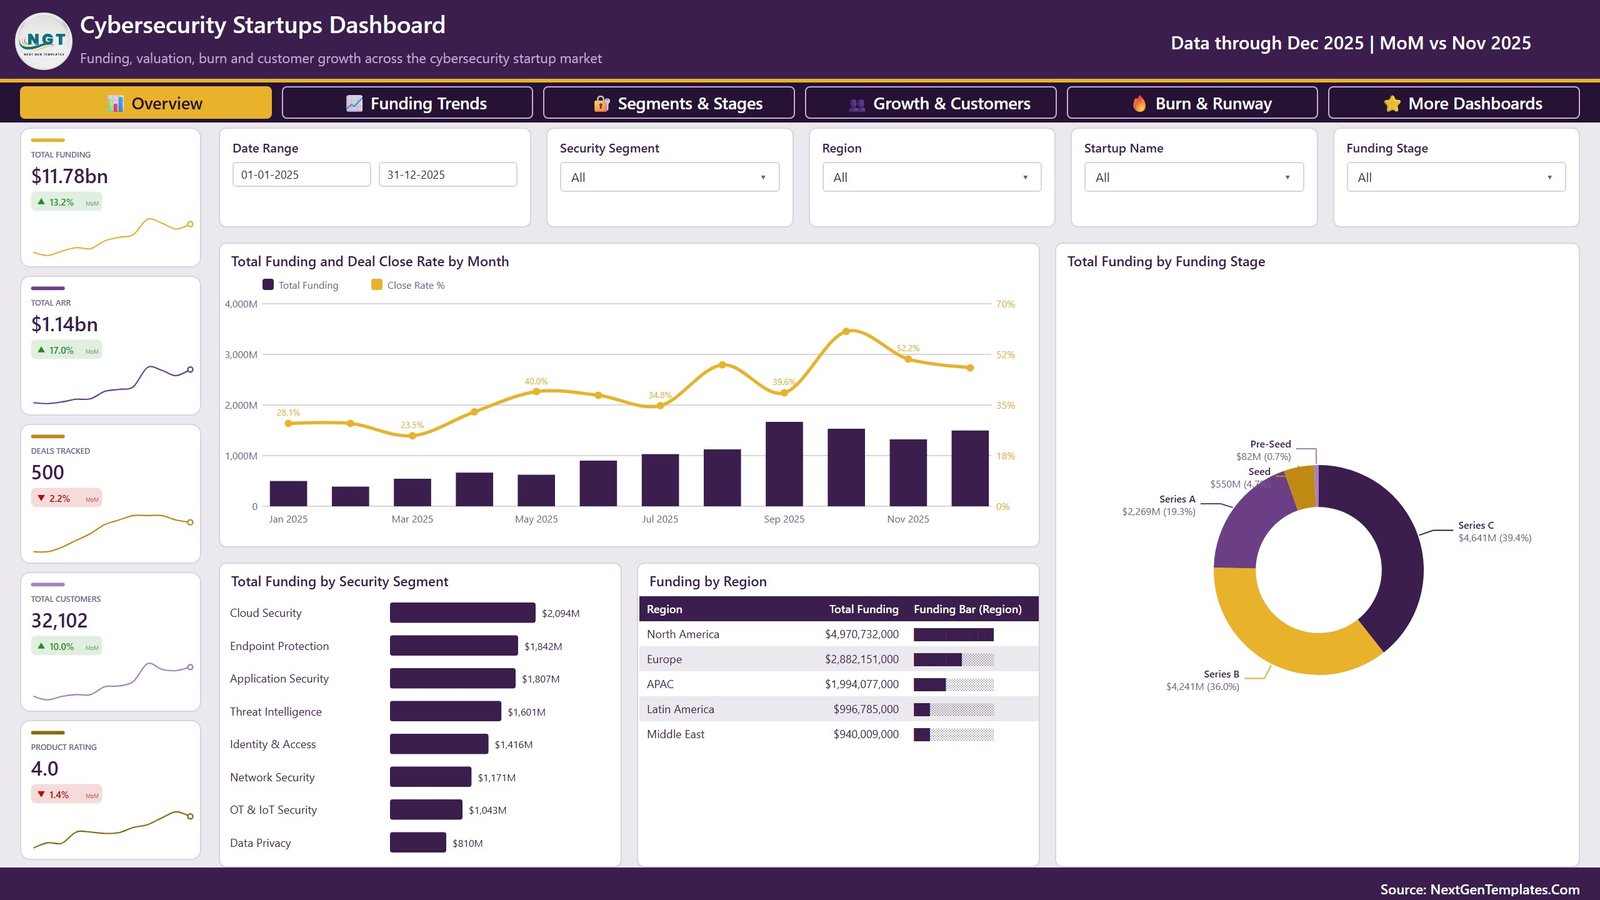
Total Funding $11.78bn (up 13.2% MoM), Total ARR $1.14bn (up 17.0%), Deals Tracked 500 (down 2.2%), Total Customers 32,102 (up 10.0%) and Product Rating 4.0 (down 1.4%) run down the left rail. The centre combo chart, Total Funding and Deal Close Rate by Month, plots funding bars against a close-rate line that climbs from 28.1% in January to 52.2% by November. On the right, Total Funding by Funding Stage splits the pot into Series C $4,641M (39.4%), Series B $4,241M (36.0%), Series A $2,269M (19.3%), Seed $550M (4.7%) and Pre-Seed $82M (0.7%). Below, Total Funding by Security Segment ranks Cloud Security $2,094M above Endpoint Protection $1,842M and Application Security $1,807M, down to Data Privacy $810M, and a Funding by Region table with inline data bars gives North America $4.97bn against Europe $2.88bn and APAC $1.99bn. Cybersecurity Startups Dashboard in Power BI
Page 2 – Funding Trends
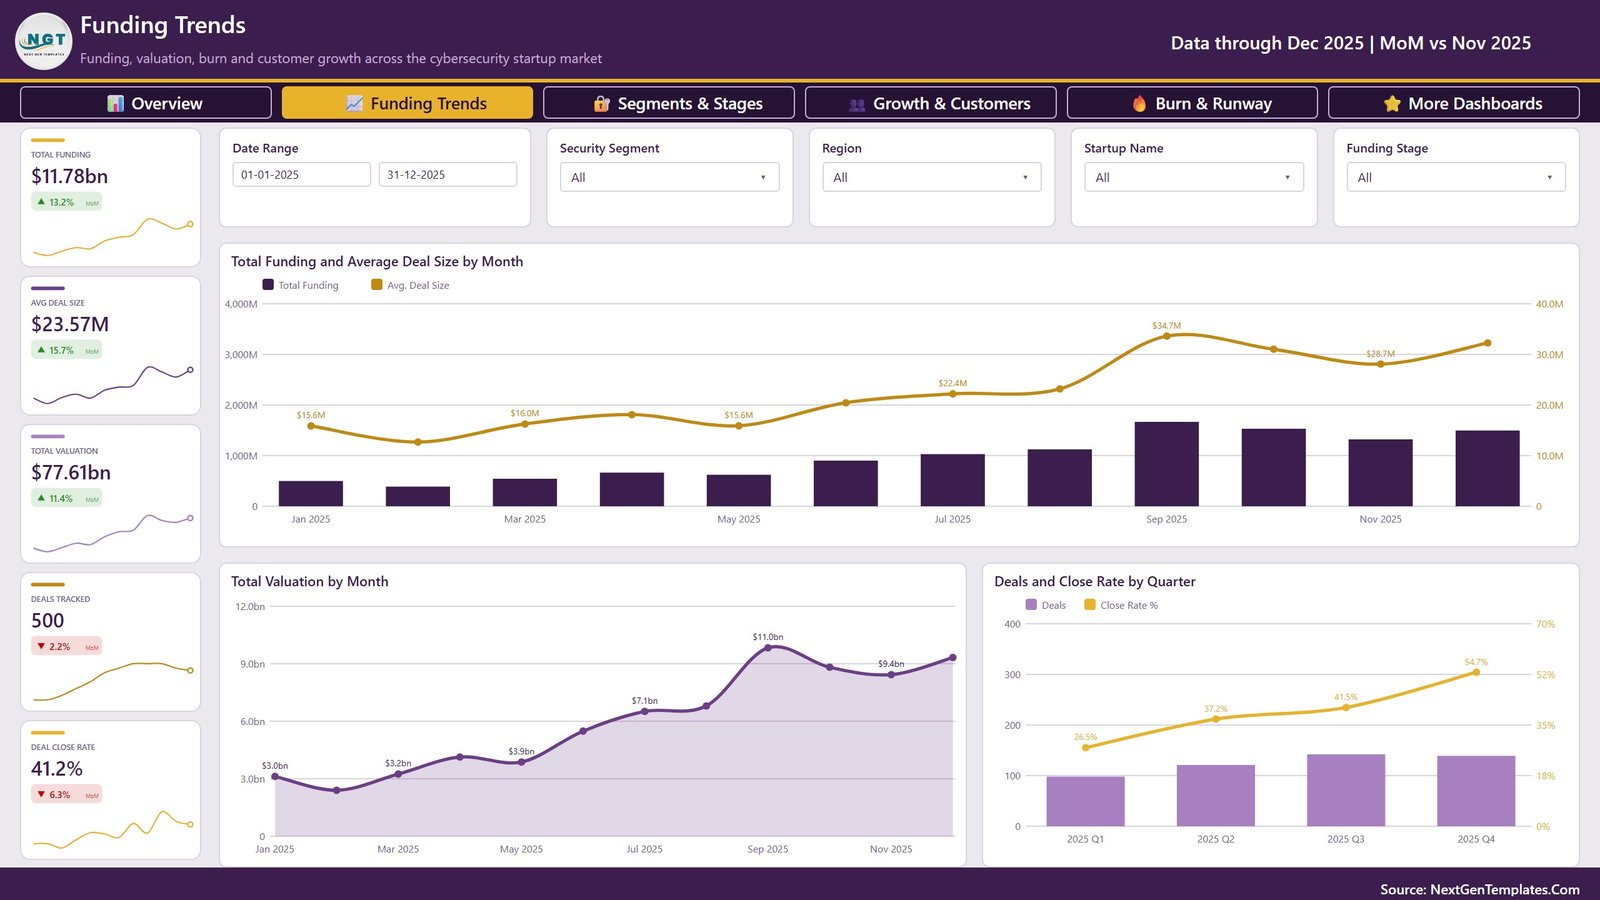
Avg Deal Size $23.57M (up 15.7%), Total Valuation $77.61bn (up 11.4%) and Deal Close Rate 41.2% (down 6.3%) join the card strip. Total Funding and Average Deal Size by Month shows deal size lifting from $15.6M in January to a $34.7M peak in September. Total Valuation by Month is an area chart running $3.0bn to $9.4bn with an $11.0bn September high. Deals and Close Rate by Quarter pairs quarterly deal counts with a close rate that rises 26.5% to 54.7% across 2025. Cybersecurity Startups Dashboard in Power BI
Page 3 – Segments & Stages
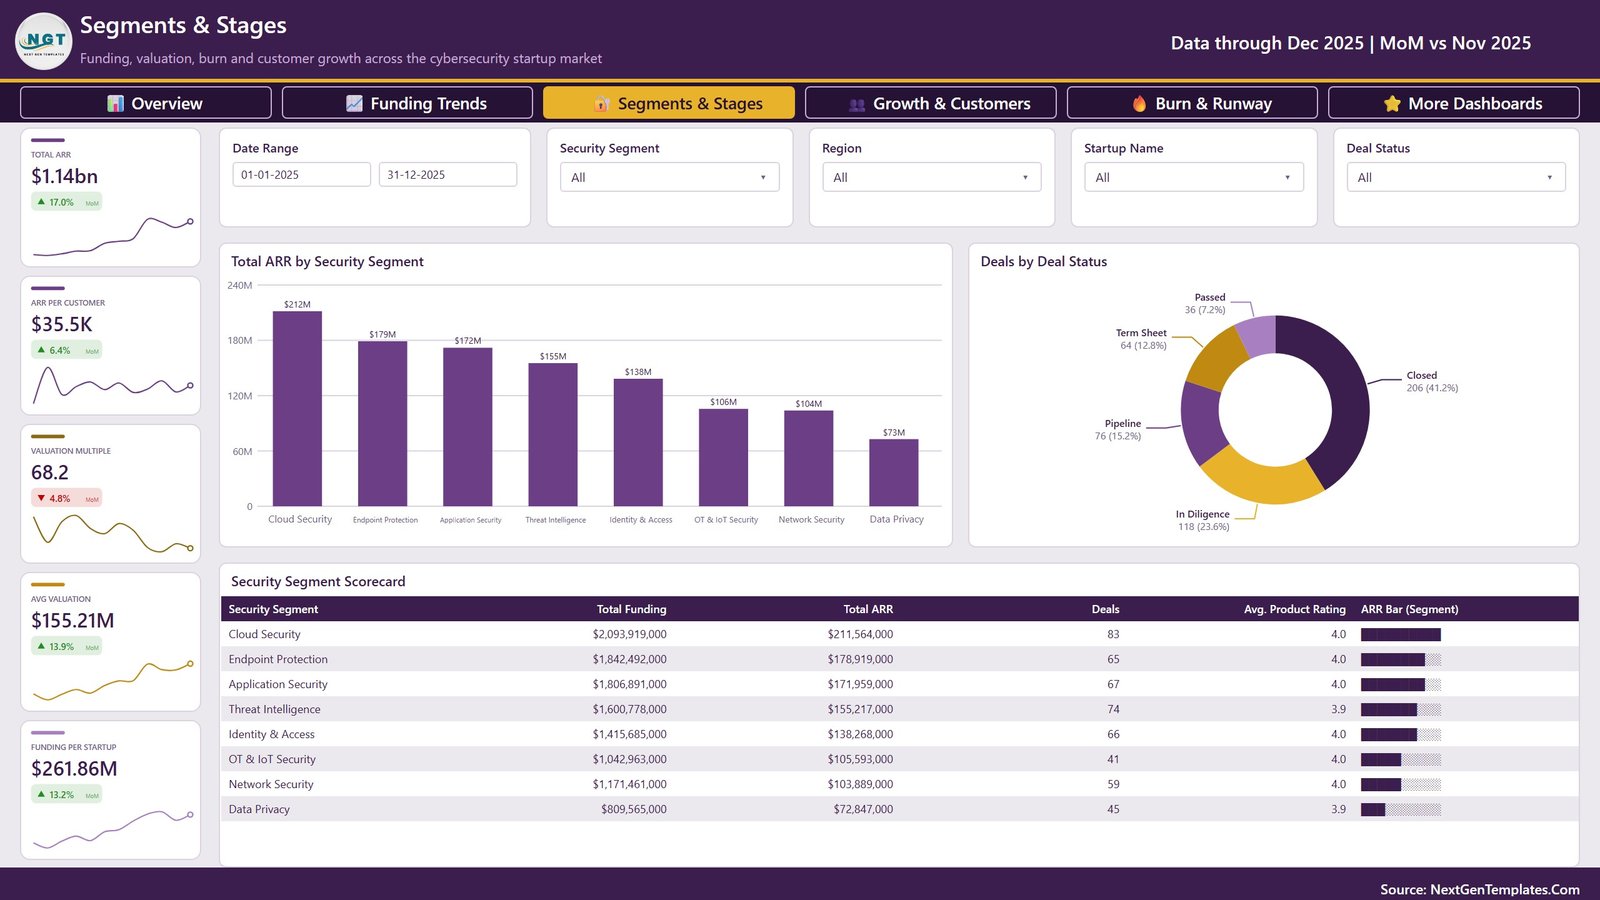
ARR per Customer $35.5K, Valuation Multiple 68.2, Avg Valuation $155.21M and Funding per Startup $261.86M sit alongside Total ARR. Total ARR by Security Segment tops out at Cloud Security $212M and closes at Data Privacy $73M. Deals by Deal Status is the pipeline read: Closed 206 (41.2%), In Diligence 118 (23.6%), Pipeline 76 (15.2%), Term Sheet 64 (12.8%), Passed 36 (7.2%). Underneath, the Security Segment Scorecard lays out funding, ARR, deal count, average product rating and an ARR data bar for all eight segments in one table. Cybersecurity Startups Dashboard in Power BI
Page 4 – Growth & Customers
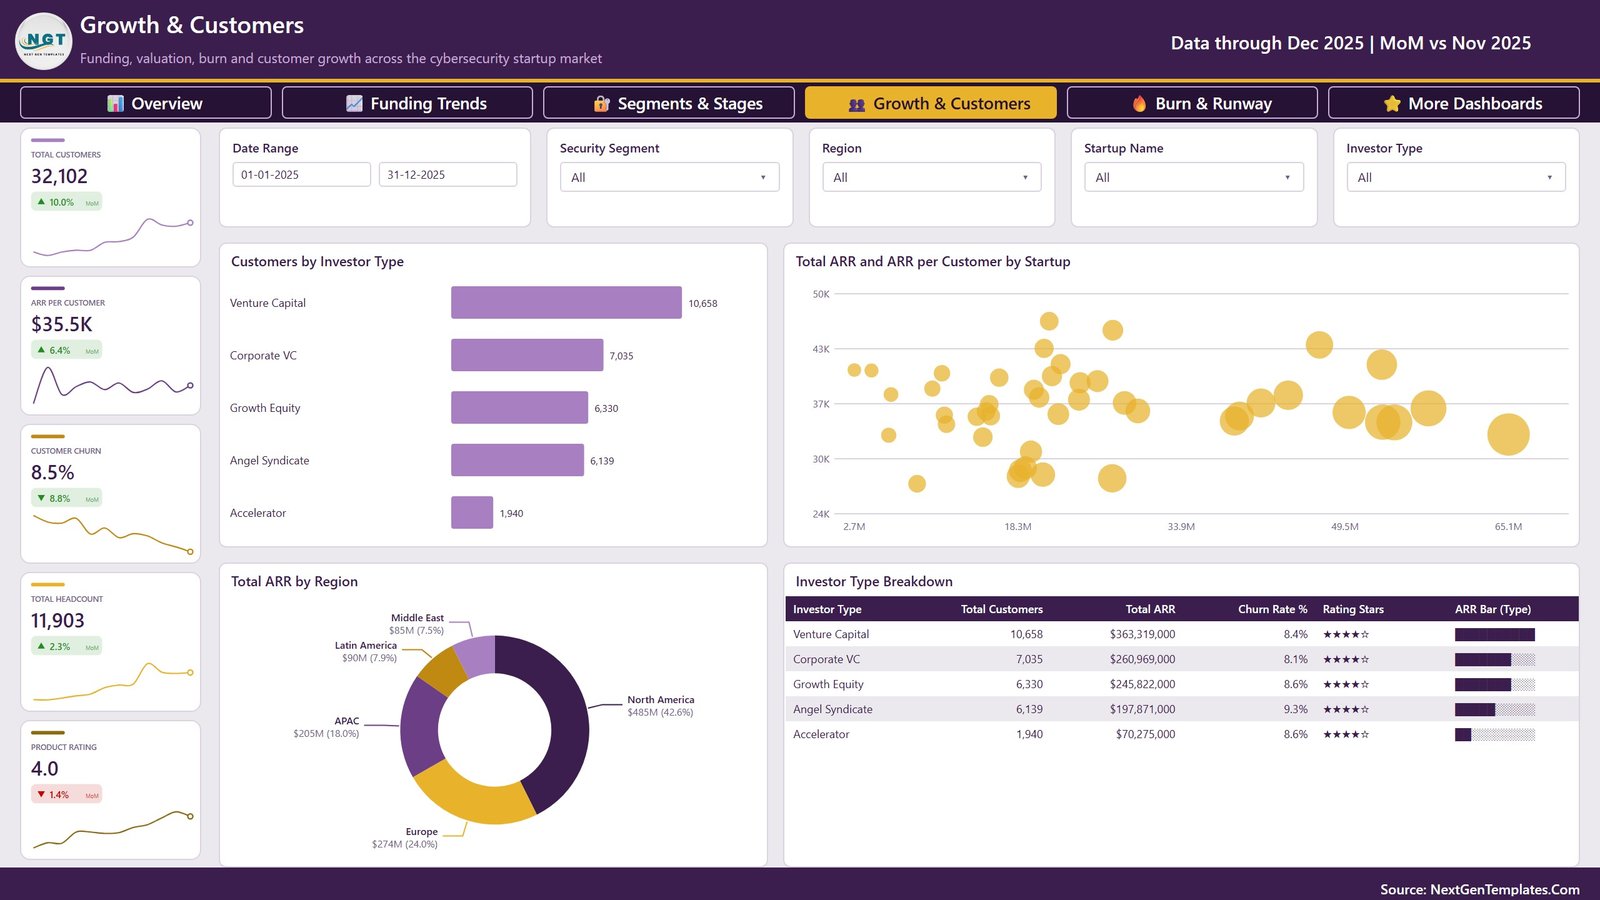
Customer Churn 8.5% (improving 8.8%) and Total Headcount 11,903 join the customer cards. Customers by Investor Type runs Venture Capital 10,658, Corporate VC 7,035, Growth Equity 6,330, Angel Syndicate 6,139 and Accelerator 1,940. A scatter, Total ARR and ARR per Customer by Startup, spreads every company across the two axes so outliers are obvious. Total ARR by Region gives North America $485M (42.6%) and Europe $274M (24.0%), and the Investor Type Breakdown table adds churn rate and a star rating per investor type.
Page 5 – Burn & Runway
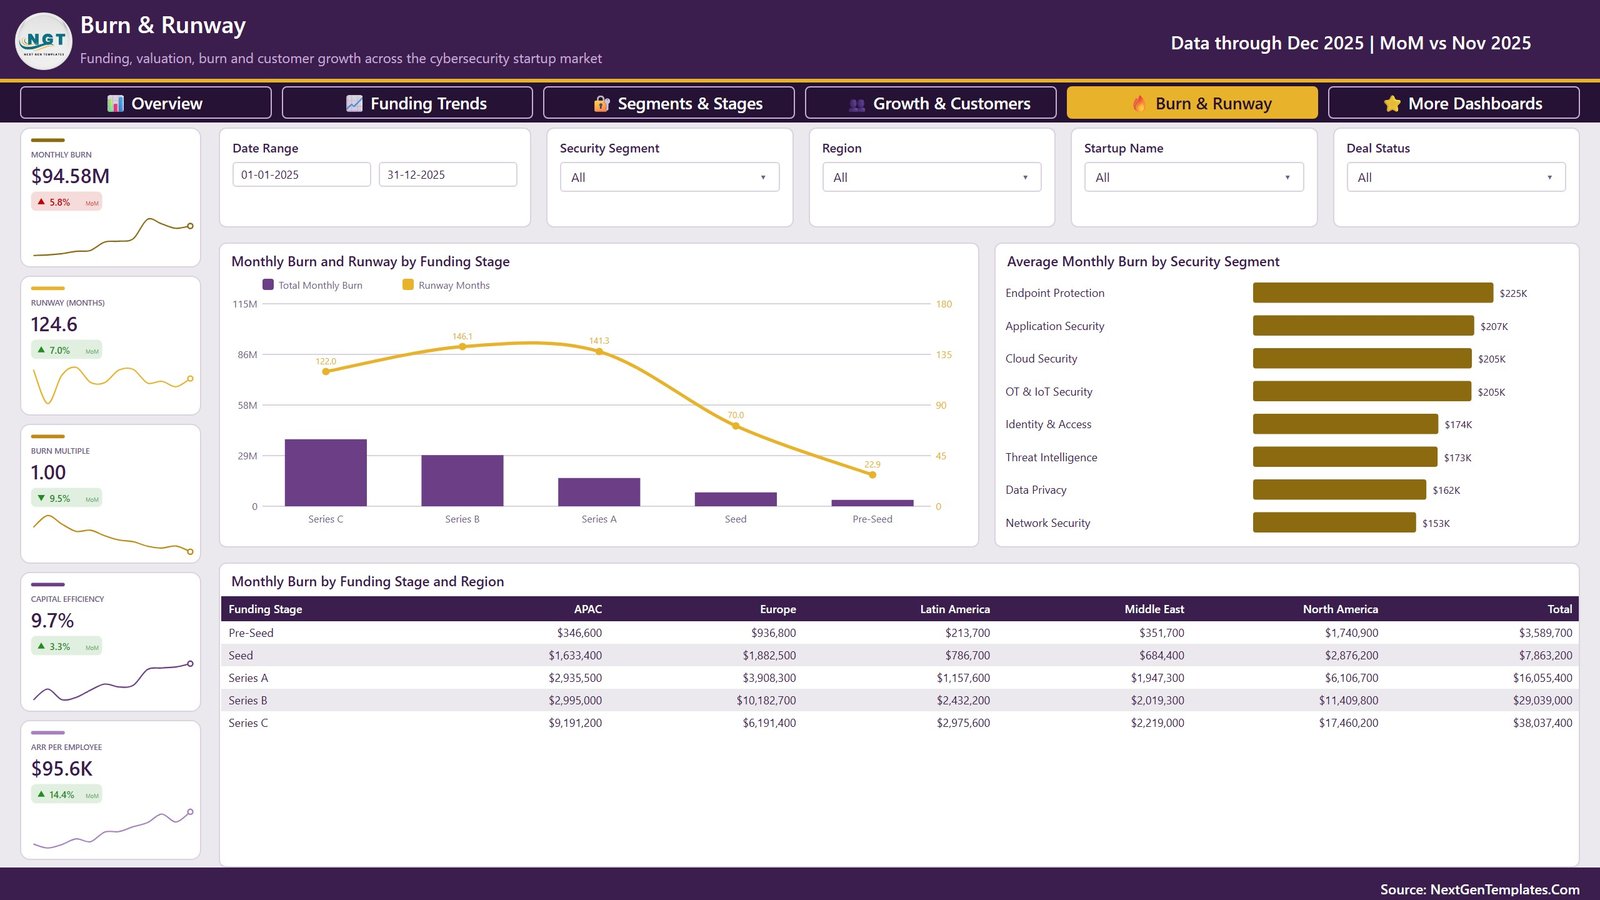
Monthly Burn $94.58M, Runway 124.6 months, Burn Multiple 1.00, Capital Efficiency 9.7% and ARR per Employee $95.6K. Monthly Burn and Runway by Funding Stage is the page’s argument: burn falls as you move down the stages, but so does runway – 122.0 months at Series C, a 146.1-month peak at Series B, then 141.3, 70.0 and 22.9 at Pre-Seed. Average Monthly Burn by Security Segment leads with Endpoint Protection $225K and closes with Network Security $153K, and a matrix breaks Monthly Burn by Funding Stage and Region down to the individual cell.
Cybersecurity Startups Dashboard in Power BI vs. Tableau vs. Paid Market-Data SaaS – Feature Comparison
| This template (Power BI) | Tableau / Qlik build | PitchBook or CB Insights | |
|---|---|---|---|
| Cost | $17.99 one time | $75+/user/month for Tableau Creator | $15,000-$30,000+ per seat, per year |
| Platform | Power BI Desktop (free) or the Power BI Service | Tableau Desktop / Qlik Sense | Vendor web platform |
| Setup time | Minutes – it opens already populated | Days to model and lay out | Instant, but it is their data |
| Real-time team collaboration | Power BI Service workspaces | Tableau Server / Cloud | Yes |
| Mobile access | Power BI mobile app | Tableau mobile | Yes |
| Customisable fields | Every column, measure, visual and colour | Yes, if you build it | No – fixed vendor schema |
| Share with a link | Yes, once published | Yes | Per licensed seat |
| Year-1 cost at 5 users | $17.99 | $4,500+ | $75,000+ |
| Market data included | No – sample rows you replace | No | Yes |
| Burn, runway and capital-efficiency measures | Built in and editable | Write them yourself | Portfolio module, extra cost |
Who Should Use This Template
Venture capital and corporate VC analysts covering the security sector, accelerator and syndicate managers reporting on a cohort, corporate development teams screening acquisition targets, and security founders assembling an investor update from their own numbers. BI consultants get a finished, unbranded Power BI report to rebrand for a client, and anyone learning DAX gets 37 working measures to read instead of an empty model.
It is the wrong tool if you need a security operations view – threat volumes, vulnerability backlogs, mean time to remediate, control coverage – or if you were expecting the market data itself rather than a place to put yours. There is also no cap table, no exit waterfall and no IRR calculation in this build.
Real-World Use Cases
A seed-stage security fund’s Monday pipeline call. Filter Security Segment to Cloud Security and Identity & Access, set the date range to the trailing quarter, and read Avg Deal Size and Deal Close Rate off page 2. The Q1-to-Q4 close-rate curve becomes the partner-deck slide.
Corp dev screening at an established vendor. Sort the Security Segment Scorecard on page 3 by ARR, then right-click a startup name and drill through to the Details page for the raw rows. Valuation Multiple on the card strip flags when a segment is running hot before anyone opens a model.
A founder preparing a Series B. Swap in your own monthly figures and screenshot page 5 – Monthly Burn, Runway, Burn Multiple, Capital Efficiency and ARR per Employee – into the investor update, with the funding-stage burn comparison as peer context.
Advantages of the Cybersecurity Startups Dashboard in Power BI
The report opens populated, so there is no blank-canvas stage and no modelling before you can judge whether the layout suits you. The four synced slicers mean a filter set once on the Overview holds for all five pages, which is the difference between a report people use and one they abandon at page two. Every card pairs its value with a direction and a trend line, so nobody reports a number without its context. The drillthrough page means the detail is always one right-click away rather than a separate export. And because nothing is locked – not the theme, not the DAX, not the page structure – the commercial licence is genuinely usable: rebrand it, rename the measures, ship it to a client.
Opportunities for Improvement
Being straight about the gaps: there is no map visual, so regional analysis is done with bars, donuts and a matrix rather than geography. Product Rating is a buyer-typed field on the source rows, not a computed score, so it is only as good as what you put in. The date range is fixed to a single calendar year in the sample data, and multi-year comparison means extending your own source file. There is no cap table, dilution or IRR modelling. And the Deal Close Rate is a count-based ratio over the deal statuses in the file, so if your pipeline uses different status names you will want to align them with the five in the model – or rename the model’s categories to match yours.
Best Practices
- Keep the 16 column headers exactly as they are when you replace the sample rows. Renaming a column breaks the measures that reference it.
- Change the source in Power Query, not in the model. One file path, then Close & Apply and Refresh – see the Microsoft Learn guide to Power BI data sources if you have not done it before.
- Set the date range first, then the segment slicers. The MoM deltas are computed against the prior month inside the current range, so a very short range makes them noisy.
- Use the drillthrough before exporting. Most “can you send me the underlying deals?” requests are answered on the Details page in ten seconds.
- Rename the theme colours once, not per visual. The report uses a single theme, so a rebrand is one file, not seventeen visuals.
- Publish to a workspace for sharing. Desktop is fine for one analyst; a Service workspace is what makes the link shareable.
Explore Relevant Templates
- Cybersecurity Startups Dashboard in Excel – the same subject built with pivot tables and slicers, for teams without Power Cybersecurity Startups Dashboard in Power BI BI. The two are built independently, so the page structure and KPI list differ.
- Climate Tech Startups Dashboard in Power BI – the same startup-analytics shape for a different sector.
- Crowdsourced Investment Platforms Dashboard in Power BI – deal flow seen from the platform side.
- Risk Assessment Firms Dashboard in Power BI – the services side of the risk and assurance market.
- Cyber Risk Management Dashboard in Excel – if what you actually wanted was risk and control tracking.
- IT Manager & CISO Toolkit – 10 Excel, Google Sheets and Power BI templates in one bundle.
Frequently Asked Questions
Does this dashboard monitor threats, vulnerabilities or incidents?
No. It analyses cybersecurity companies – their funding, valuation, ARR, customers, headcount and burn. There is no threat feed, no CVE list, no patch or incident tracking and no compliance register in this file.
Is real market data included?
No. The 500 rows are sample records built to exercise every visual. They are not sourced from any market-data provider and there is no live connection to one. Replace them with your own pipeline or portfolio.
Do I need a Power BI Pro licence?
Not to use the report – Power BI Desktop is free and fully interactive. Pro or Premium is only needed to publish it to the Power BI Service and share it with colleagues by link.
How do I point it at my own file?
Keep the 16 column headers from the included Data.xlsx, paste your rows underneath, change the single file path in Power Query, then Close & Apply and Refresh. Every card, chart and table recalculates.
Can I edit the visuals, colours and DAX?
Yes. Nothing is locked, no visual depends on an external image, and the commercial licence covers rebranding and client work.
What is in the download?
A single ZIP with the .pbix report, the Data.xlsx sample workbook and a Power BI Dashboard – User Manual PDF.
About the Author
Built by PK – Microsoft Certified Professional with 15+ years of Excel, Google Sheets, and Power BI experience. Founder of NextGenTemplates, reaching 300K+ subscribers across YouTube channels. Every template is hand-built and tested before release.
Conclusion
If you track cybersecurity startups – as an investor, an acquirer or a founder benchmarking yourself – the work is rarely the analysis and almost always the assembly: getting funding, valuation, ARR, customers, headcount and burn into one place where a filter moves all of them together. The Cybersecurity Startups Dashboard in Power BI ships that assembly finished, with 19 KPI cards, 17 visuals, synced slicers and a drillthrough page already wired, and leaves every part of it editable so it can become your report rather than someone else’s.
Get the Cybersecurity Startups Dashboard in Power BI for $17.99 (regular $29.99) – instant ZIP download, lifetime access, commercial licence, no subscription.
For step-by-step Excel and Power BI tutorials, subscribe at youtube.com/@PKAnExcelExpert.