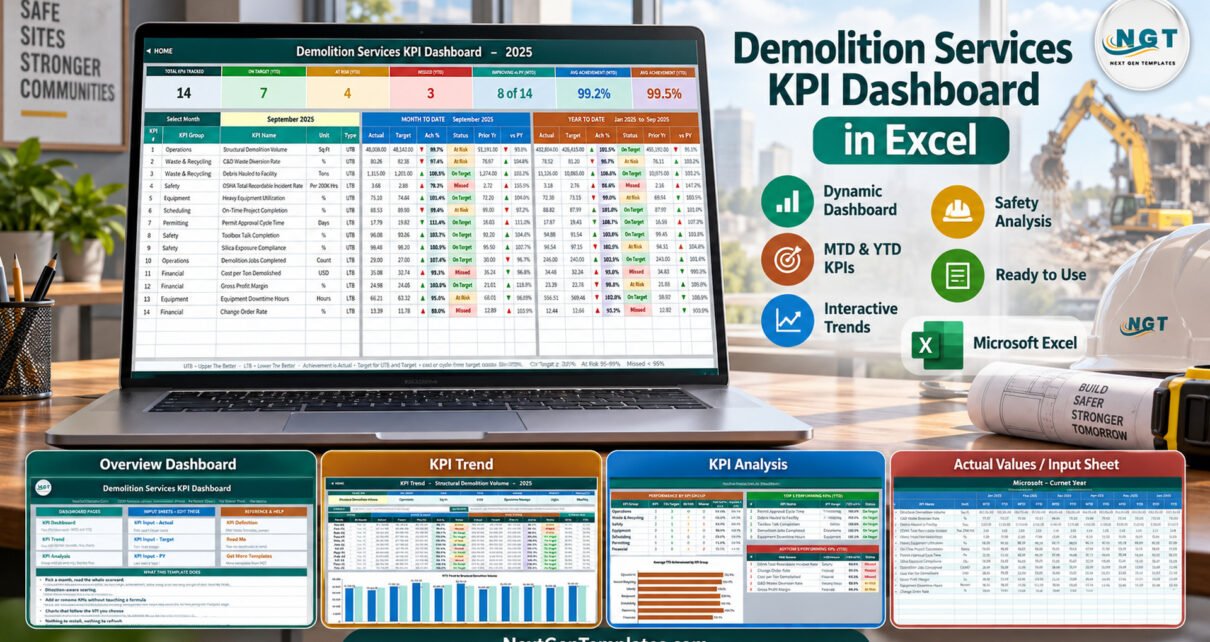
Most demolition contractors are not short of numbers. The square footage came down or it did not, the permit landed this week or it is still with the city, the high-reach rig worked or it sat in the yard waiting for a hydraulic hose. What is usually missing is one page that lines those numbers up month by month, puts a target next to each one and colours the result honestly. That is what the Demolition Services KPI Dashboard in Excel does – 14 KPIs in 7 groups, one month dropdown, MTD and YTD together, seven summary cards and not a single macro.
Before going further, one plain statement: this is a KPI reporting workbook filled with sample data. It reports whatever you type into it. It is not an asbestos survey tool, a structural assessment, a permit system, an OSHA or HSE recordkeeping system or a silica monitoring program, and nothing in it demonstrates compliance with any of those regimes.
First, Which Template Is This?
NextGenTemplates publishes three lines whose names look almost identical in a search result, so it is worth thirty seconds to be sure which one you are reading about.
- KPI Dashboard – this one. A month-picker scorecard with 14 KPIs, seven summary cards and traffic lights, plus a dedicated KPI Trend page and a KPI Analysis page.
- KPI Scorecard – a separate, lighter Demolition Services KPI Scorecard edition from a different product line, with its own KPI set and layout.
- Dashboard (no “KPI”) – the analytical line, which charts a transaction table through slicers rather than a governed KPI list.
They complement each other rather than duplicate each other.
What You Actually Get
The download is a ZIP with two files: the .xlsx workbook and the Excel KPI Dashboard User Manual (PDF). The workbook has eleven sheets: Home, KPI Dashboard, KPI Trend, KPI Analysis, KPI Input – Actual, KPI Input – Target, KPI Input – PY, KPI Definition, Support, Read Me and Get More Templates. Every calculated cell is an ordinary worksheet formula – VLOOKUP, MATCH, INDEX, COUNTIF and friends – so there is no Power Query, no data model, no VBA and no add-in. According to its Home sheet it opens in Excel 2013 and later and in Excel for the web.
Key Features
- A single month picker. Cell D6 on KPI Dashboard is a dropdown of the twelve months of the reporting year. The scorecard, the summary cards and the KPI Analysis page all follow it.
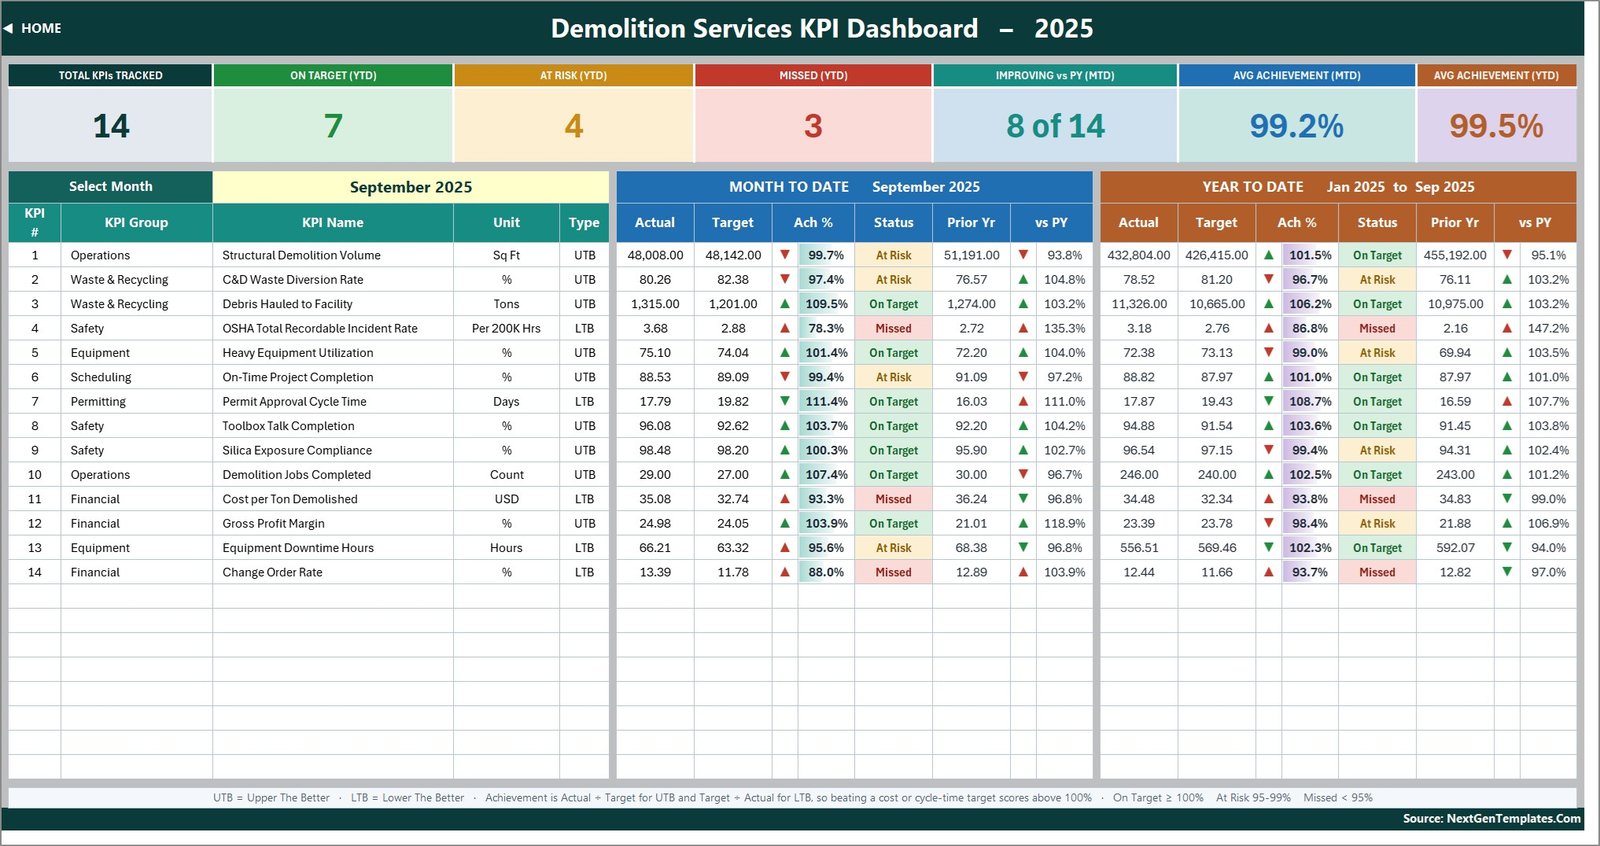
- MTD and YTD in one row. Actual, Target, Ach %, Status, Prior Yr and vs PY for the month, then the same six columns for the year to date.
- Direction-aware achievement. 9 KPIs are Upper The Better and 5 are Lower The Better, and the achievement formula flips for the second group.
- Seven summary cards. Total KPIs Tracked, On Target (YTD), At Risk (YTD), Missed (YTD), Improving vs PY (MTD), Avg Achievement (MTD) and Avg Achievement (YTD).
- Capacity for 22 KPIs. 14 are filled; 8 more rows are already wired through every sheet.
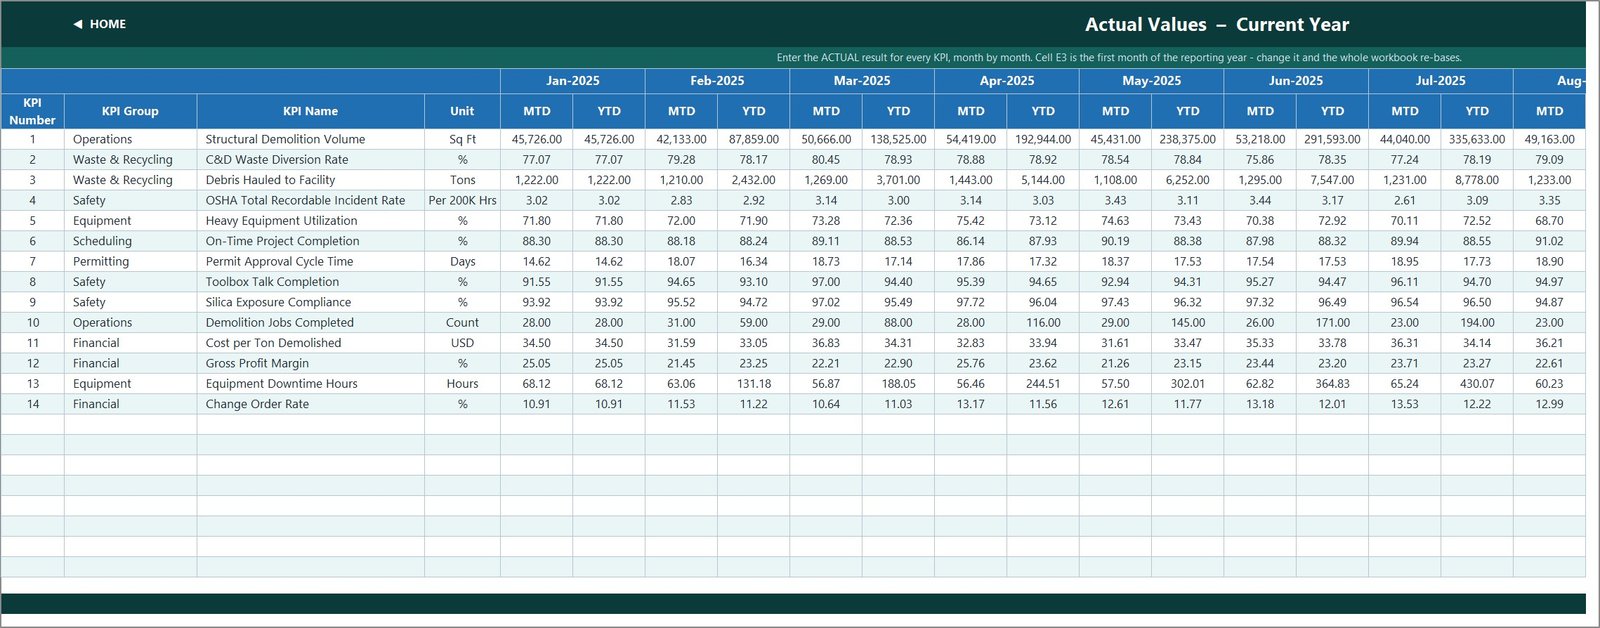
- A one-cell year change. Cell E3 on KPI Input – Actual sets the first month; every title, dropdown and prior-year header re-bases from it.
The 14 Demolition KPIs, Group by Group
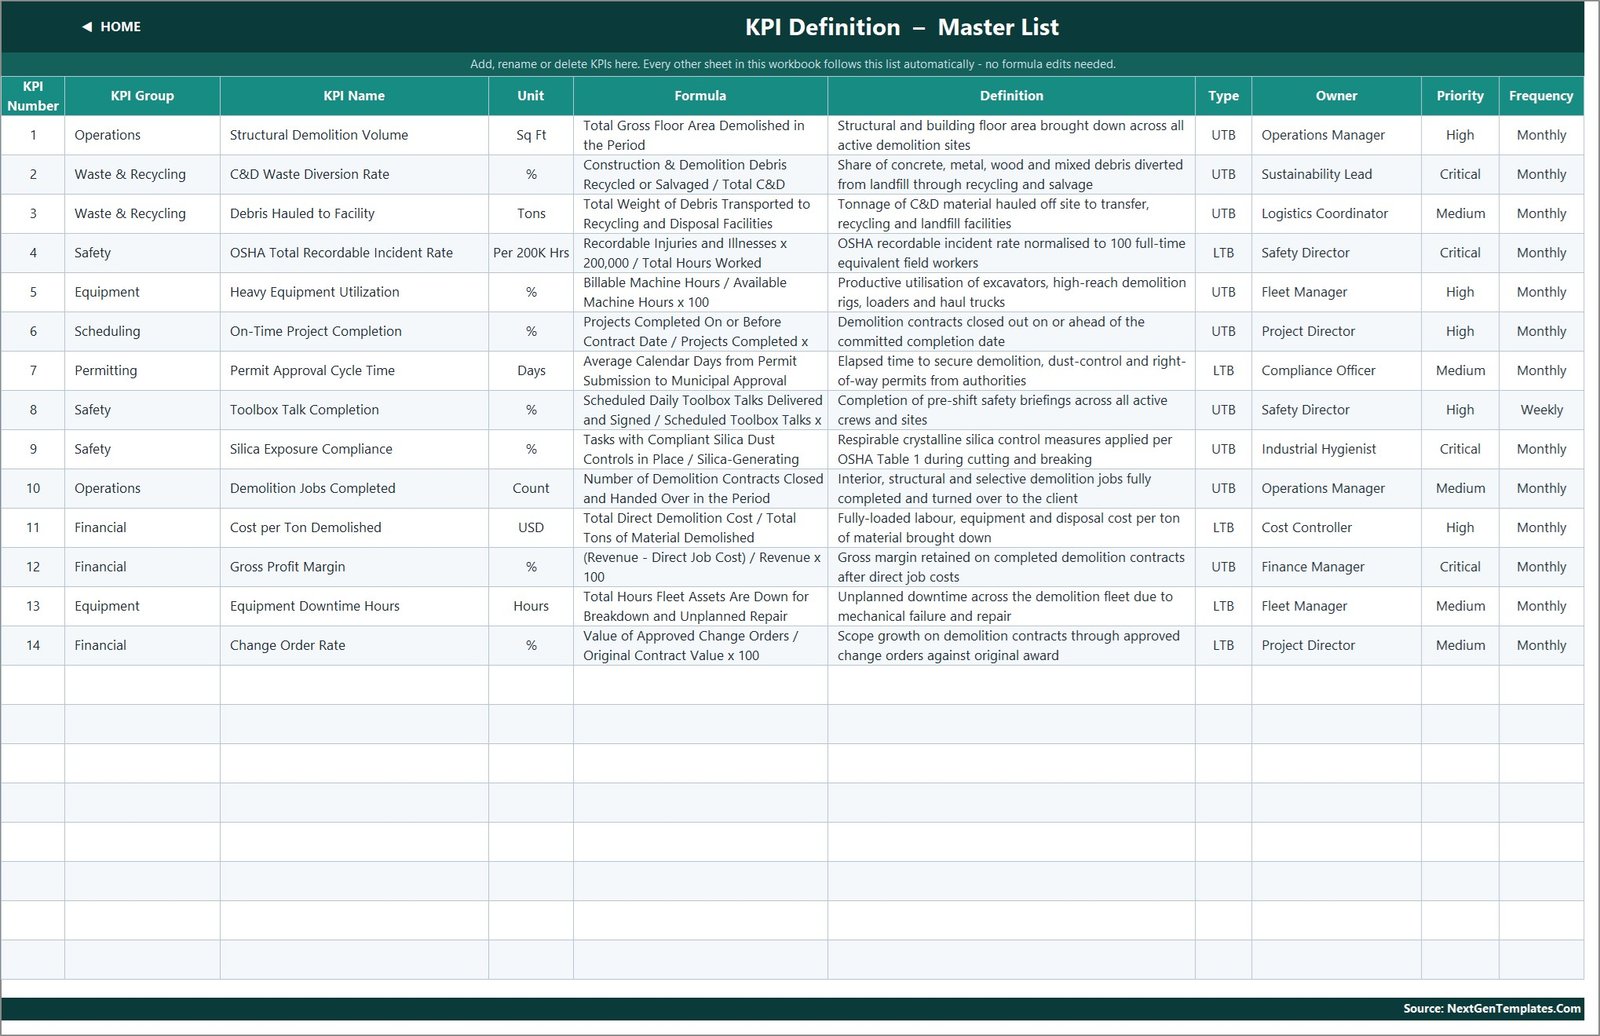
The sample KPI set is written for a contractor doing structural, interior and selective demolition. Each KPI carries a unit, a formula, a definition, a UTB or LTB flag, an owner, a priority and a frequency on the KPI Definition sheet.
- Operations (2): Structural Demolition Volume (Sq Ft, UTB) and Demolition Jobs Completed (Count, UTB), both owned by the Operations Manager.
- Waste & Recycling (2): C&D Waste Diversion Rate (%, UTB, Critical) and Debris Hauled to Facility (Tons, UTB).
- Safety (3): OSHA Total Recordable Incident Rate (Per 200K Hrs, LTB, Critical), Toolbox Talk Completion (%, UTB, reported weekly) and Silica Exposure Compliance (%, UTB, Critical).
- Equipment (2): Heavy Equipment Utilization (%, UTB) and Equipment Downtime Hours (Hours, LTB), both owned by the Fleet Manager.
- Scheduling (1): On-Time Project Completion (%, UTB).
- Permitting (1): Permit Approval Cycle Time (Days, LTB), owned by the Compliance Officer.
- Financial (3): Cost per Ton Demolished (USD, LTB), Gross Profit Margin (%, UTB, Critical) and Change Order Rate (%, LTB).
Four KPIs are marked Critical, five High and five Medium. Treat the list as a starting point. If your firm measures diversion by weight rather than percentage, or tracks permit cycle time from application rather than submission, change the definition on KPI Definition and the rest of the workbook follows.
Why the UTB / LTB Flag Matters Most
A normal achievement percentage is Actual divided by Target. That works for square footage and gross margin, but it punishes you for doing well on anything where lower is better. The workbook fixes this with one flag per KPI: for an LTB KPI, achievement is Target divided by Actual.
The September 2025 sample shows why that matters:
- Permit Approval Cycle Time came in at 17.79 days against a 19.82-day target. Actual over target would read 89.8% and look like a miss; target over actual reads 111.4%, On Target.
- Cost per Ton Demolished was 35.08 USD against 32.74 USD, so it scores 93.3% and shows Missed, because spending more per ton is worse.
- Debris Hauled to Facility is UTB: 1,315 tons against 1,201 tons scores 109.5%, On Target.
The arrows follow the same logic. The arrow shows raw direction against the comparator; its colour shows whether that direction is good for that KPI. A falling cost per ton gets a green down-arrow, not a red one.
Dashboard Pages Explanation
Home
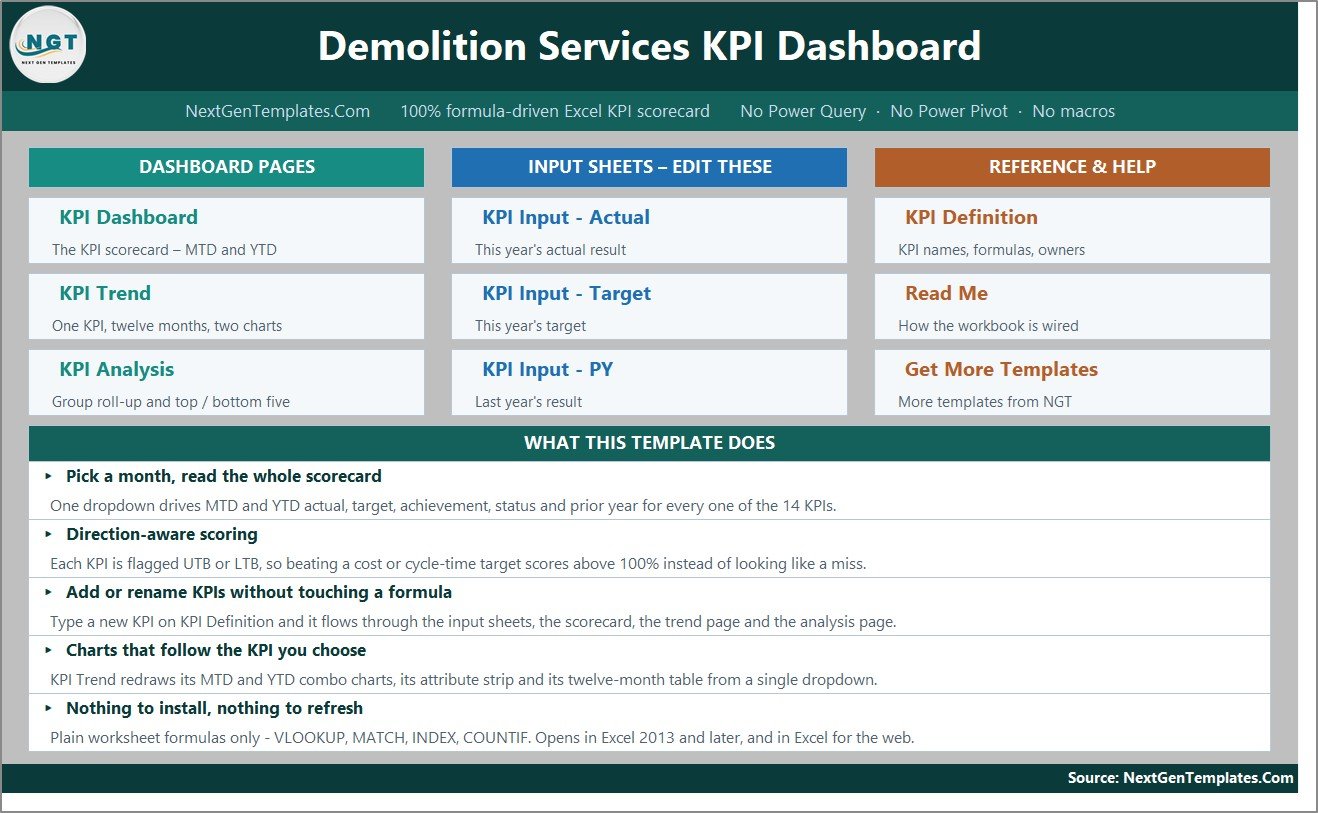
A nine-tile launcher: the three dashboard pages, the three input sheets and three reference sheets, with a five-point summary of what the template does.
KPI Dashboard
The scorecard. For September 2025 the sample cards read 14 KPIs tracked, 7 On Target, 4 At Risk, 3 Missed, 8 of 14 improving on last year, 99.2% average MTD achievement and 99.5% average YTD achievement. Below the cards, each KPI row carries the month-to-date block and the January-to-September block side by side, with a legend for UTB, LTB and the status bands along the footer.
KPI Trend
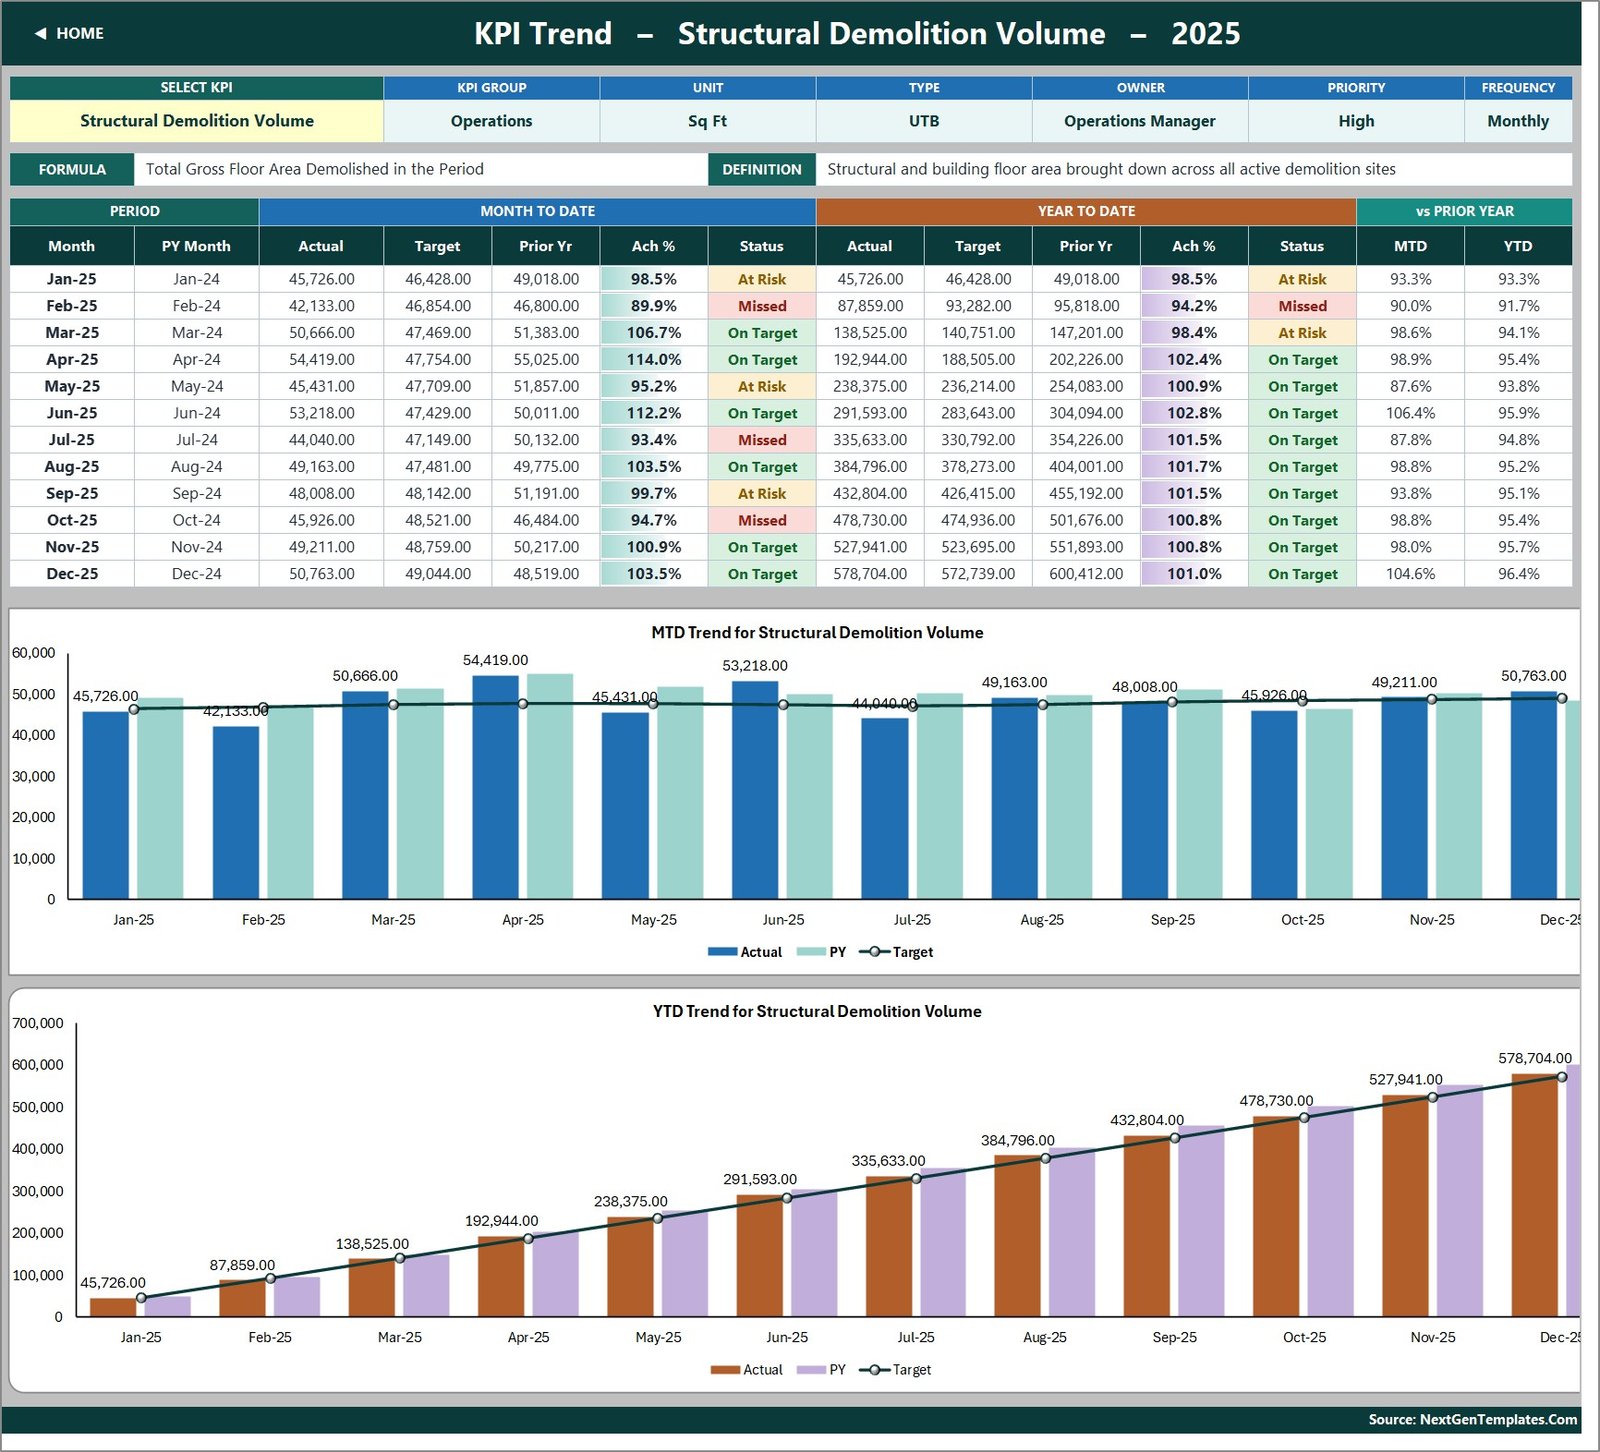
Pick any KPI in cell B4 and the page redraws: an attribute strip (group, unit, type, owner, priority, frequency), the formula and definition, a twelve-month table of MTD and YTD actual, target, prior year, achievement and status, and two combo charts – MTD Actual and Prior Year by Month with a Target line, and YTD Actual and Prior Year by Month with a Target line. In the sample, Structural Demolition Volume closes December at 578,704 sq ft YTD against a 572,739 sq ft target.
KPI Analysis
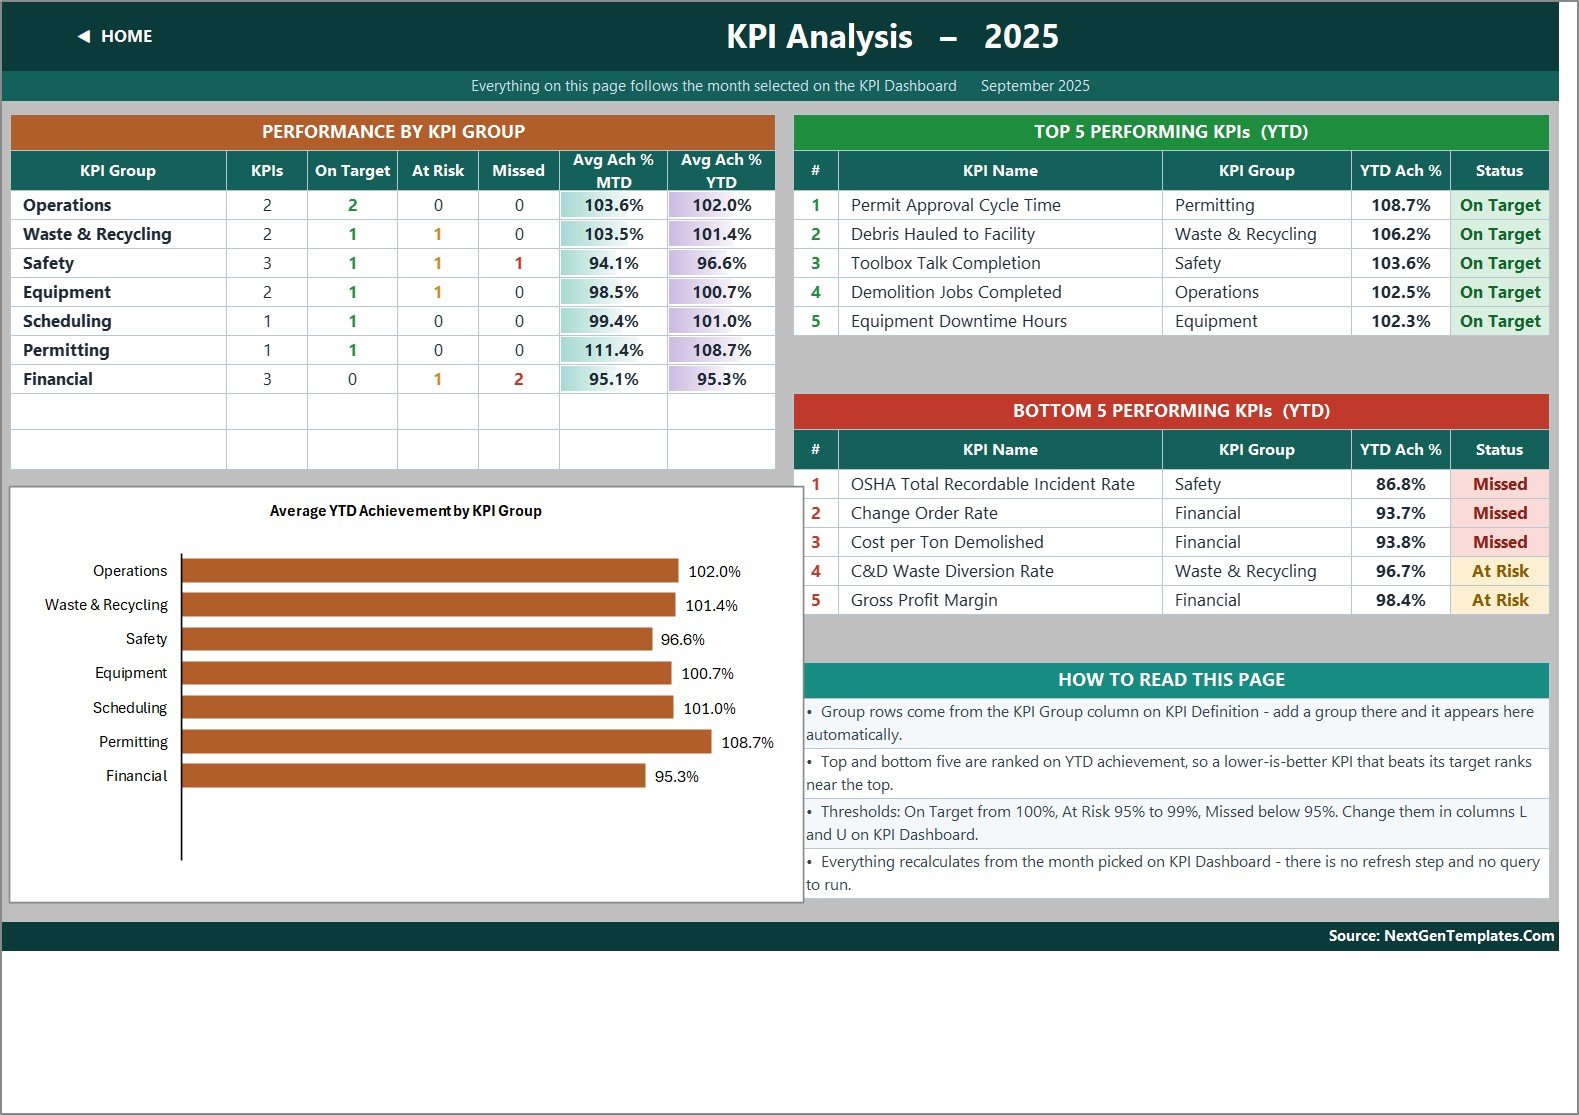
Follows the month selected on KPI Dashboard. The Performance by KPI Group table counts each group’s KPIs by status and gives average MTD and YTD achievement, charted as Average YTD Achievement by KPI Group. In the sample, Permitting leads at 108.7% YTD and Financial trails at 95.3%, with 2 of its 3 KPIs Missed. The Top 5 and Bottom 5 Performing KPIs (YTD) tables rank individual KPIs – Permit Approval Cycle Time tops the list and OSHA Total Recordable Incident Rate sits at the bottom at 86.8%.
KPI Input – Actual, Target and PY
Three sheets with the same layout: one row per KPI, and an MTD and a YTD column for each month. Target headers follow the Actual sheet; Prior Year headers are the Actual months shifted back twelve months. These are the only sheets you normally type in.
KPI Definition
The master list: number, group, name, unit, formula, definition, type, owner, priority and frequency. Every other sheet reads its KPI names from here.
Read Me, Support and Get More Templates
Read Me explains the wiring: setup, the MTD/YTD rules, UTB/LTB, the status thresholds and how to add or remove KPIs. Support holds the helper calculations and needs no editing. Get More Templates links to the wider NextGenTemplates catalogue.
Demolition Services KPI Dashboard in Excel vs. Power BI vs. Paid Construction Software
| Feature | This Excel KPI dashboard | A Power BI KPI report | Paid construction management software (Procore, HCSS, Buildertrend and similar) |
|---|---|---|---|
| Cost | $12.99 one-time (regular $19.99) | Desktop free; sharing needs paid licences | Recurring subscription, usually per user or per project |
| Where it runs | Excel 2013+ and Excel for the web | Power BI Desktop and service | Vendor cloud and mobile apps |
| Setup | Replace sample data on three sheets | Build model and measures | Implementation project |
| MTD and YTD from a month picker | Built in | Built per report | Depends on the module |
| UTB / LTB scoring per KPI | Built in | Written into measures | Rarely a setting |
| Add a KPI | One row | Edit model and visuals | Configuration or vendor |
| Offline, no account | Yes | Desktop only | Usually no |
| Field capture and daily logs | No – monthly entry | No | Typically yes |
| Compliance system of record | No | No | Some products offer modules |
For a demolition firm that already knows its monthly figures and wants one governed scorecard without a subscription, this workbook sits in the sweet spot; for field capture and compliance records, use software built for that job.
Who Should Use This Template
Perfect for:
- Owners and operations managers of small and mid-sized demolition firms who report monthly.
- Project directors who want on-time completion, change order rate and margin on one page.
- Fleet managers pairing utilization and downtime with tonnage hauled.
- Consultants building KPI packs for construction clients.
Not a fit if:
- You need an incident, asbestos or permit register – this reports KPIs and keeps no such records.
- You want crews entering data from site on a phone.
- You need live ERP or telematics feeds without building the connection yourself.
Real-World Use Cases
A structural demolition contractor with around 40 staff. The operations manager enters square feet demolished, jobs completed and tons hauled at month end, prints the KPI Dashboard, and uses the Bottom 5 table to set the agenda for the review meeting.
An interior strip-out subcontractor. The project director watches On-Time Project Completion and Change Order Rate. When Change Order Rate shows up in the Bottom 5, KPI Trend shows whether it was one difficult job or a drift across the year.
A regional firm with its own recycling yard. The sustainability lead owns C&D Waste Diversion Rate and Debris Hauled to Facility; the fleet manager owns utilization and downtime. Four owners, one workbook, one dropdown.
How to Set It Up in Ten Minutes
- Set the first month of your reporting year in cell E3 on KPI Input – Actual. The month list is built with the EDATE function, so the whole year re-bases.
- Edit KPI Definition: keep, rename or replace the 14 KPIs and check every UTB/LTB flag.
- Fill KPI Input – Target and KPI Input – PY.
- Each month, paste MTD and YTD actuals into KPI Input – Actual.
- Pick the month in D6 on KPI Dashboard – a standard data validation list – and read the scorecard.
Advantages
- No subscription. A one-time purchase instead of a per-seat licence for a monthly management report.
- Readable formulas. Anyone who can trace a VLOOKUP can audit how a status was reached.
- Honest scoring. The UTB/LTB flag stops cycle-time and cost KPIs from turning red when they improve.
- One place for four functions. Operations, safety reporting, fleet and finance see the same month on the same page.
Opportunities for Improvement
- Manual monthly entry. There is no connection to accounting, telematics or field apps; values are typed or pasted.
- You keep MTD and YTD yourself. Both columns are inputs, which gives full control but means a wrong YTD figure is not caught automatically.
- A generic Read Me example. The Read Me paragraph on cumulative versus average YTD uses an example from the wider template family (“aircraft deliveries, non-conformance reports”) instead of a demolition one. It is explanatory text and changes no calculation.
- Not a compliance tool. Safety KPIs mirror your records; they do not replace an incident log, exposure monitoring or permit tracking.
Best Practices
- Decide cumulative versus average YTD per KPI. Square feet, tons and job counts accumulate; rates such as diversion, utilization and margin should be running averages.
- Write the definition before the number. Agree how diversion is measured – the EPA’s page on sustainable management of construction and demolition materials is a useful reference point – and put it on KPI Definition.
- Give every KPI one owner. The Owner column is there so a red status has a name attached to it.
- Fill prior year honestly. vs PY and Improving vs PY are only as useful as last year’s figures.
- Take real safety data from your system of record. The workbook reports those figures; it should never be where they originate.
Explore Relevant Templates
The same KPI Dashboard format is already written up for neighbouring trades on this blog:
- Concrete Contractor KPI Dashboard in Excel
- Paving Contractor KPI Dashboard in Excel
- Fencing Contractor KPI Dashboard in Excel
- Drywall Contractor KPI Dashboard in Excel
- Insulation Contractor KPI Dashboard in Excel
In the store, the Heavy Machinery Dashboard in Google Sheets pairs well with the equipment KPIs, and the Civil Contractor Job Management System Web App covers the job-tracking side. Browse the full KPI Dashboard category for more.
Frequently Asked Questions
Is this the KPI Dashboard or the KPI Scorecard?
It is the KPI Dashboard line: 14 KPIs, a month picker, seven summary cards, traffic lights and separate KPI Trend and KPI Analysis pages. A lighter Demolition Services KPI Scorecard edition is sold separately in another line, with its own KPI set and layout.
What KPIs does the Demolition Services KPI Dashboard in Excel track?
It ships with 14 sample KPIs in seven groups, including Structural Demolition Volume, C&D Waste Diversion Rate, OSHA Total Recordable Incident Rate, Heavy Equipment Utilization, Permit Approval Cycle Time, Cost per Ton Demolished, Gross Profit Margin and Change Order Rate. All of them can be renamed or replaced.
Do I need macros or Power Query?
No. It is a plain .xlsx using worksheet formulas only – no VBA, no Power Query, no Power Pivot and no add-ins – so there are no macro security prompts and it opens in Excel for the web as well as desktop Excel 2013 and later.
Will it make my firm OSHA or silica compliant?
No. The workbook displays figures you enter from your own records. It performs no surveys, monitoring, recordkeeping or permit work and is not evidence of compliance. Rely on qualified professionals and proper systems of record for those obligations.
How long does setup take?
With last year’s figures and this year’s targets to hand, most people finish in one sitting: set the year in E3, review KPI Definition, paste three input sheets, and pick a month. Everything recalculates immediately.
How does it compare to construction management software?
Platforms such as Procore or HCSS capture field data and documents on a subscription. This workbook is a one-time purchase that turns numbers you already have into a monthly scorecard. Many firms keep both.
About the Author
Built by PK – Microsoft Certified Professional with 15+ years of Excel, Google Sheets and Power BI experience, and founder of NextGenTemplates. PK publishes Excel and Power BI tutorials on YouTube, and every template is hand-built and tested before release.
Conclusion
A demolition business runs on a handful of numbers that rarely sit together: area brought down, tons diverted, incident rate, fleet uptime, permit turnaround, cost per ton and margin. This workbook puts all 14 on one page, scores each one in the right direction, and gives you a trend view and a group view for the month you choose – without a subscription or a line of code.
Click here to purchase the Demolition Services KPI Dashboard in Excel
Instant download – one-time payment – no subscription.
Visit our YouTube channel to learn step-by-step video tutorials: Youtube.com/@PKAnExcelExpert
Last updated: 13 September 2026.