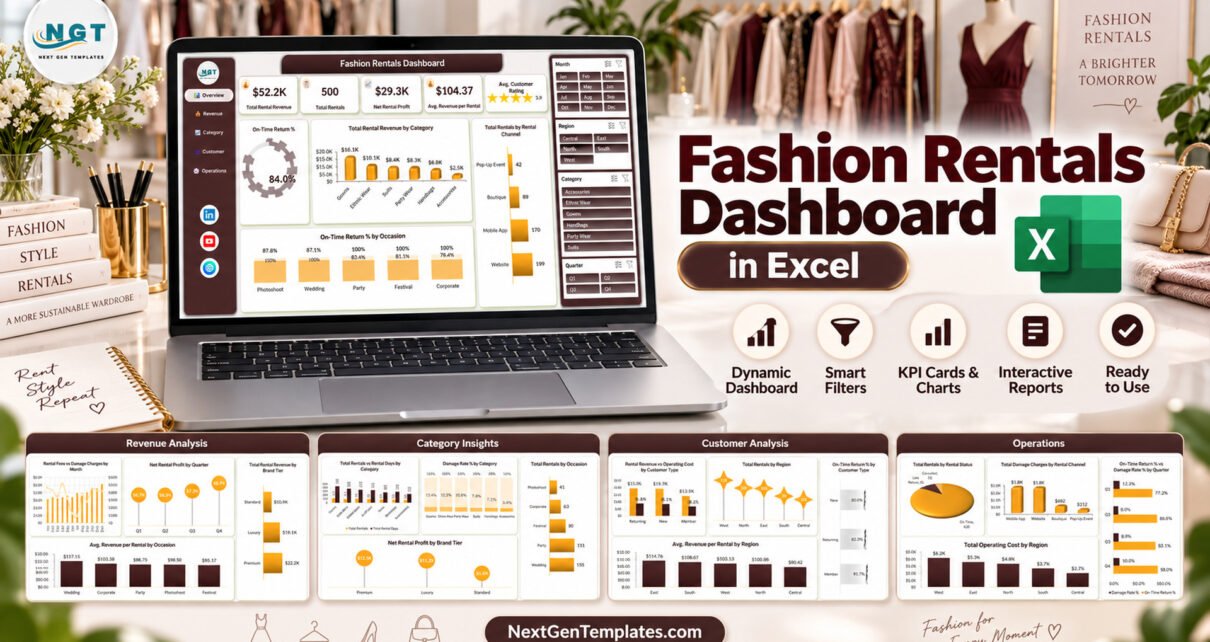
The Fashion Rentals Dashboard in Excel analyses 500 sample rentals with 5 KPI cards, 20 charts and 4 slicers across 5 linked pages. In the sample year it reports $52.2K of rental revenue, $29.3K of net rental profit, an 84.0% on-time return rate and a 9.8% damage rate, all recalculated the moment you refresh your own data.
Renting gowns, suits and ethnic wear is a margin game. Every late return blocks the next booking, every stained gown eats into profit, and every channel (website, app, store or pop-up) costs something different to run. Most rental owners keep bookings in a spreadsheet but never see those numbers together. This dashboard puts revenue, returns, damage and operating cost on five pages you can filter by month, region, category and quarter.

Key Features of the Fashion Rentals Dashboard in Excel
- Five KPI cards: Total Rental Revenue, Total Rentals, Net Rental Profit, Avg. Revenue per Rental and Avg. Customer Rating (3.9 out of 5 in the sample, drawn as stars).
- Twenty charts on five pages: each page carries four charts, named by what they measure, such as Damage Rate % by Category or Total Operating Cost by Region.
- Four slicers on every page: Month, Region, Category and Quarter filter all charts on the page at once.
- One-click navigation: Overview, Revenue, Category, Customer and Operations buttons in the left panel.
- Rental-specific data model: rental fee, late fees and damage charges are recorded separately from cleaning, logistics and operating cost, alongside rental days, security deposit and return status.
- No macros: the workbook is a standard .xlsx built on one Excel table and 25 PivotTables, so nothing has to be enabled.
Three facts worth knowing before you buy: the dashboard tracks 5 KPIs and 20 charts; all 25 PivotTables read from a single table named TblData; and the download includes the Excel Dashboard User Manual PDF.
Dashboard Pages Explanation
Page 1: Overview
The Overview shows the five KPI cards with On-Time Return %, Total Rental Revenue by Category, Total Rentals by Rental Channel and On-Time Return % by Occasion. In the sample, Gowns lead revenue with $16.1K, the Website books 199 of the 500 rentals and Photoshoot rentals come back on time most often (87.8%).
Page 2: Revenue Analysis
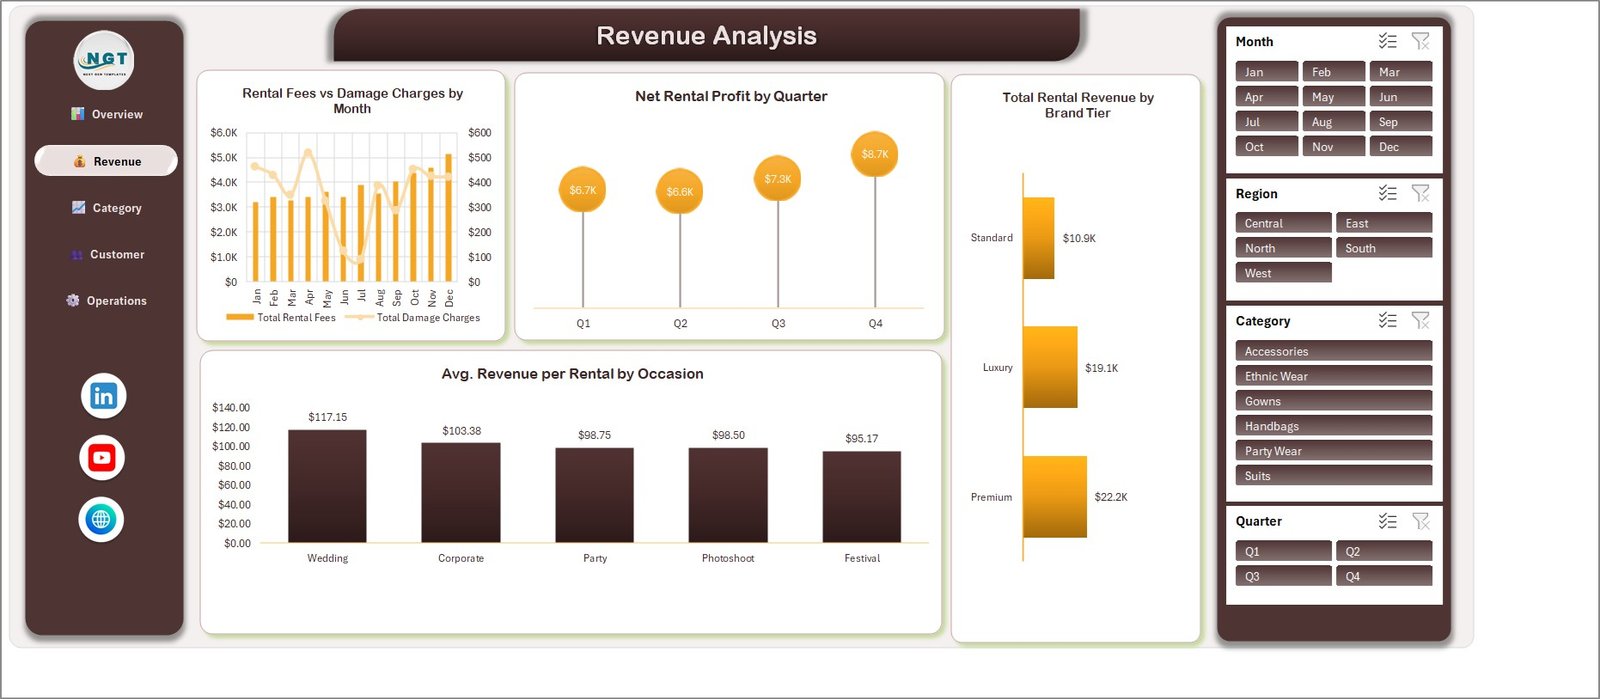
This page covers Rental Fees vs Damage Charges by Month, Net Rental Profit by Quarter, Total Rental Revenue by Brand Tier and Avg. Revenue per Rental by Occasion. Q4 is the most profitable quarter ($8.7K), Premium brands earn the most revenue ($22.2K) and wedding rentals carry the highest average ticket ($117.15).
Page 3: Category Insights
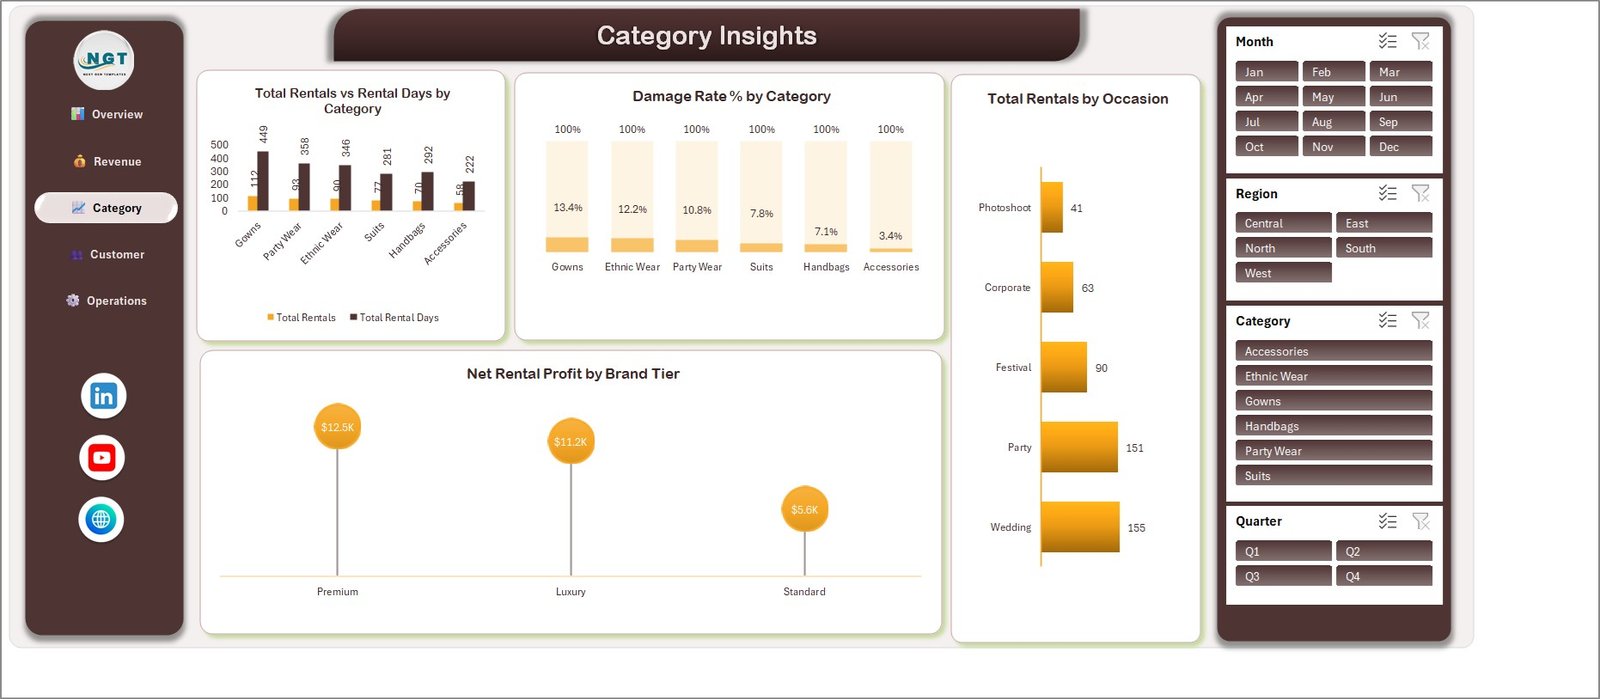
Category Insights compares Total Rentals vs Rental Days by Category, Damage Rate % by Category, Total Rentals by Occasion and Net Rental Profit by Brand Tier. Gowns are rented 112 times for 449 rental days and show the highest damage rate at 13.4%, while Accessories sit at 3.4%.
Page 4: Customer Analysis
This page shows Rental Revenue vs Operating Cost by Customer Type, Total Rentals by Region, On-Time Return % by Customer Type and Avg. Revenue per Rental by Region. Members return garments on time 91.7% of the time, compared with 80.0% for new customers, and the East region has the highest revenue per rental ($114.76).

Page 5: Operations
Operations brings together Total Rentals by Rental Status, Total Damage Charges by Rental Channel, On-Time Return % vs Damage Rate % by Quarter and Total Operating Cost by Region. The sample has 420 on-time returns, 55 late returns and 25 cancellations, and the on-time rate climbs from 77.2% in Q1 to 88.0% in Q4.

Data Sheet
The Data sheet is an Excel table with 500 fictional rentals from January to December 2025. Its 21 input columns run from Rental ID and Rental Date through Customer Type, Region, Rental Channel, Category, Brand Tier, Occasion, Rental Days, fees, costs, Security Deposit, Customer Rating, Rental Status and Damage Reported. Eight formula columns add Month, Year, Quarter and the status counters.
Support Sheet
The Support sheet stores the PivotTables behind each card and chart, laid out page by page. Refresh All keeps it in step with the Data table, so there is nothing to edit here.
Excel Dashboard vs. Google Sheets vs. Paid Rental Software: Feature Comparison
| Feature | Fashion Rentals Dashboard (Excel) | Build it yourself in Google Sheets | Paid rental software (Booqable, Rentle and similar) |
|---|---|---|---|
| Cost | ✅ $17.99 one-time | Free tool, but hours of build time | Recurring monthly subscription |
| Platform | Desktop Microsoft Excel | Browser | Browser and apps |
| Setup time | ✅ Under 15 minutes with your data | Days to design pivots and charts | Onboarding plus catalogue setup |
| Real-time team collaboration | Through OneDrive or SharePoint co-authoring | ✅ Built in | ✅ Built in |
| Mobile access | View only in Excel mobile | ✅ Yes | ✅ Yes |
| Customizable fields | ✅ Full control of columns and charts | ✅ Full control | Limited to vendor fields |
| Share with link | Via OneDrive | ✅ Yes | User seats required |
| Year-1 cost at 5 users | ✅ $17.99 total | Free plus build time | Plan fees for the whole year |
| Damage rate and on-time return charts | ✅ Ready-made | Must be built | Depends on plan |
| Online bookings and payments | ❌ Not included | ❌ Not included | ✅ Core feature |
For rental owners who want revenue, return and damage reporting without a monthly analytics bill, this Excel dashboard sits in the sweet spot; keep your booking tool for reservations and use the dashboard to analyse its export.
Who Should Use This Template
Perfect for:
- Dress, gown and ethnic-wear rental boutiques with bookings in a spreadsheet or booking-tool export
- Suit and occasion-wear rental shops selling through a website, app, store and pop-up events
- Analysts preparing monthly or quarterly rental reviews for owners, partners or investors
Not a fit if:
- You need a booking calendar, availability checks, deposits collection or online payments
- Your team works only in Google Sheets, Excel for the web or on phones
- You track every garment by item ID, size or condition history; this dashboard reports by category and brand tier
Real-World Use Cases
Priya owns a bridal and ethnic-wear rental studio with two locations. Before wedding season she filters Category Insights to Gowns and Ethnic Wear. The damage rate chart shows gowns are damaged almost four times as often as accessories, so she raises the gown security deposit and budgets extra cleaning cost.
Marcus runs a suit rental business with a website and regular pop-up events. Each quarter he compares Total Rentals by Rental Channel with Total Damage Charges by Rental Channel. The numbers tell him whether pop-ups bring enough bookings to justify their logistics cost.
Elena is the analyst at a subscription wardrobe start-up. She uses the Customer Analysis page to show that members return on time more often and generate more revenue than new customers, which supports the case for a membership discount.
Advantages of the Dashboard
- One-time cost: $17.99 on sale instead of a recurring analytics subscription.
- Profit, not just revenue: net rental profit is shown next to operating cost, so busy months that lose money stand out.
- Returns and damage made visible: on-time return and damage rate charts point to the categories, channels and customer types that cost you inventory.
- Fast filtering: four slicers answer questions like “how did handbags do in the North in Q3?” in seconds.
- Editable everything: it is your workbook, so you can rename categories, recolour charts or add PivotTables. Microsoft’s guide to creating a PivotTable is a good starting point.
Opportunities for Improvement
- Desktop Excel only: slicers and PivotCharts are designed for Microsoft 365 or Excel 2016 and later on the desktop, not Excel for the web or mobile.
- Manual refresh: charts update when you click Refresh All, not the moment you type a row.
- No garment-level view: there is no item ID, size or condition history, so you cannot see which individual dress is damaged most.
- Deposits and late fees are not charted separately: Security Deposit and Late Fees are stored in the Data table but have no dedicated chart; late fees are included in Total Rental Revenue.
- No targets: the pages show actuals only, with no budget or goal comparison.
Best Practices
- Keep new rentals inside the TblData table so Refresh All includes them automatically.
- Use consistent spellings for categories, channels and regions; “Ethnic Wear” and “Ethnicwear” become two separate bars.
- Record cancelled bookings with a zero rental fee, as the sample does, so revenue per rental is not diluted by phantom income.
- Log damage charges on the rental where the damage happened, so Damage Rate % by Category stays accurate.
- Clear slicer filters before sharing a screenshot, or note which filters are applied.
Explore Relevant Templates
If you run a broader rental business, read our walkthrough of the Rental Services Dashboard in Excel. Fashion retailers who sell rather than rent may prefer the Fashion Boutiques Dashboard in Excel, and premium accessory sellers can look at the Luxury Handbags Dashboard in Excel. For month-by-month targets, the Fast Fashion Brands KPI Dashboard in Excel takes a KPI-scorecard approach.
On NextGenTemplates you can buy the Rental Services Dashboard, the Fashion and Apparel Dashboard in Google Sheets or browse all Excel dashboard templates.
Frequently Asked Questions
What does the Fashion Rentals Dashboard in Excel track?
It tracks Total Rental Revenue, Total Rentals, Net Rental Profit, Avg. Revenue per Rental and Avg. Customer Rating, plus 20 charts covering on-time returns, damage rate, rental days, damage charges and operating cost by category, occasion, brand tier, channel, region and customer type.
Which Excel version do I need?
Use desktop Microsoft Excel: Microsoft 365, Excel 2021, 2019 or 2016 on Windows, or a recent Excel for Mac. The file uses PivotTables, PivotCharts and slicers and has no macros. Excel for the web and the mobile apps are not supported for working with the dashboard.
How long does setup take?
Usually under 15 minutes. Clear the 500 sample rows, paste your rentals into the same input columns, and click Data, then Refresh All. The eight helper columns calculate automatically and the included user manual PDF covers each step.
Can I use it for rentals other than clothing?
Yes, as long as your data fits the same columns. Categories, occasions, channels and brand tiers are plain text, so a costume, jewellery or baby-gear rental shop can type its own values and refresh. The page titles and labels mention fashion, but you can rename them.
How does this compare to rental software such as Booqable or Rentle?
Rental software manages bookings, availability and payments for a monthly fee. This dashboard does not take bookings; it is a one-time $17.99 reporting workbook that analyses the rentals you export. Many owners use both together.
Is there a Power BI or Google Sheets edition?
Not for this dashboard at the moment. The closest browser-based option is the Fashion and Apparel Dashboard in Google Sheets on NextGenTemplates, which focuses on retail fashion sales rather than rentals.
About the Author
Built by PK, Microsoft Certified Professional with 15+ years of Excel, Google Sheets and Power BI experience. Founder of NextGenTemplates, reaching 300K+ subscribers across YouTube channels. Every template is hand-built and tested before release.
Conclusion
If your rental business already records bookings, this workbook turns them into a clear picture of revenue, profit, returns and damage in one refresh. Five pages, twenty charts and four slicers give owners and analysts the answers they need for pricing, deposits and channel decisions, without another subscription.
👉 Click here to Purchase the Fashion Rentals Dashboard in Excel
✅ Instant download · One-time payment · No subscription
🎥 More tutorials: Youtube.com/@PKAnExcelExpert
Last updated: September 2026