Home>Blogs>Charts and Visualization>Multiple KPIs Visualization in Excel>Multiple KPI Visualization – 3
Multiple KPI Visualization – 3
10
Jul 2019
237Comments Off on Multiple KPI Visualization – 3
PK
Meet PK, the founder of PK-AnExcelExpert.com! With over 15 years of experience in Data Visualization, Excel Automation, and dashboard creation. PK is a Microsoft Certified Professional who has a passion for all things in Excel. PK loves to explore new and innovative ways to use Excel and is always eager to share his knowledge with others. With an eye for detail and a commitment to excellence, PK has become a go-to expert in the world of Excel. Whether you're looking to create stunning visualizations or streamline your workflow with automation, PK has the skills and expertise to help you succeed. Join the many satisfied clients who have benefited from PK's services and see how he can take your Excel skills to the next level!
https://www.pk-anexcelexpert.com
Related Articles
Autonomous Vehicle KPI Dashboard in Excel
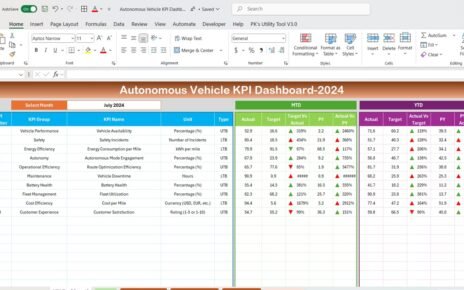
The rise of autonomous vehicles (AVs) marks a significant advancement in the transportation industry, with the promise of safer, more
Courier Service KPI Dashboard in Excel
In the bustling world of logistics, the key to staying competitive is not just about the swift delivery of packages,
Profitability Analysis KPI Dashboard in Excel
In today’s fast-paced business world, monitoring profitability is crucial for decision-making and business growth. One effective way to track profitability