In today’s fast-paced business world, managing risks effectively is paramount to ensuring the smooth running of any organization. Whether you’re
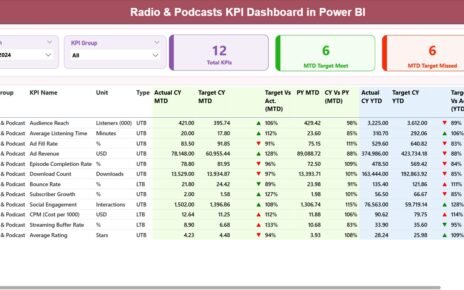
Radio and podcast platforms continue to grow rapidly as content consumption shifts to audio-first experiences. Listeners now prefer on-the-go content,
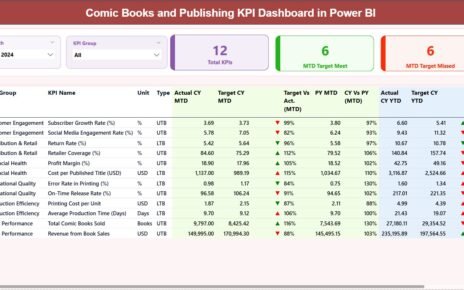
The comic book and publishing industry grows every year, and so does the need for clear insights, fast decision-making, and