Managing IT and tech resources efficiently is more critical than ever. From tracking project hours to measuring system uptime, organizations need to monitor key metrics consistently. That’s where the IT and Tech Resource Allocation KPI Dashboard in Excel becomes a powerful asset. This dashboard lets you visualize, track, and optimize your resource allocation process without expensive tools or steep learning curves.
In this article, we’ll walk you through everything you need to know about this dashboard: its structure, functionality, advantages, best practices, and frequently asked questions.
Click to Purchases IT and Tech Resource Allocation KPI Dashboard in Excel
What is an IT and Tech Resource Allocation KPI Dashboard?
An IT and Tech Resource Allocation KPI Dashboard is an Excel-based template that helps you monitor key performance indicators (KPIs) related to your tech team’s workload, project utilization, efficiency, and system performance. This tool consolidates your actual data, targets, and historical performance into one dynamic, visual interface. You can measure both Month-To-Date (MTD) and Year-To-Date (YTD) performance easily.
It is specifically designed for:
- IT managers
- Project coordinators
- Resource planners
- Tech team leaders
With this Excel dashboard, tracking becomes easy, decisions become faster, and resource optimization becomes more effective.
Worksheets Included in the Dashboard
This template includes 7 structured worksheets, each serving a unique purpose:
Home Sheet
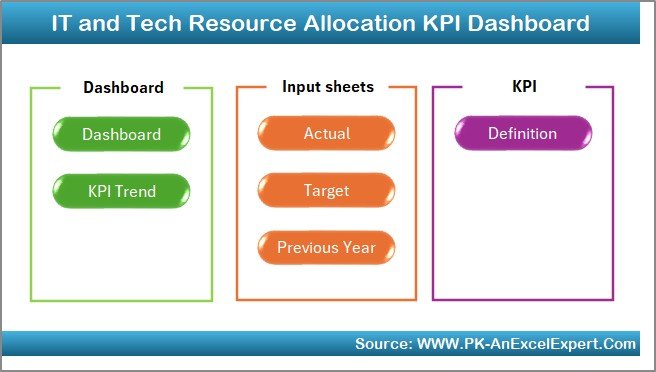
This is the navigation hub. It features 6 clickable buttons that allow you to quickly move to different sheets of the dashboard. It saves time and enhances user experience.
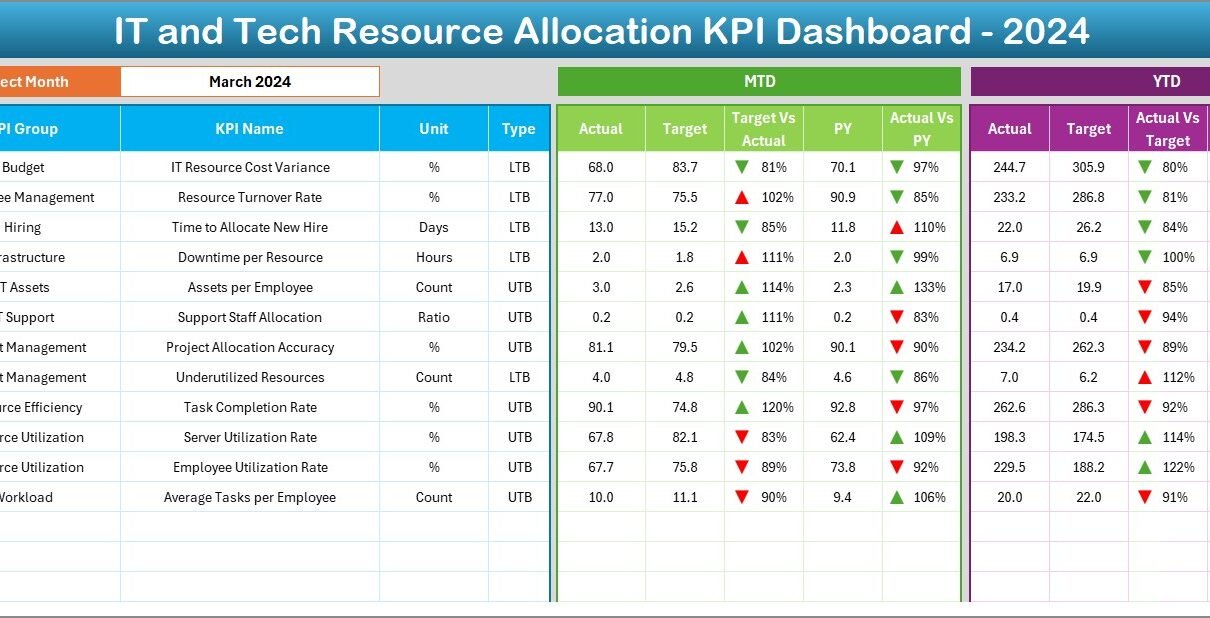
Dashboard Sheet
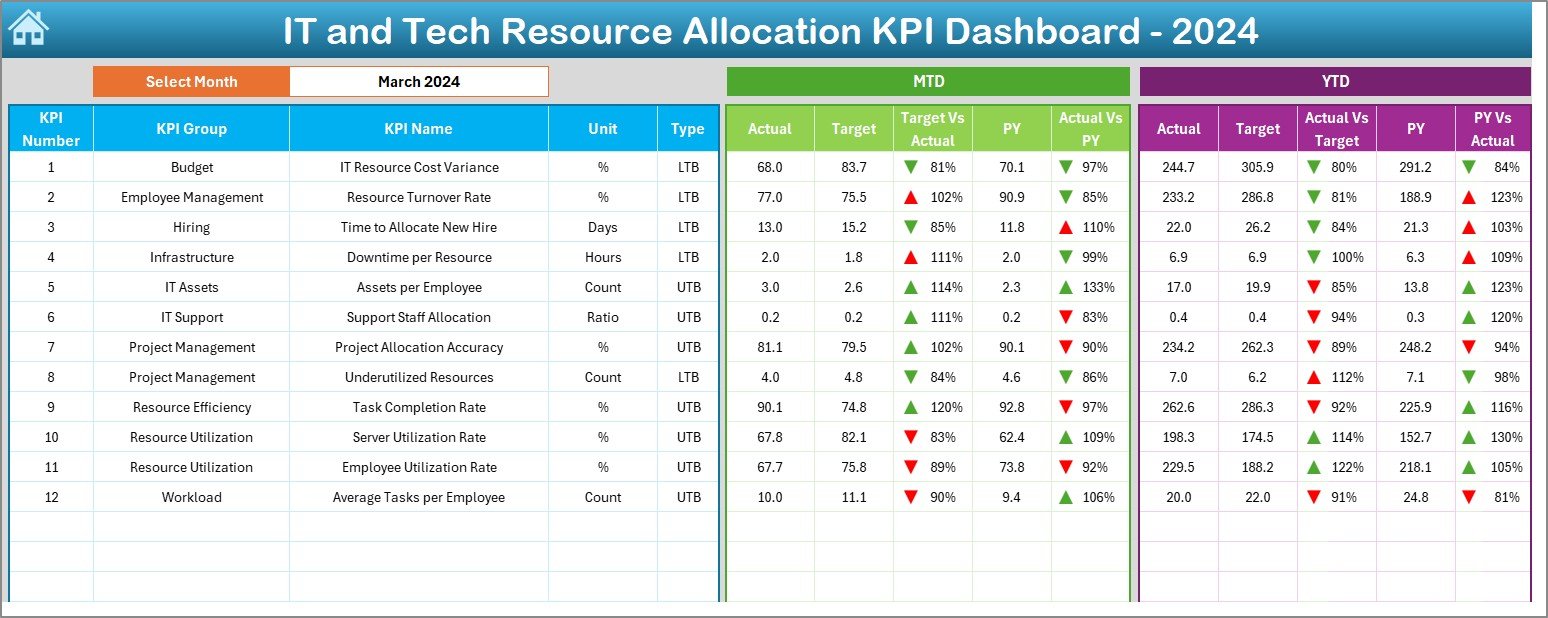
The core of the template, this sheet provides a complete snapshot of all KPIs.
- Select the Month from a dropdown in cell
D3. - Automatically updates all metrics: MTD Actual, Target, PY (Previous Year).
- Conditional formatting uses up and down arrows to visually indicate performance changes.
- Displays YTD metrics side-by-side with targets and historical values.
This sheet provides a detailed view of each KPI’s trend:
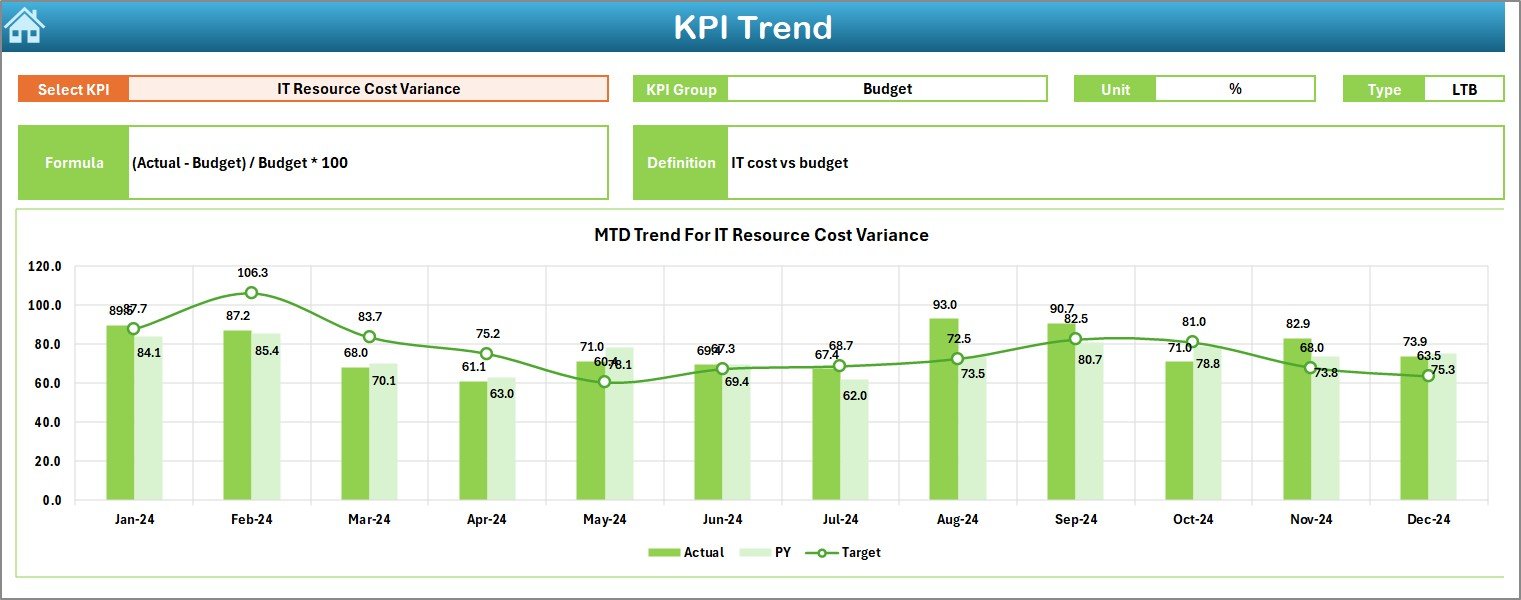
- Select any KPI from the dropdown in
C3. - Displays KPI Group, Unit, Type (UTB or LTB), Formula, and Definition.
- Shows dynamic MTD and YTD charts for Actual, Target, and PY.
Click to Purchases IT and Tech Resource Allocation KPI Dashboard in Excel
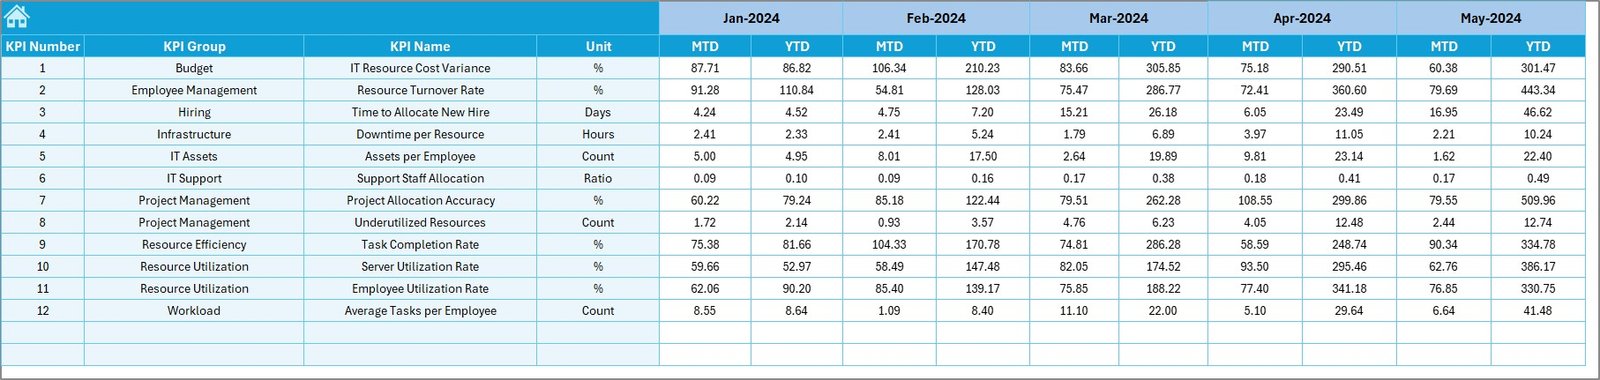
Actual Numbers Input Sheet
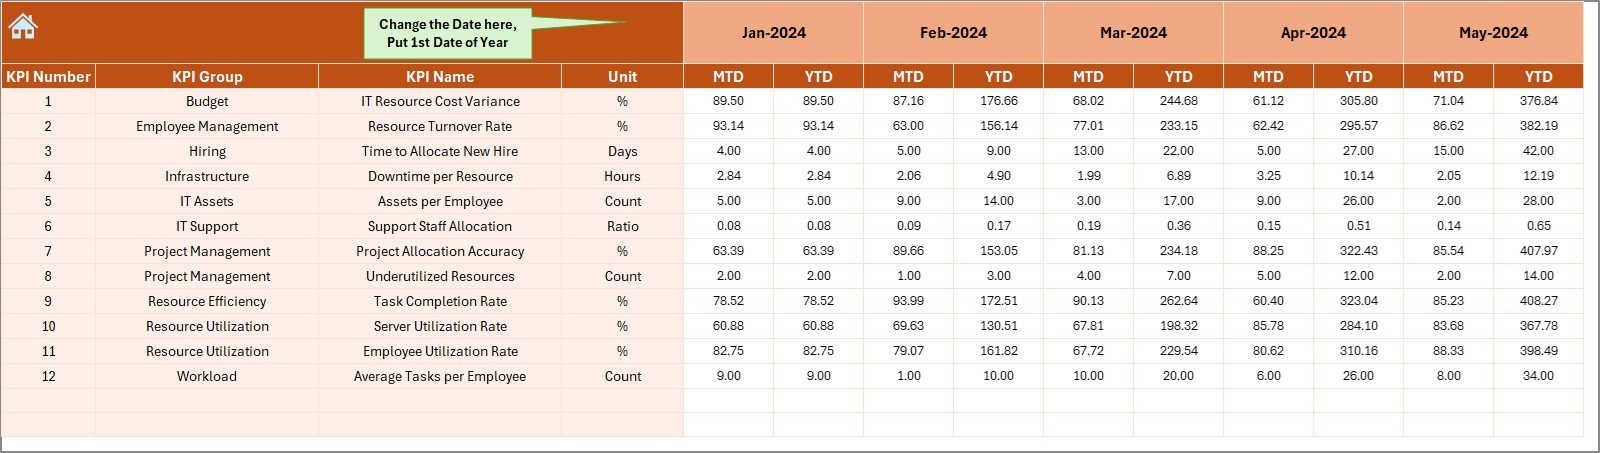
Here, users enter real-time performance data:
- Update monthly figures for both MTD and YTD.
- Change the first month of the year using cell
E1to shift the calendar.
Target Sheet
Enter target values here for each KPI:
- Monthly Target (MTD)
- Cumulative Target (YTD)
Previous Year Number Sheet
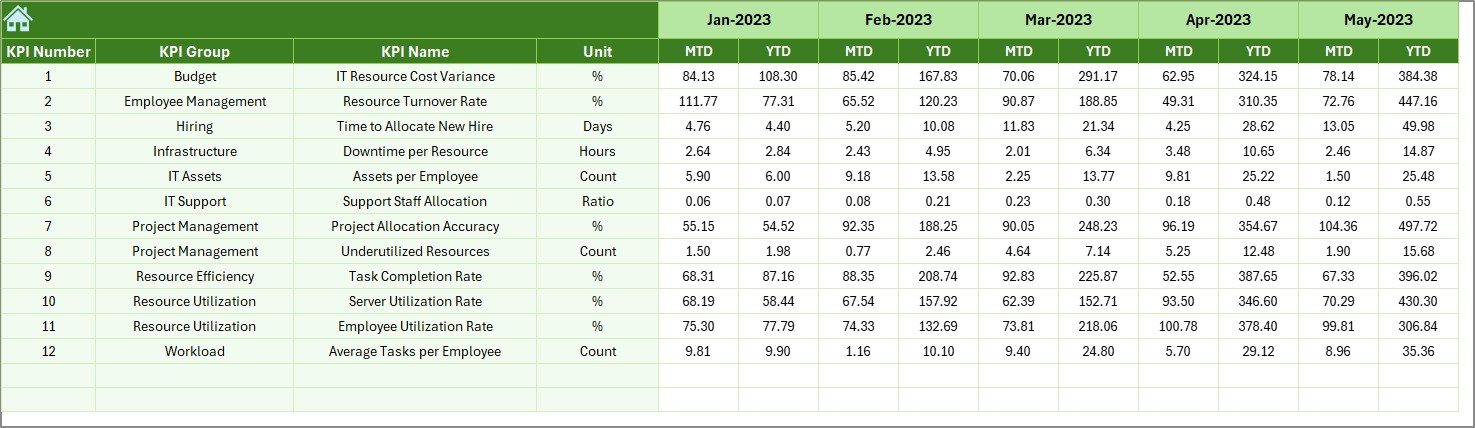
This sheet stores last year’s monthly MTD and YTD numbers:
- Helps in PY vs Actual comparison.
- Vital for identifying year-over-year performance shifts.
KPI Definition Sheet
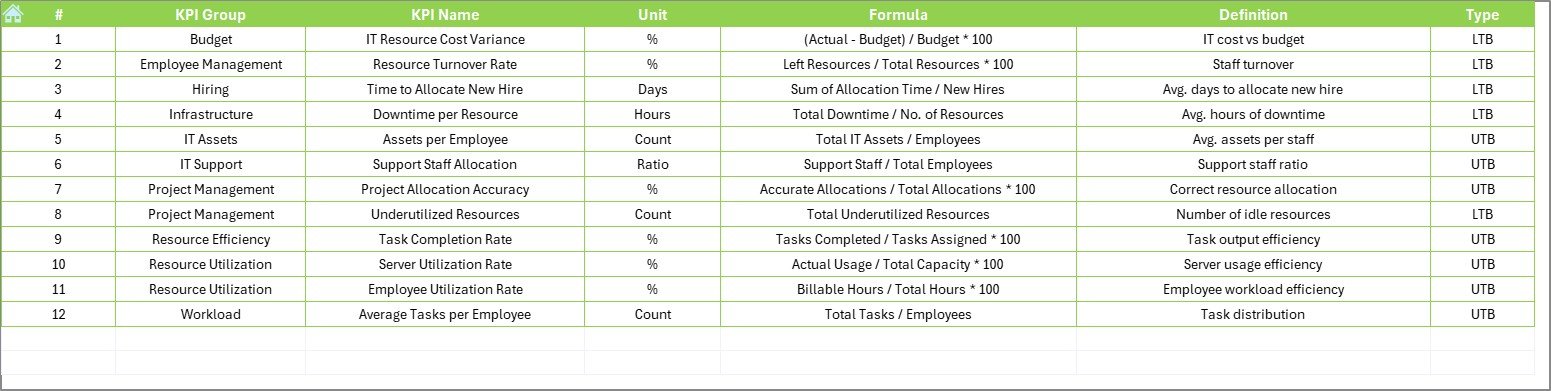
This reference sheet includes:
- KPI Name
- KPI Group
- Unit of Measure
- KPI Formula
- Brief Definition
This sheet helps new users understand what each KPI measures and how it’s calculated.
Advantages of IT and Tech Resource Allocation KPI Dashboard
🔢 Centralized Data Visualization
You no longer need to sift through multiple reports. All your data is available in one easy-to-read visual format.
⏳ Saves Time and Improves Efficiency
Dynamic filters and dropdowns speed up the analysis process, enabling quicker decisions.
📊 Real-Time Performance Monitoring
Track MTD and YTD performance along with targets and past data.
🌐 No Additional Software Required
Everything runs on Microsoft Excel. No need for Power BI or advanced coding.
🌟 User-Friendly Interface
The dashboard is interactive, intuitive, and easily customizable.
Best Practices for Using the KPI Dashboard
To make the most of your IT and Tech Resource Allocation KPI Dashboard, follow these best practices:
1. Define Clear KPIs
Make sure the KPIs you’re tracking align with your department’s strategic goals. Use SMART criteria: Specific, Measurable, Achievable, Relevant, and Time-bound.
2. Update Data Regularly
Don’t wait till the end of the quarter. Update MTD and YTD values consistently to get accurate insights.
3. Monitor Trends, Not Just Metrics
Use the KPI Trend Sheet to understand patterns over time. This helps in identifying underlying issues or opportunities.
4. Use Conditional Formatting Effectively
The visual cues (up/down arrows) can highlight performance gaps immediately. Don’t ignore these signals.
5. Train Your Team
Ensure everyone involved in resource planning knows how to use the dashboard. A quick training session can go a long way.
6. Review Past Performance
Compare against last year’s numbers to identify growth or decline in resource utilization.
7. Keep Definitions Updated
If you modify any KPI, ensure you update the KPI Definition sheet so that the entire team is aligned.
Why Excel for KPI Tracking?
You might wonder, why not use a project management tool or BI software? Here’s why Excel remains a strong choice:
- Low Cost: No license fee required.
- Flexibility: Customize as per your team’s needs.
- Accessibility: Most users are already familiar with Excel basics.
- Integrations: Easily import data from other tools or export for reporting.
Click to Purchases IT and Tech Resource Allocation KPI Dashboard in Excel
Sample KPIs to Include in the Dashboard
Here are some common and effective KPIs you can track using this dashboard:
- Resource Utilization Rate (%): Hours worked vs. available hours
- Project Completion Rate (%): Completed vs. total projects
- System Downtime (hrs): Measured monthly or weekly
- Bug Resolution Time (days): From report to fix
- Ticket Volume (#): Total support tickets
- On-Time Delivery (%): Milestones met on time
- IT Cost per Employee ($): Total IT expense / headcount
- Service Request Resolution Rate (%): Closed vs. opened requests
- Time to Hire (IT roles) (days): Sourcing to onboarding
- Training Hours per Employee (hrs): Monthly or quarterly
Each of these can be marked as:
- UTB (Upper the Better) or
- LTB (Lower the Better)
How to Customize the Dashboard for Your Organization
If you want to tailor the dashboard for your team:
- Add More KPIs – Go to the KPI Definition sheet and insert new rows.
- Modify Charts – Edit the source data range to include new entries.
- Adjust Conditional Formatting – Add rules to reflect your business color themes.
- Change Units/Labels – Update unit or label fields as per your metric requirements.
How Does This Dashboard Help in Decision Making?
This dashboard offers instant visibility into what’s working and what needs attention. You can:
- Prioritize resource allocation.
- Identify underperforming areas.
- Justify budget increases with historical data.
- Present clear reports to senior management.
By turning raw data into visual insights, this dashboard becomes a strategic decision-making tool.
Conclusion
The IT and Tech Resource Allocation KPI Dashboard in Excel is a powerful, cost-effective solution for any organization aiming to improve how it tracks and utilizes IT resources. It blends simplicity with impact, enabling real-time insights without the need for complex tools.
Frequently Asked Questions (FAQs)
1. Who should use this dashboard?
Anyone in charge of IT operations, resource planning, or performance analysis will find this dashboard extremely useful. It suits IT Managers, Team Leads, and Project Coordinators.
2. Can I add or remove KPIs from the dashboard?
Yes, the dashboard is fully customizable. Use the KPI Definition sheet to add new metrics and update formulas accordingly.
3. How often should I update the actual and target data?
Ideally, you should update it monthly to ensure accuracy and meaningful trend analysis.
4. Do I need advanced Excel skills to use this dashboard?
Not at all. Basic knowledge of Excel (using drop-downs, entering data, and reading charts) is sufficient. Everything else is automated.
5. Can I use this template for other departments besides IT?
Absolutely. Just replace the KPIs with those relevant to your department—such as Finance, HR, or Marketing—and update the labels accordingly.
6. Is this compatible with older Excel versions?
Yes, as long as your Excel version supports drop-downs, conditional formatting, and basic charts, it should work fine.
Click to Purchases IT and Tech Resource Allocation KPI Dashboard in Excel
Visit our YouTube channel to learn step-by-step video tutorials
Watch the step-by-step video tutorial: