In today’s dynamic educational environment, managing risk efficiently is crucial. Institutions are constantly facing challenges such as student dropouts, compliance issues, funding shortages, or low training effectiveness. To overcome these challenges, they must measure and track performance metrics that matter. That’s exactly where the Education and Learning Risk Management KPI Dashboard in Excel steps in. This article will guide you through everything you need to know about this powerful tool.
Click to Purchases Education and Learning Risk Management KPI Dashboard in Excel
What is an Education and Learning Risk Management KPI Dashboard?
A Risk Management KPI Dashboard for Education and Learning is an interactive Excel-based tool that tracks key performance indicators (KPIs) specifically related to operational, academic, and compliance risks. It allows decision-makers to monitor critical metrics in one place and take proactive action to minimize potential risks.
Why Do You Need a Risk Management KPI Dashboard in Education?
Educational institutions operate in a high-stakes environment. From data privacy and student satisfaction to course completion and faculty turnover, there are many moving parts. Tracking these using spreadsheets or manual reports can be time-consuming and error-prone. A KPI dashboard helps by:
- Centralizing critical risk-related metrics
- Providing quick insights using charts and tables
- Helping teams track progress against targets
- Allowing monthly and yearly comparison of key indicators
Key Features of the Dashboard
This ready-to-use Excel dashboard comes packed with powerful features. Let’s walk through the key components:
Click to Purchases Education and Learning Risk Management KPI Dashboard in Excel
Home Sheet
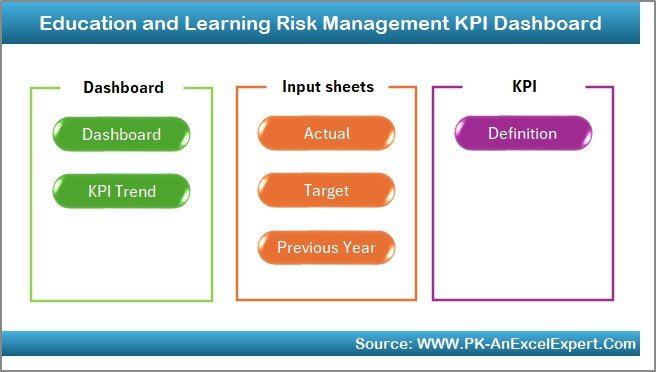
The Home sheet acts as a navigation hub. It contains 6 clickable buttons that lead you to different sections of the dashboard. No need to scroll or search manually.
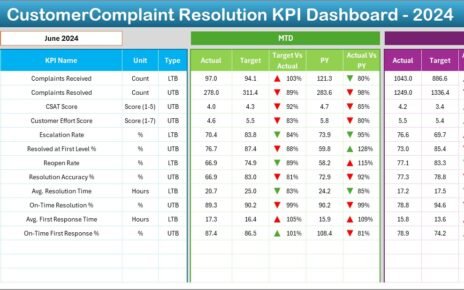
Dashboard Sheet Tab
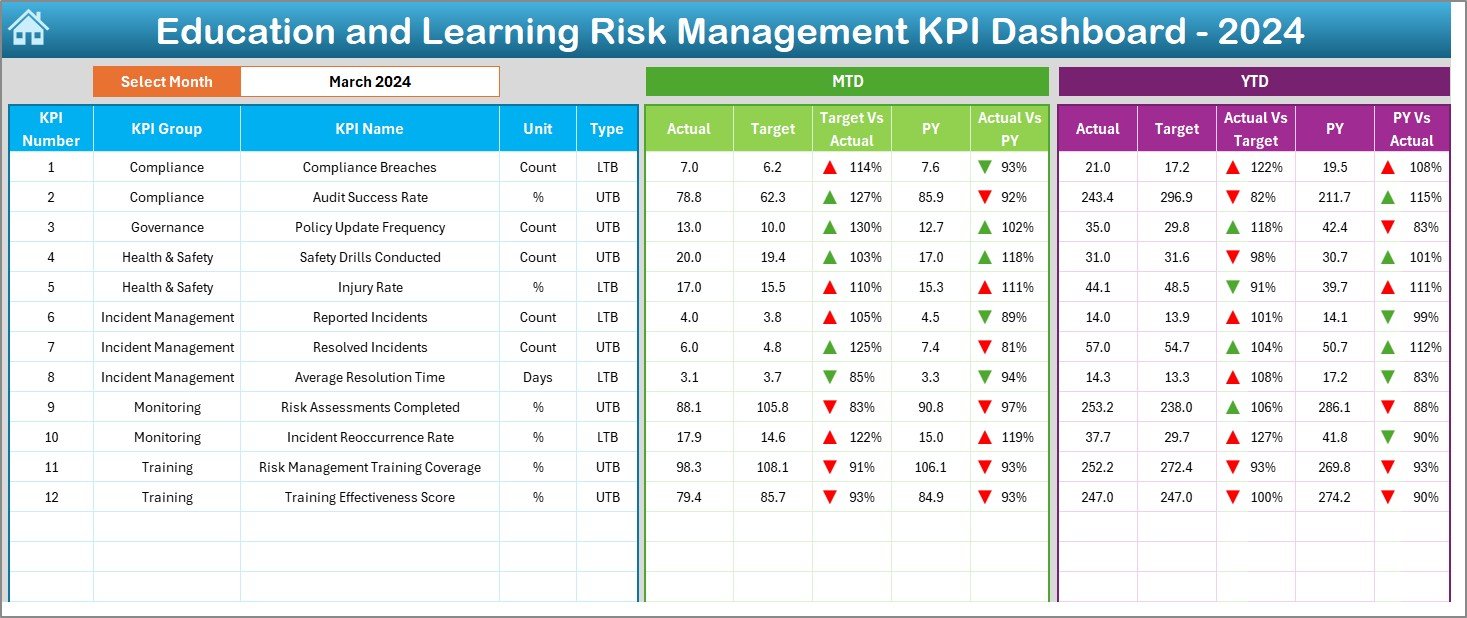
This is where all the magic happens. Once you select the month using the dropdown in cell D3, the dashboard automatically updates with:
- MTD (Month-to-Date) Actual, Target, and Previous Year data
- YTD (Year-to-Date) performance
- Conditional formatting with up/down arrows to quickly interpret trends
KPI Trend Sheet Tab
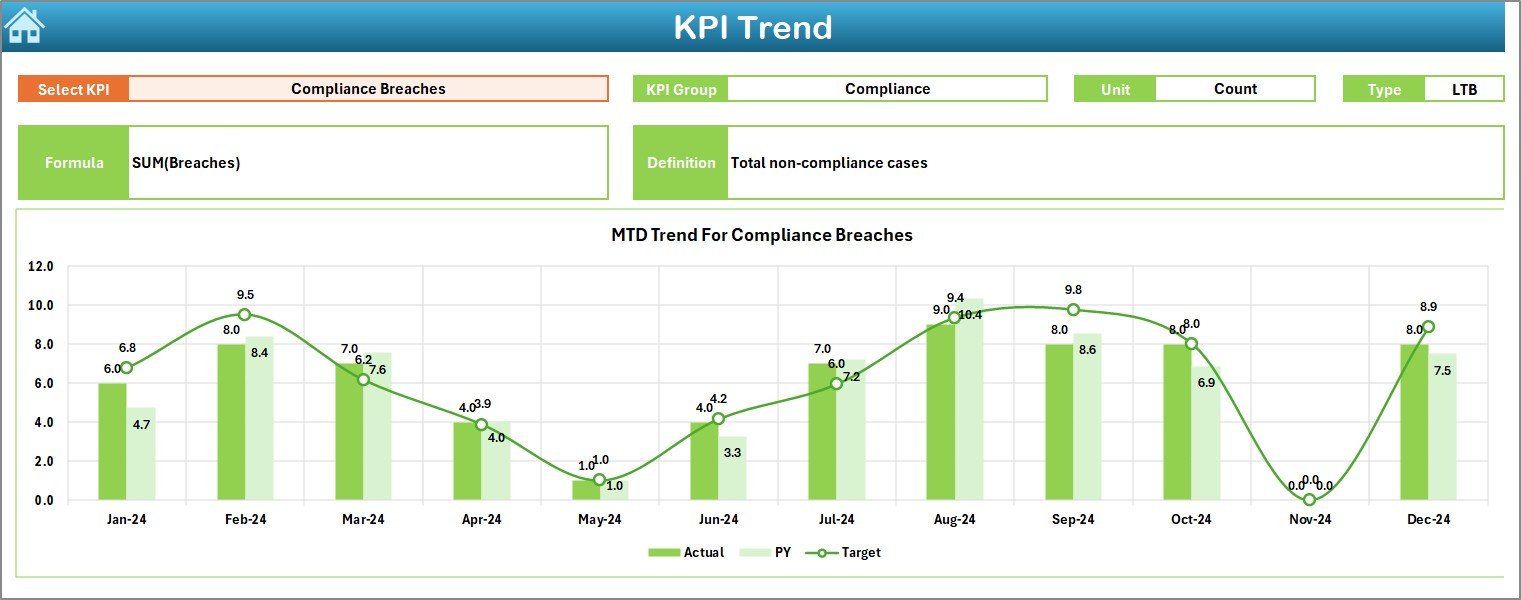
Want to dig deeper into individual KPIs? This sheet lets you select a KPI from a dropdown (cell C3) and view:
- KPI Group and Unit
- Type of KPI: LTB (Lower the Better) or UTB (Upper the Better)
- Formula and definition of the selected KPI
- Actual, Target, and Previous Year trends displayed as line graphs for MTD and YTD
Actual Numbers Input Sheet
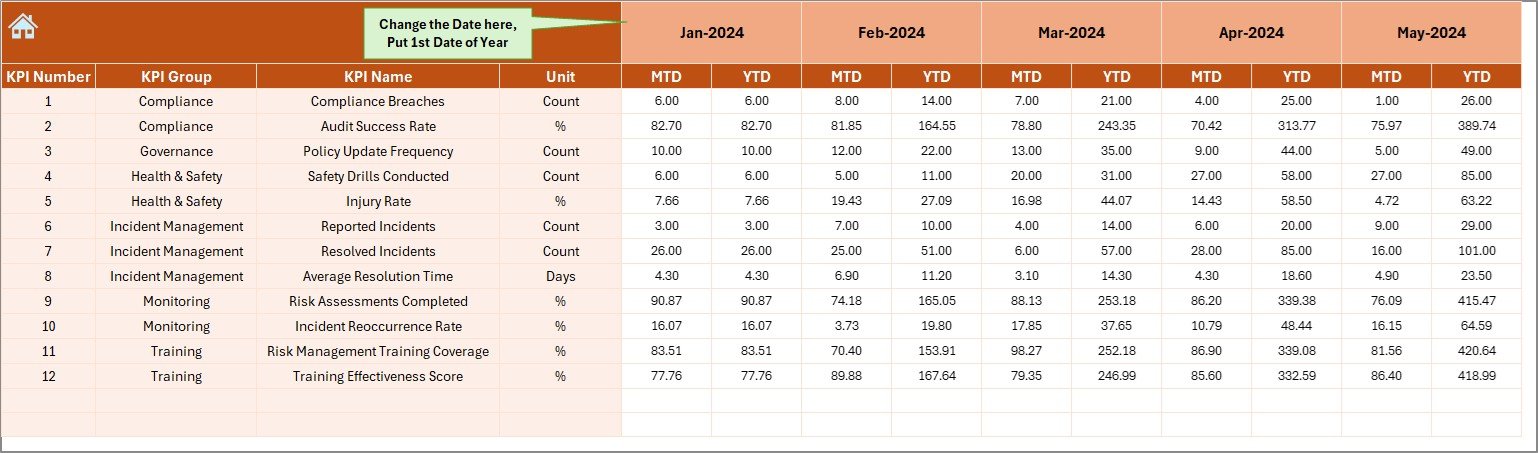
Here you input actual performance numbers for each KPI. Simply select the first month of the year in cell E1 and begin entering data for MTD and YTD.
Target Sheet Tab
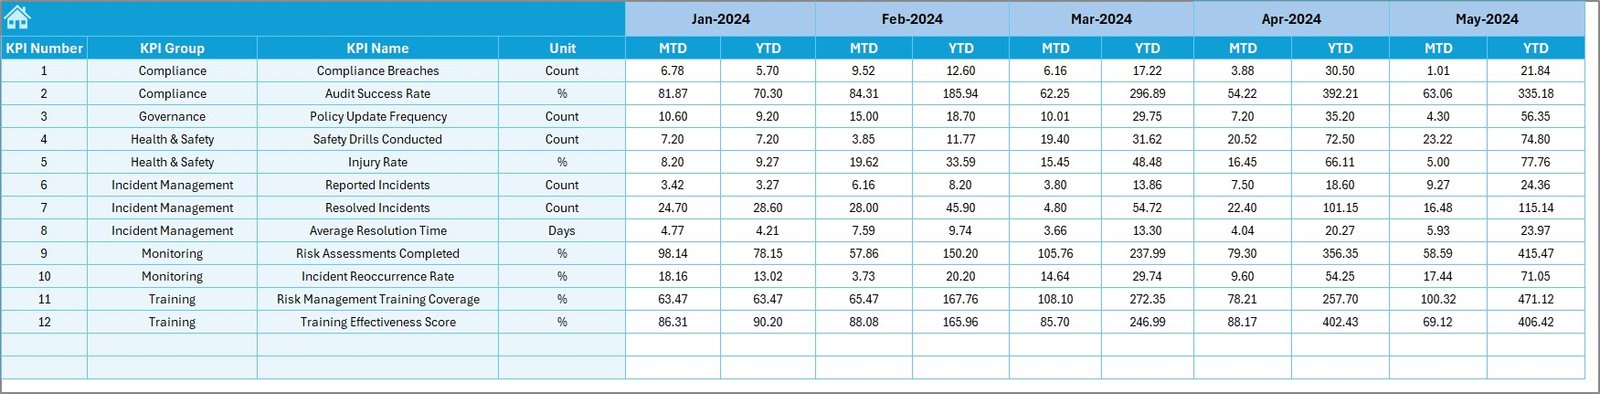
This tab lets you set the expected performance targets for each KPI on a monthly basis for both MTD and YTD.
Previous Year Number Sheet Tab
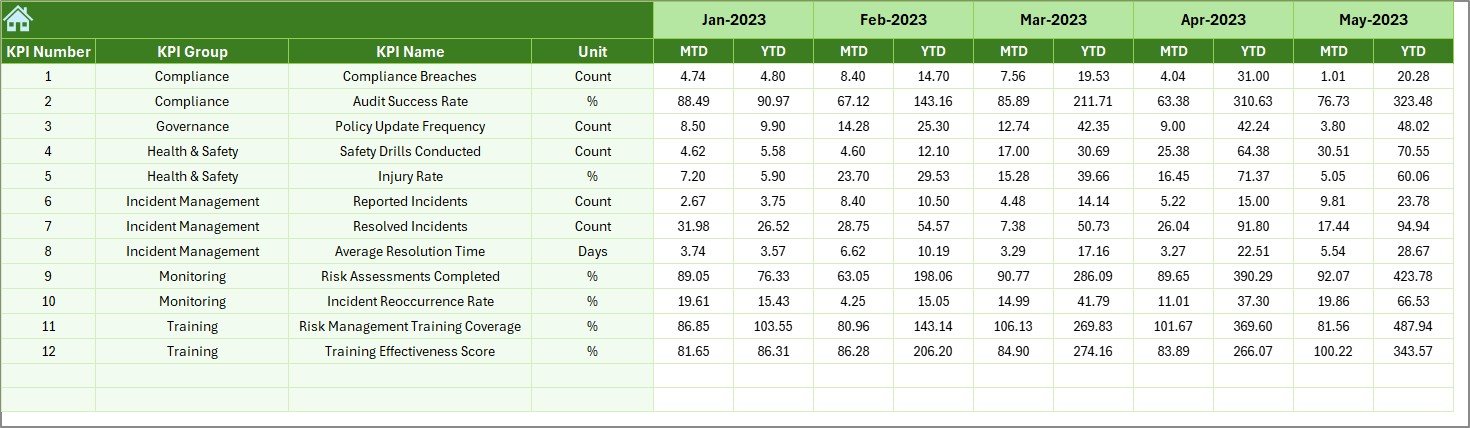
Historical performance data is essential for meaningful analysis. This sheet is where you enter last year’s actual figures.
KPI Definition Sheet Tab
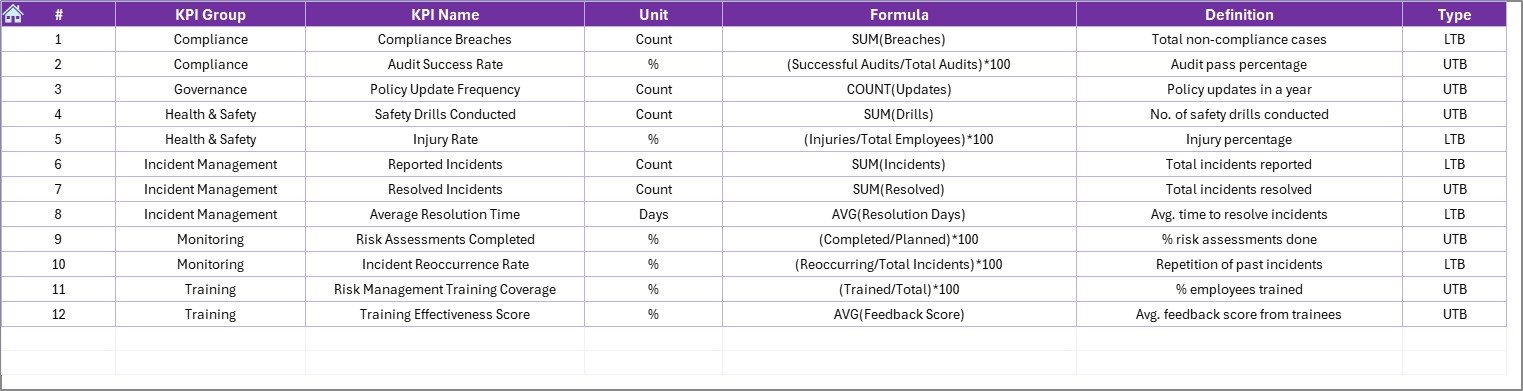
This is your KPI reference manual. You can document each KPI’s name, group, unit, formula, and short definition.
Advantages of Using This Dashboard
Let’s explore the key benefits you gain from this Excel-based dashboard:
✨ Complete Customization: Easily add, remove, or edit KPIs as needed.
⏳ Saves Time: No need to create reports manually each month.
📊 Data-Driven Decisions: Make informed decisions using real-time data.
📈 Visual Insights: Quickly grasp performance with charts and conditional formatting.
💡 Proactive Risk Management: Identify issues before they escalate.
Best Practices for the Education Risk Management Dashboard
To get the most value from this tool, follow these best practices:
✅ Define KPIs Clearly
Ensure that every stakeholder understands what each KPI represents. Use the KPI Definition tab effectively.
✅ Maintain Data Regularly
Update actual, target, and previous year numbers on time every month. This ensures your dashboard stays relevant.
✅ Review Trends Monthly
Make it a routine to check the KPI Trend tab for early warnings. Trends reveal a lot that one-time values might hide.
✅ Align KPIs with Strategic Goals
Every KPI should tie back to a strategic goal such as improving student satisfaction or reducing financial risk.
✅ Keep It Simple
Avoid overcrowding your dashboard. Focus on 10-15 impactful KPIs instead of tracking everything.
Sample KPIs You Can Track
Click to Purchases Education and Learning Risk Management KPI Dashboard in Excel
Here are some KPIs you can include in the dashboard:
- Student Dropout Rate (LTB)
- Course Completion Rate (UTB)
- Training Effectiveness Score (UTB)
- Financial Aid Error Rate (LTB)
- Data Security Incidents (LTB)
- Faculty Turnover Rate (LTB)
- Student Satisfaction Index (UTB)
- Curriculum Review Timeliness (UTB)
How to Get Started
- Download the dashboard template
- Populate the KPI Definition, Target, and Previous Year tabs
- Start entering actual numbers month-wise
- Select the month in the Dashboard tab to view performance
This Excel file doesn’t require advanced Excel skills. It uses dropdowns, conditional formatting, and charts with formulas—no complex coding needed.
Conclusion
The Education and Learning Risk Management KPI Dashboard in Excel brings structure and clarity to risk tracking. It transforms raw data into actionable insights, empowering educational leaders to manage risk efficiently. Whether you run a university, training institute, or school, this dashboard helps you stay on top of your KPIs and achieve your strategic goals.
Frequently Asked Questions (FAQs)
1. Who should use this KPI Dashboard?
This dashboard is ideal for school administrators, university deans, training managers, and compliance teams in the education sector.
2. Do I need advanced Excel skills to use this template?
No. The dashboard is user-friendly and uses basic Excel features like data validation, charts, and formulas.
3. Can I add or modify KPIs?
Yes. You can easily customize the KPI list, units, and targets in the respective tabs.
4. How often should I update the dashboard?
You should update the dashboard monthly to track real-time trends and take timely action.
5. What is the difference between MTD and YTD?
MTD (Month-to-Date) shows performance in the selected month. YTD (Year-to-Date) aggregates performance from the start of the year till the selected month.
6. Can this dashboard handle multi-campus data?
Yes. You can include additional columns or create filters to separate data by campus.
7. Is this dashboard shareable with my team?
Absolutely. You can share the Excel file across departments and use shared drives for collaboration.
Click to Purchases Education and Learning Risk Management KPI Dashboard in Excel
Visit our YouTube channel to learn step-by-step video tutorials