Customer Relationship Management (CRM) is critical to the growth and success of any business. It involves strategies, technologies, and practices to manage and analyze customer interactions and data, ultimately enhancing customer relationships and driving business growth. One of the most powerful tools for CRM is Power BI, a business analytics service by Microsoft that helps you visualize and share insights from your data.
In this article, we will dive into the Customer Relationship Management Dashboard in Power BI, explore its features, and discuss how it can optimize your CRM strategy. Whether you’re managing customer relationships, tracking sales, or analyzing data, a CRM dashboard in Power BI provides valuable insights that help guide decision-making and improve customer experience.
Click to Purchases Customer Relationship Management Dashboard in Power BI
What Is a Customer Relationship Management Dashboard in Power BI?
A Customer Relationship Management (CRM) Dashboard in Power BI is a ready-to-use data visualization tool that integrates and analyzes key CRM data, enabling businesses to monitor their customer relationships effectively. This Power BI dashboard pulls data from multiple sources, including Excel files, and presents it visually in an easy-to-understand format.
Key Features of the CRM Dashboard in Power BI
The CRM Dashboard in Power BI comes with various functionalities designed to simplify customer relationship tracking. The following are the key pages and features of the dashboard:
Overview Page
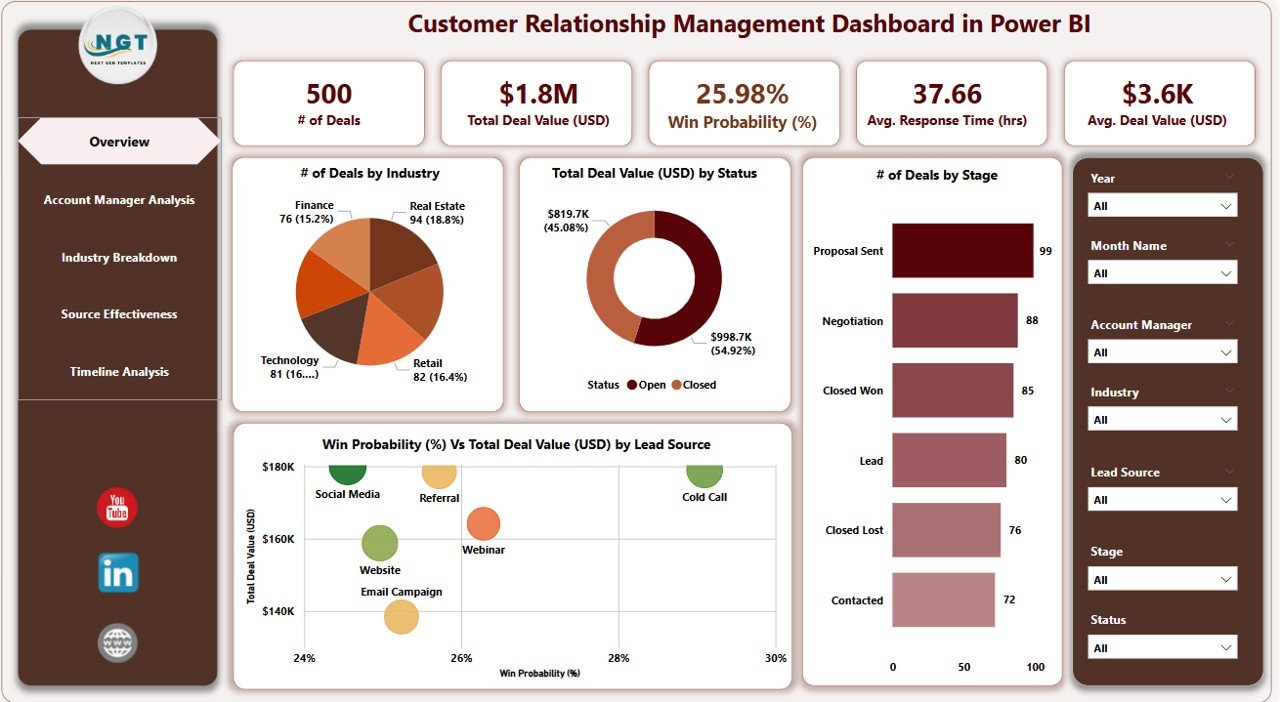
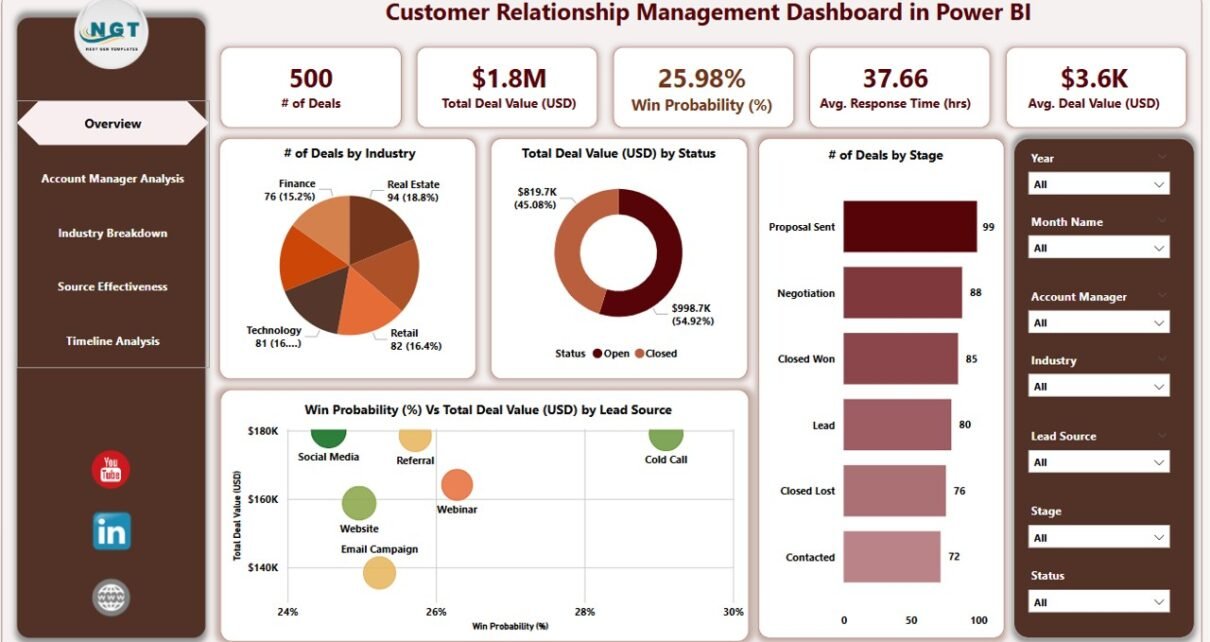
The Overview Page is the main dashboard of the CRM Power BI tool. It provides a snapshot of the CRM metrics that matter most. Key features of this page include:
-
7 slicers for filtering and fine-tuning the data.
5 cards summarizing key metrics such as:
- Number of Deals by Industry.
- Total Deal Value (USD) by Status.
- Number of Deals by Stage.
- Win Proclivity (%) vs Total Deal Value (USD) by Lead Source.
This page provides quick insights into deal status, lead sources, and win probabilities, making it ideal for understanding the overall health of customer relationships.
Account Manager Analysis Page
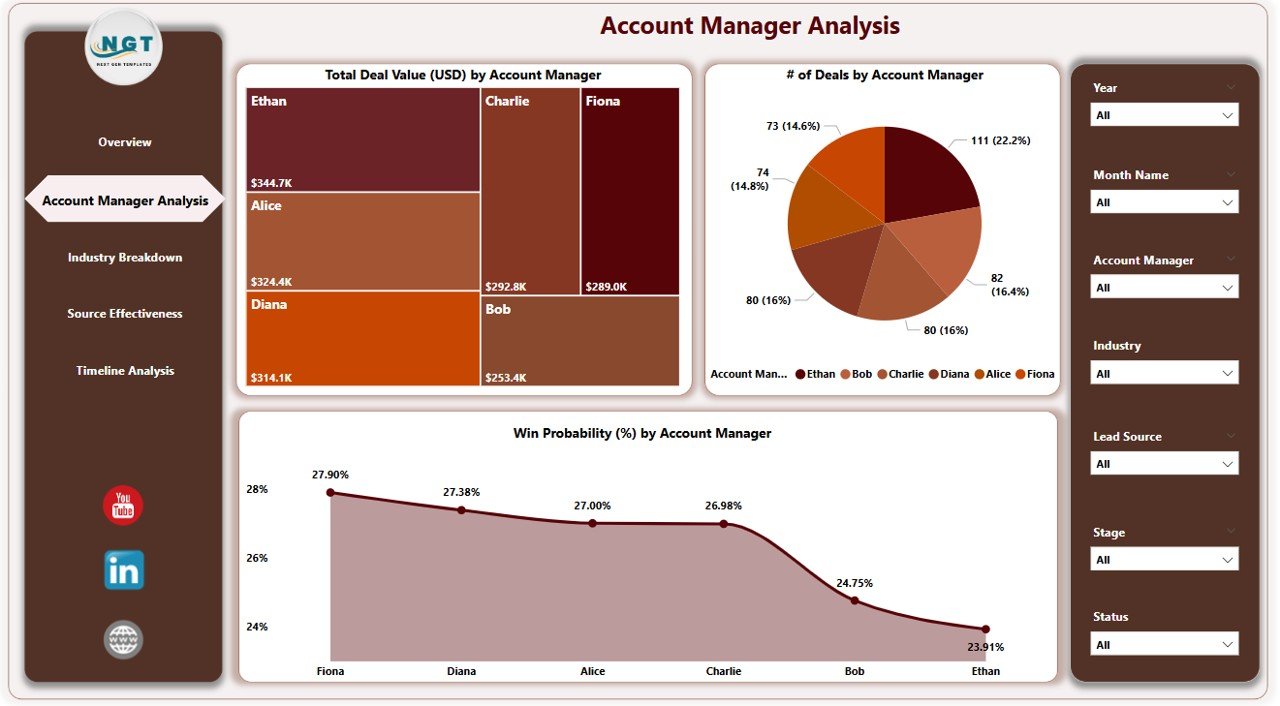
The Account Manager Analysis Page focuses on tracking the performance of individual account managers. It allows you to monitor how each manager is performing in terms of deal value, deal count, and win probability. Key features include:
-
7 slicers to customize the analysis.
3 charts:
- Total Deal Value (USD) by Account Manager.
- Number of Deals by Account Manager.
- Win Proclivity (%) by Account Manager.
This page helps business leaders and managers track the effectiveness of their teams and adjust strategies accordingly.
Industry Breakdown Page
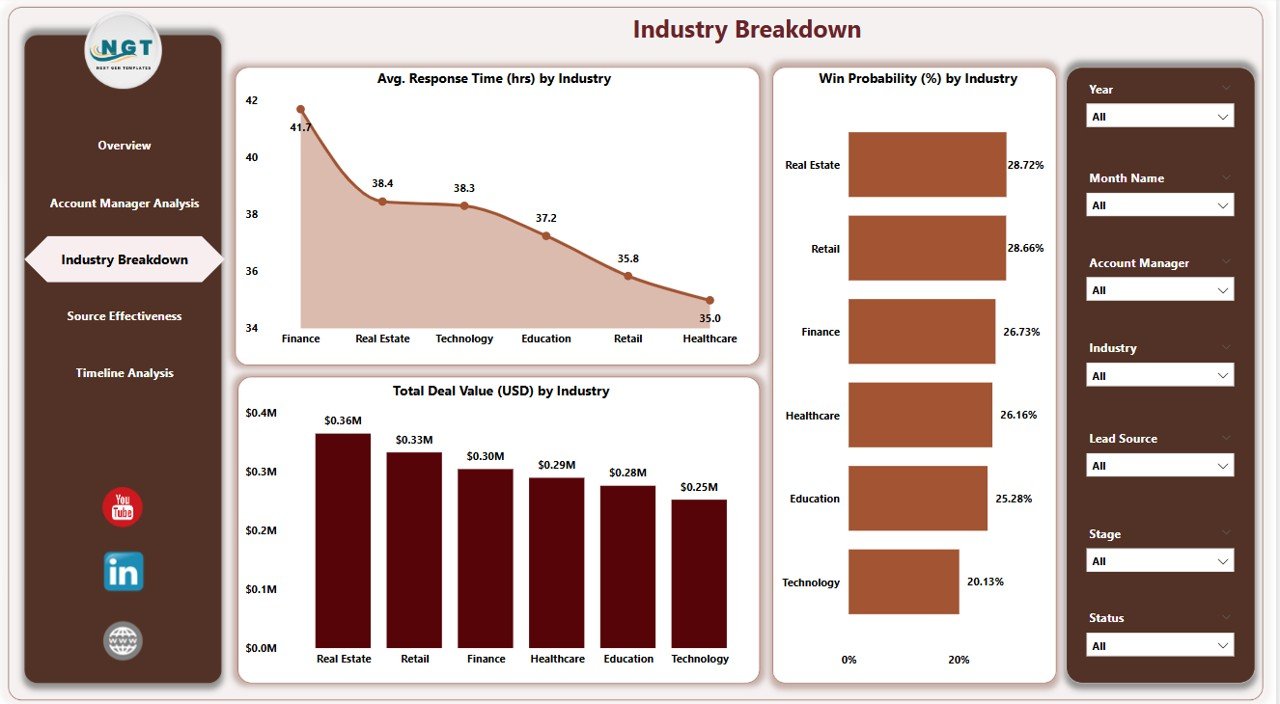
The Industry Breakdown Page provides insights into how different industries are performing in terms of response time, deal value, and win probability. It is designed to help you understand which sectors are most profitable. Key features include:
-
7 slicers to filter the data.
3 charts:
- Average Response Time (hrs) by Industry.
- Win Probability (%) by Industry.
- Total Deal Value (USD) by Industry.
By using this page, businesses can better tailor their CRM strategies based on industry-specific data.
Click to Purchases Customer Relationship Management Dashboard in Power BI
Source Effectiveness Page
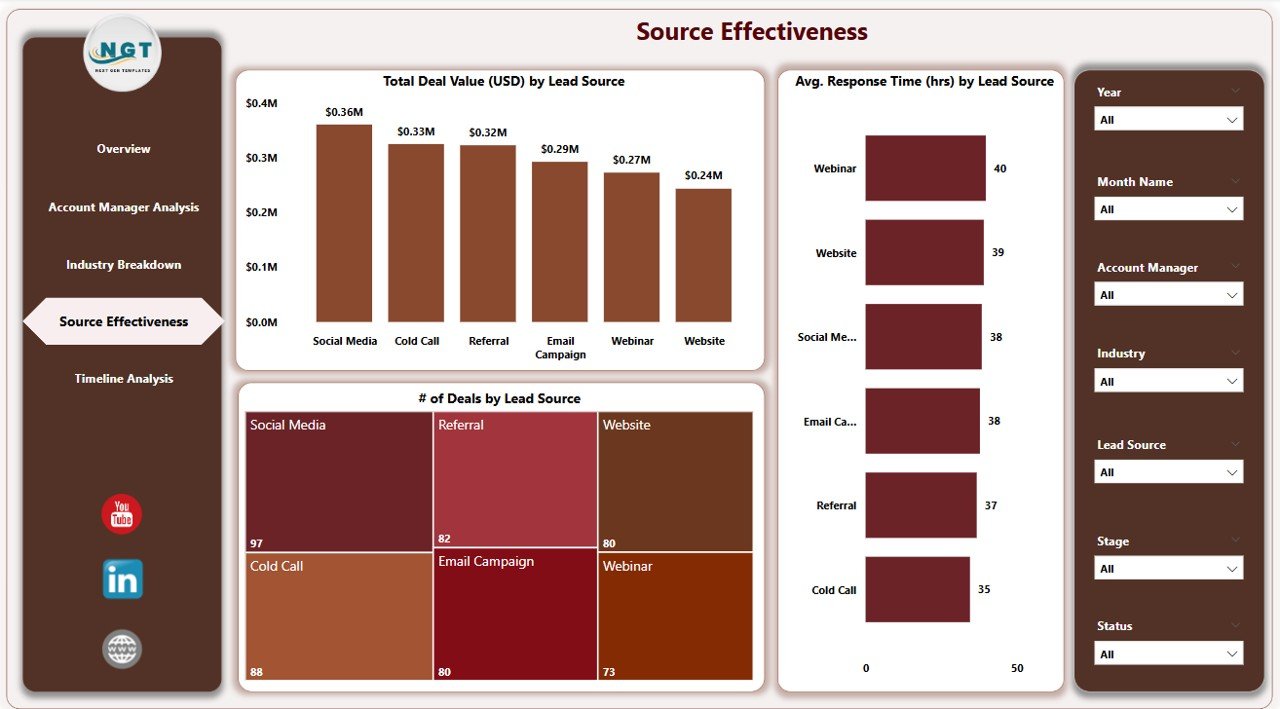
The Source Effectiveness Page is focused on evaluating the success of various lead sources. It provides valuable insights into which channels are driving the most value. Key features include:
-
7 slicers for customization.
3 charts:
- Total Deal Value (USD) by Lead Source.
- Average Response Time (hrs) by Lead Source.
- Number of Deals by Lead Source.
This page helps businesses understand where their leads are coming from and which sources are most effective in closing deals.
Timeline Analysis Page
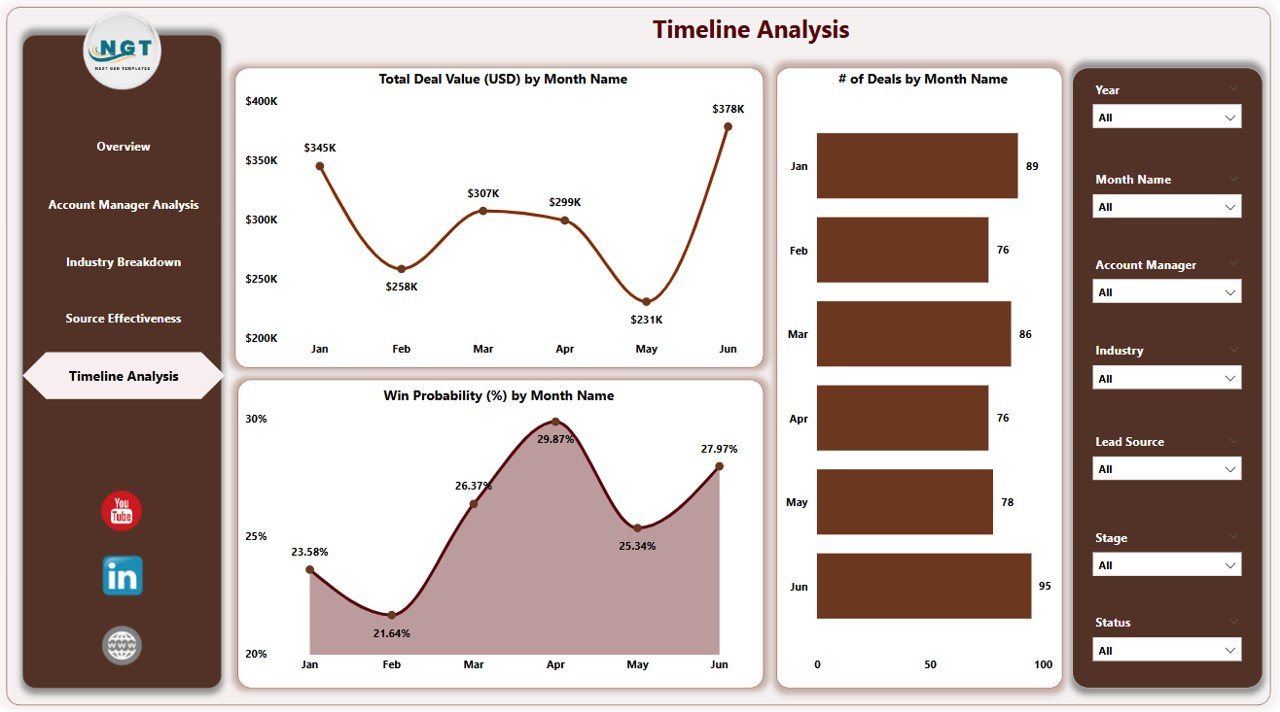
The Timeline Analysis Page helps track the performance of deals over time. It provides insights into monthly deal values, response times, and the number of deals. Key features include:
-
7 slicers for precise data filtering.
2 charts:
- Total Deal Value (USD) by Month Name.
- Average Response Time (hrs) by Month Name.
- Number of Deals by Month Name.
This page allows businesses to track seasonal trends and make data-driven decisions for future CRM strategies.
Advantages of Using a CRM Dashboard in Power BI
1. Streamlined Data Analysis
Power BI provides a centralized platform for analyzing CRM data, helping businesses save time by eliminating the need to manually process multiple datasets. The integration with Excel makes it seamless to import and visualize data.
2. Real-Time Insights
The CRM Dashboard in Power BI updates in real time, providing the most up-to-date insights. This feature helps businesses make immediate adjustments to their strategies, ensuring they are always in tune with current market dynamics.
3. Easy to Use
Power BI’s user-friendly interface allows anyone, even non-technical users, to create and interact with dashboards. With drag-and-drop features, creating CRM reports and insights becomes easy and quick.
4. Scalability
Whether you’re tracking a small number of customer deals or hundreds, Power BI can scale to accommodate your business’s growth. The CRM Dashboard can handle large datasets without performance issues.
5. Customization and Flexibility
Power BI offers a high level of customization. Users can adjust filters, charts, and views according to their specific needs. Whether you need detailed analysis by account manager or overall deal insights, Power BI allows for complete flexibility.
Click to Purchases Customer Relationship Management Dashboard in Power BI
Best Practices for Using a CRM Dashboard in Power BI
To get the most out of your Customer Relationship Management Dashboard in Power BI, here are some best practices:
1. Regularly Update Your Data Sources
Ensure your data sources are regularly updated to reflect the latest customer interactions, deal status, and lead information. This will help keep your dashboard relevant and accurate.
2. Use Filters to Focus on Key Metrics
While the dashboard offers a wealth of data, using filters (slicers) allows you to focus on the metrics that matter most to your business at any given time.
3. Set Performance Benchmarks
Use the data from the CRM Dashboard to set performance benchmarks for your team. Compare current data to historical performance and adjust strategies to meet goals.
4. Involve Your Team
Incorporate the CRM dashboard into regular team meetings. Discuss the data, identify areas for improvement, and collaborate on strategies to optimize customer relationships and sales processes.
5. Leverage Advanced Visualizations
Take advantage of Power BI’s advanced visualizations, such as line charts, pie charts, and bar graphs, to represent your data in a clear and impactful way.
Frequently Asked Questions (FAQ)
1. How Can a CRM Dashboard in Power BI Help My Business?
A CRM Dashboard in Power BI provides clear, actionable insights into customer interactions, deal progression, and lead effectiveness. By tracking performance across multiple dimensions (e.g., account managers, industries, lead sources), it helps businesses improve decision-making and sales strategies.
2. Do I Need Technical Skills to Use a CRM Dashboard in Power BI?
No, Power BI is designed to be user-friendly. While some basic understanding of data analysis can help, the dashboard’s drag-and-drop interface makes it accessible to users without technical expertise.
3. How Do I Integrate My Data into Power BI?
You can easily integrate data into Power BI from Excel files, cloud services, and other databases. Simply import your CRM data, and Power BI will handle the visualization and analysis.
4. Can I Customize the CRM Dashboard in Power BI?
Yes, Power BI allows extensive customization. You can adjust slicers, filters, and visualizations to fit your business needs, ensuring that the dashboard reflects the specific data and metrics that matter most to you.
Conclusion
The Customer Relationship Management Dashboard in Power BI is an invaluable tool for businesses looking to optimize their customer relationships and sales processes. It provides clear, real-time insights into key metrics, helping you make data-driven decisions that improve overall performance. By leveraging Power BI’s powerful features and customizable options, you can turn your CRM data into actionable insights that drive growth.
Visit our YouTube channel to learn step-by-step video tutorials
Click to Purchases Customer Relationship Management Dashboard in Power BI