Managing office travel and expenses efficiently can be a challenge, especially when dealing with large teams or frequent business trips. However, with the right tools, you can streamline the process, track spending, and identify areas for improvement. One such powerful tool is the Office Travel and Expense Dashboard in Excel.
In this article, we will walk you through the key features of this dashboard template, explaining how it can help your business monitor travel costs, analyze trends, and optimize budgeting. Let’s dive in!
Click to Purchases Office Travel and Expense Dashboard in Excel
What is the Office Travel and Expense Dashboard in Excel?
The Office Travel and Expense Dashboard is a ready-to-use Excel template that helps organizations manage and track their travel-related expenses in one centralized location. With intuitive charts and data visualizations, the dashboard provides insights into spending patterns, department-wise travel costs, and monthly trends, enabling businesses to optimize their travel budgets.
This tool is designed for ease of use, with features that cater to both small teams and larger organizations. Whether you’re looking to understand the cost of business trips or analyze department-specific travel trends, this dashboard has you covered.
Key Features of the Office Travel and Expense Dashboard
The Office Travel and Expense Dashboard includes several key features that make it an invaluable resource for tracking and managing travel expenses:
Page Navigator
The Page Navigator is located on the left side of the dashboard. This feature allows for seamless navigation across the five analytical pages of the dashboard. It ensures that users can quickly switch between the various sections without getting lost, saving time and effort.
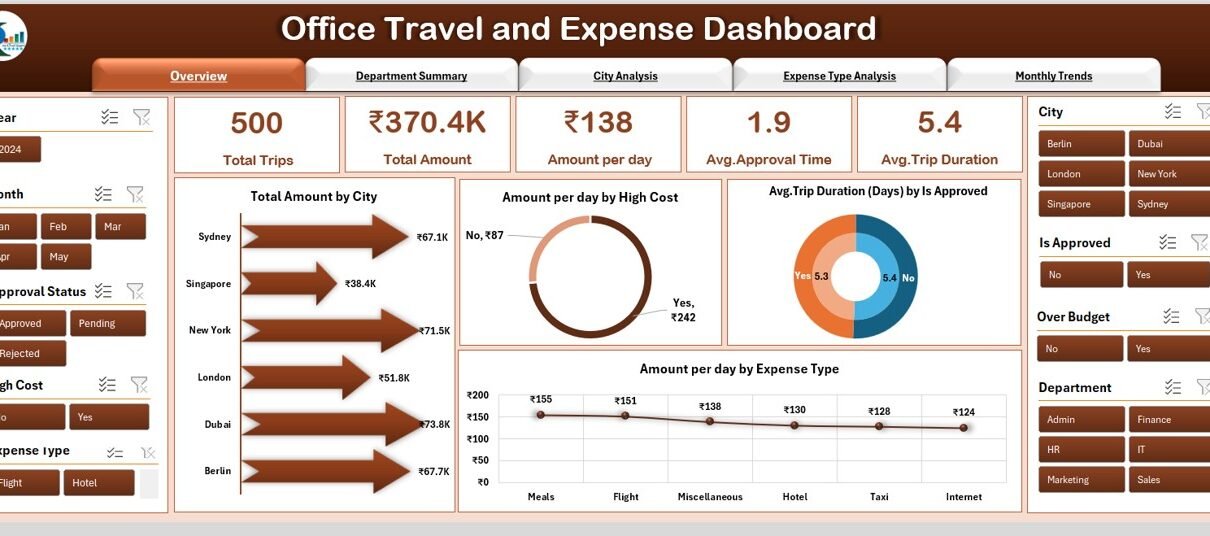
Overview Page
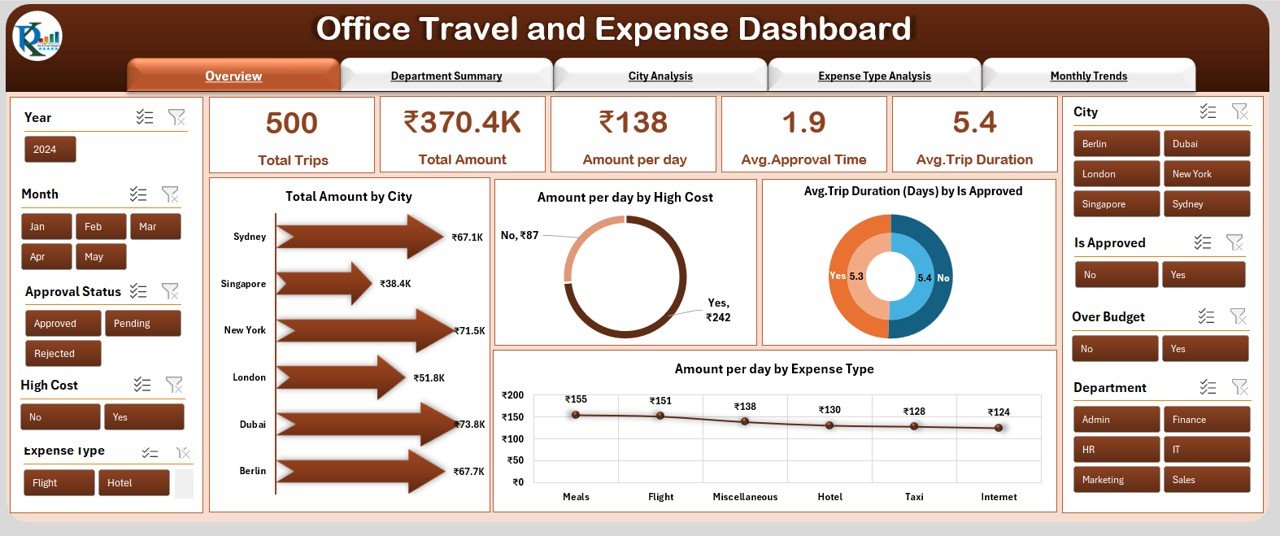
The Overview Page serves as the main hub of the dashboard, offering a comprehensive snapshot of your office’s travel and expense data. Key features of the Overview Page include:
-
5 Cards that give a quick look at the most important metrics.
-
Total Amount by City chart: This chart provides a breakdown of expenses by city, helping you see where the bulk of your travel spending occurs.
-
Amount per Day by High Cost chart: Visualizes how much your business spends per day in high-cost areas.
-
Avg. Trip Duration (Days) by Is Approved chart: Provides an overview of the average duration of trips based on approval status.
-
Amount per Day by Expense Type chart: This chart breaks down your daily expenses by category, making it easy to identify major cost drivers.
Department Summary
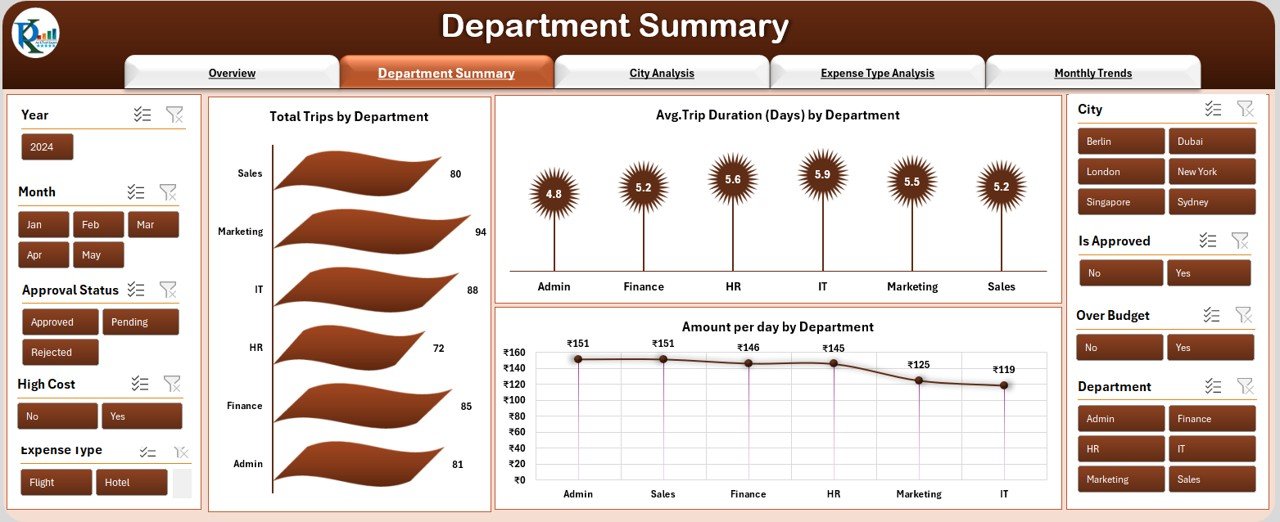
The Department Summary page allows you to analyze travel costs and trips at the department level. This page includes:
-
Total Trip by Department chart: Displays the number of trips each department takes.
-
Avg. Trip Duration (Days) by Department chart: Tracks how long the trips are, based on departmental data.
-
Amount Per Day by Department chart: Shows the daily expenses for each department, helping to monitor cost efficiency.
City Analysis
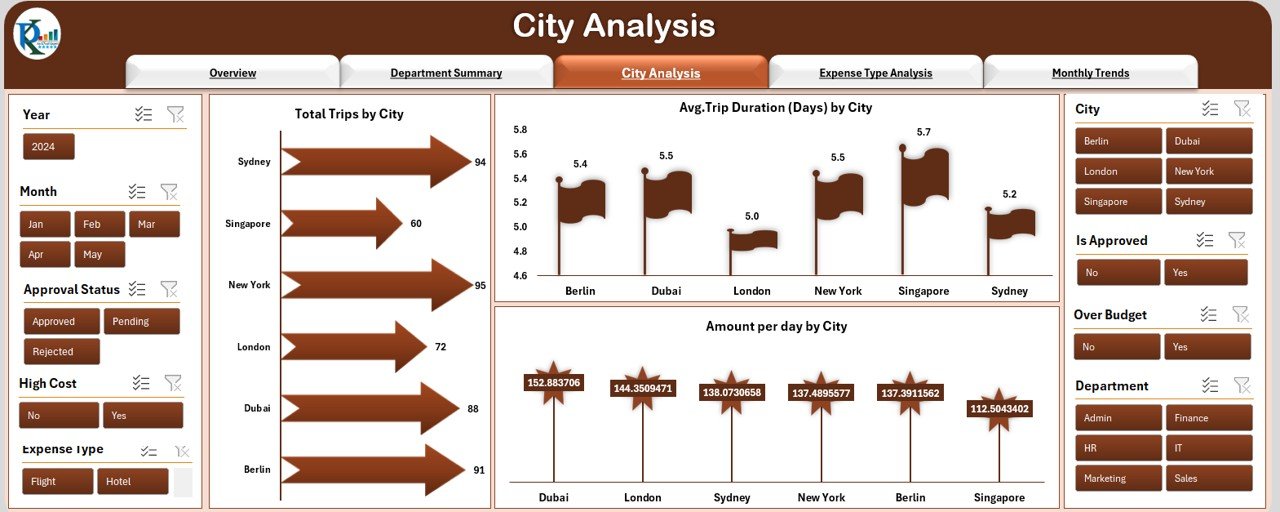
On the City Analysis page, you can explore travel data specific to different cities. It includes:
-
Total Trip by City chart: Displays the total number of trips taken to each city.
-
Avg. Trip Duration (Days) by City chart: Shows the average duration of trips to each city.
-
Amount Per Day by City chart: Breaks down travel expenses on a per-day basis by city.
Click to Purchases Office Travel and Expense Dashboard in Excel
Expense Type Analysis
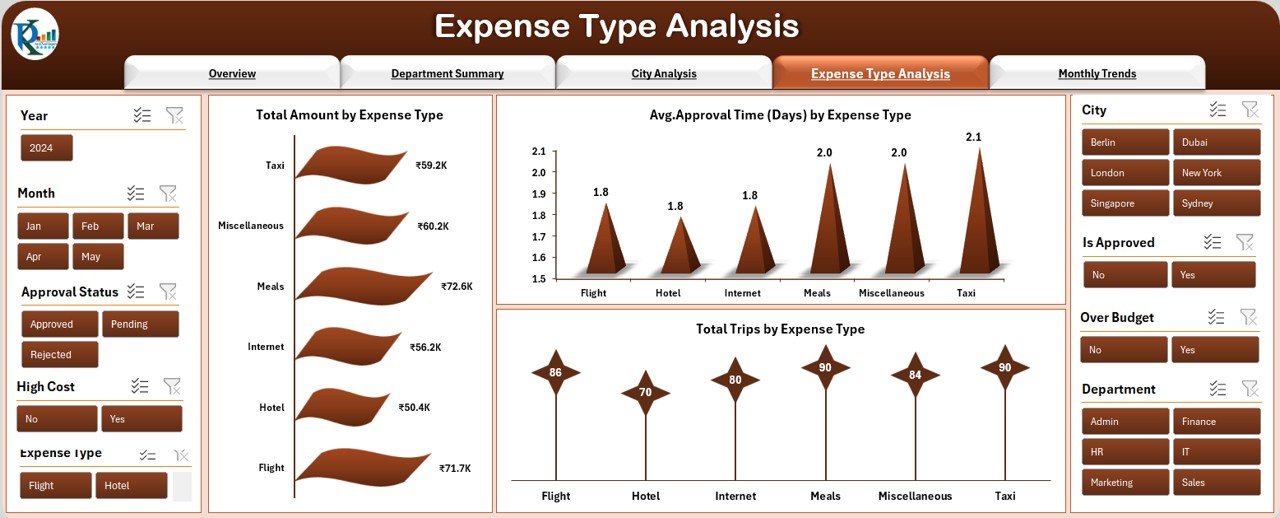
The Expense Type Analysis page focuses on breaking down costs by expense category. The charts available here include:
-
Total Amount by Expense Type chart: Provides a clear view of how much is spent on each type of expense (e.g., airfare, lodging, meals).
-
Avg. Approval Time (Days) by Expense Type chart: Tracks how long it takes for expenses to be approved across different types.
-
Total Trips by Expense Type chart: Shows how many trips are associated with each type of expense.
Monthly Trends
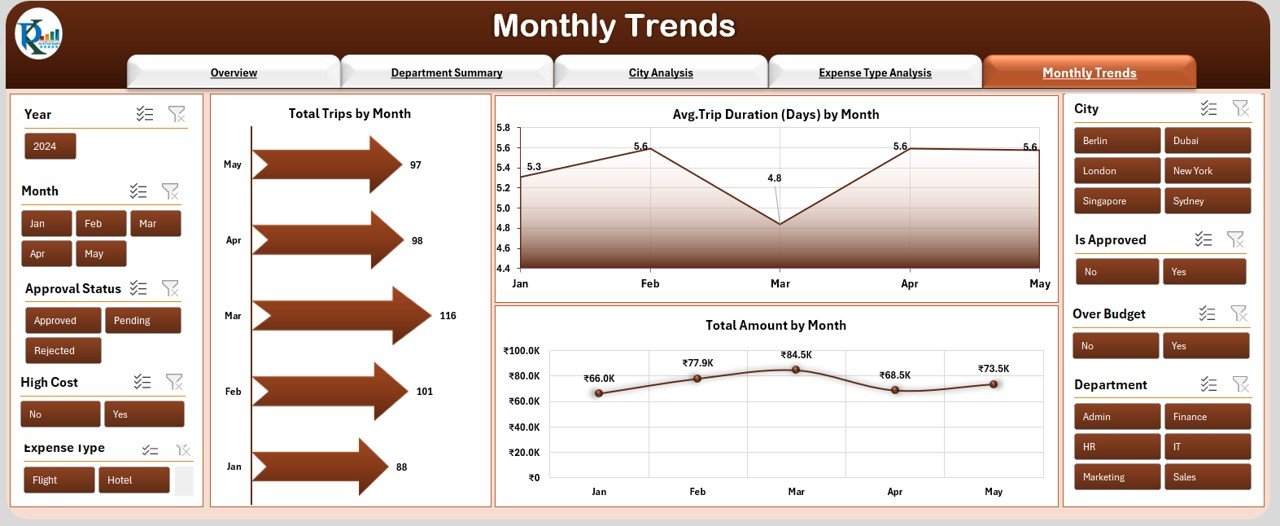
The Monthly Trends page allows you to track travel data on a monthly basis. This page includes:
-
Total Trips by Month chart: This chart tracks the number of trips taken each month.
-
Avg. Trip Duration (Days) by Month chart: Shows the average trip duration on a monthly basis.
-
Total Amount by Month chart: Provides a summary of total spending each month.
Data Sheet
The Data Sheet stores all the raw data that feeds into the charts and reports on the dashboard. This is where you enter all the information regarding trips, expenses, dates, and approvals.
Support Sheet
The Support Sheet is designed to assist in managing data entry and troubleshooting. It can provide additional context or instructions for using the dashboard and keeping it up to date.
Advantages of Using the Office Travel and Expense Dashboard
Click to Purchases Office Travel and Expense Dashboard in Excel
Using the Office Travel and Expense Dashboard offers several advantages that can greatly improve how your organization handles travel management:
1. Simplified Expense Tracking
One of the most significant advantages of this dashboard is its ability to centralize and simplify expense tracking. With all data organized into clear charts and tables, you can easily monitor costs, identify trends, and stay within budget.
2. Improved Budgeting and Cost Management
By analyzing data from the dashboard, businesses can identify areas where they are overspending on travel and take corrective actions. This can lead to better budget allocation and more cost-efficient travel planning.
3. Easy-to-Use Interface
The intuitive design of the dashboard ensures that even those with limited Excel experience can navigate and use the system effectively. The Page Navigator and clear chart layouts make it simple to access and interpret the data.
4. Informed Decision-Making
The visual representation of travel and expense data empowers managers to make informed decisions. By understanding where costs are high, businesses can adjust policies or negotiate better deals with vendors.
5. Real-Time Data
The dashboard is updated in real-time, ensuring that the most current data is always available. This is particularly beneficial for businesses that need to react quickly to changes in travel patterns or spending.
Best Practices for Using the Office Travel and Expense Dashboard
To get the most out of the Office Travel and Expense Dashboard, follow these best practices:
1. Regular Data Entry
Ensure that data is regularly updated in the Data Sheet to maintain the accuracy of your analysis. Set up a process to capture expenses as soon as they occur to avoid missing important details.
2. Set Clear Travel Policies
With the insights provided by the dashboard, set clear travel policies for your employees. These policies can help control costs and ensure that spending is in line with the company’s budget.
3. Track Trends Over Time
Use the Monthly Trends page to identify spending patterns over time. This will help you plan more effectively for future travel expenses and adjust your budget as needed.
4. Monitor Approval Time
Track the approval time for expenses and work to streamline the approval process. The Avg. Approval Time charts can provide valuable insights into how quickly expenses are being processed, which can help improve efficiency.
5. Customize for Your Business
Customize the dashboard to meet your business’s unique needs. Modify expense categories, departments, or cities to reflect your organization’s structure and travel requirements.
Conclusion
The Office Travel and Expense Dashboard in Excel is a powerful tool that simplifies the process of managing travel expenses. By offering clear visualizations, comprehensive data analysis, and actionable insights, this dashboard helps businesses track spending, optimize budgets, and make informed decisions. Whether you’re a small business or a large enterprise, this tool can provide the necessary insights to keep travel costs under control.
Frequently Asked Questions
What is an Office Travel and Expense Dashboard?
An Office Travel and Expense Dashboard is a tool designed to track and analyze travel-related expenses in an organization. It provides insights into travel spending by department, city, expense type, and month.
How do I use the dashboard?
Simply enter your travel and expense data into the Data Sheet, and the dashboard will automatically update with charts and reports reflecting the most current information.
Can I customize the dashboard for my business?
Yes, the dashboard can be customized to fit the unique needs of your business. You can adjust expense categories, department labels, and other elements to match your organizational structure.
Is the dashboard easy to use?
Yes, the dashboard is designed to be user-friendly, with clear navigation and intuitive charts. Even users with limited Excel knowledge can easily navigate the dashboard.
How often should I update the dashboard?
It’s best to update the dashboard regularly—ideally, after each trip or expense submission. This ensures that your data is current and reflects the latest information for accurate analysis.
Visit our YouTube channel to learn step-by-step video tutorials
Click to Purchases Office Travel and Expense Dashboard in Excel
Watch the step-by-step video tutorial: