In today’s fast-paced corporate world, office maintenance plays a crucial role in ensuring that workplace environments are safe, efficient, and well-organized. But how can businesses effectively track and manage all these maintenance requests? The answer lies in leveraging modern tools such as Power BI, one of the leading data visualization and business intelligence platforms. In this article, we will explore the key features and advantages of using an Office Maintenance Dashboard in Power BI, how it can streamline office operations, and best practices to maximize its effectiveness.
What is an Office Maintenance Dashboard in Power BI?
Click to Purchases Office Maintenance Dashboard in Power BI
An Office Maintenance Dashboard in Power BI is a comprehensive, visually rich dashboard designed to track and analyze office maintenance tasks. It helps businesses manage office requests, categorize them based on urgency, location, priority, and more, all within an interactive interface. This tool consolidates various data points and presents them in easy-to-understand visualizations, offering insights that drive timely decision-making and effective maintenance management.
Power BI brings powerful reporting capabilities, enabling users to visualize trends, track office maintenance requests, and optimize workflows. Whether you are tracking issues related to HVAC systems, office furniture repairs, or general housekeeping, this dashboard makes it all manageable and accessible.
Key Features of the Office Maintenance Dashboard in Power BI
The Office Maintenance Dashboard is a ready-to-use Power BI template with five essential pages, each catering to a different aspect of office maintenance tracking. Here’s a breakdown of each page and its features:
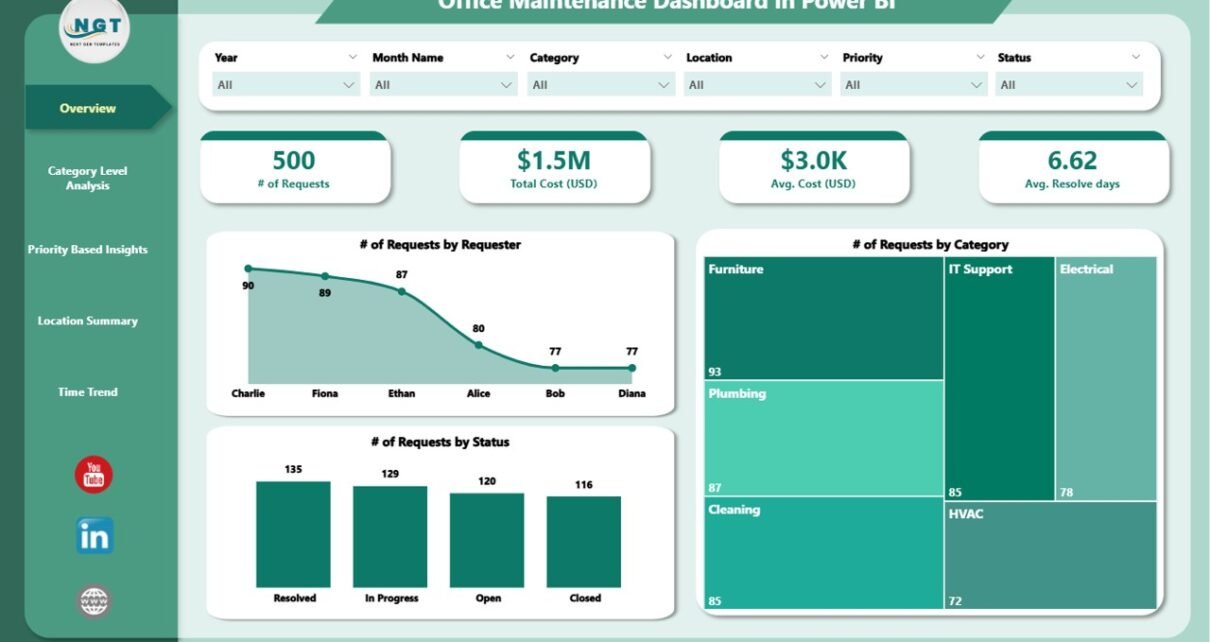
Overview Page
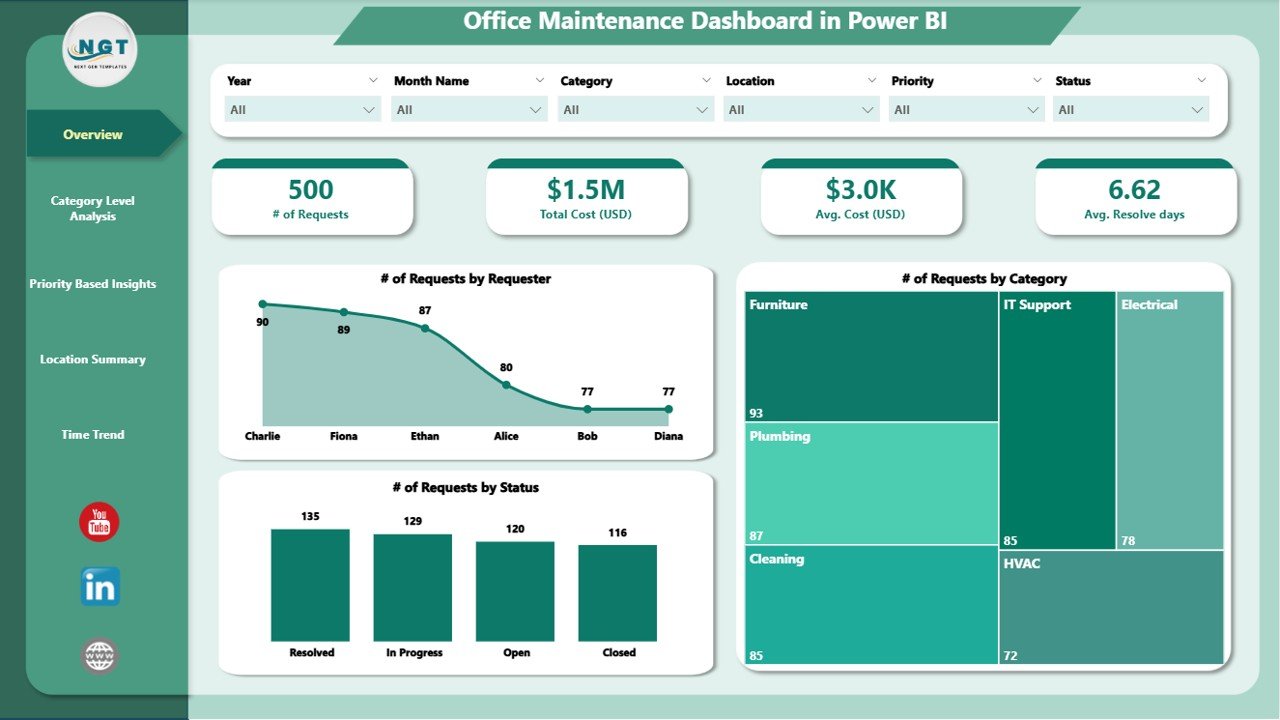
The Overview Page is the main page of the dashboard, providing a snapshot of all office maintenance data. This page features six silencers that filter information based on specific criteria. Additionally, there are five cards showing key metrics:
-
# of Requests by Requestor
-
# of Requests by Category
-
# of Requests by Status
This page gives users an at-a-glance understanding of the volume and status of office maintenance requests, making it easier to spot trends and patterns.
Category Level Analysis
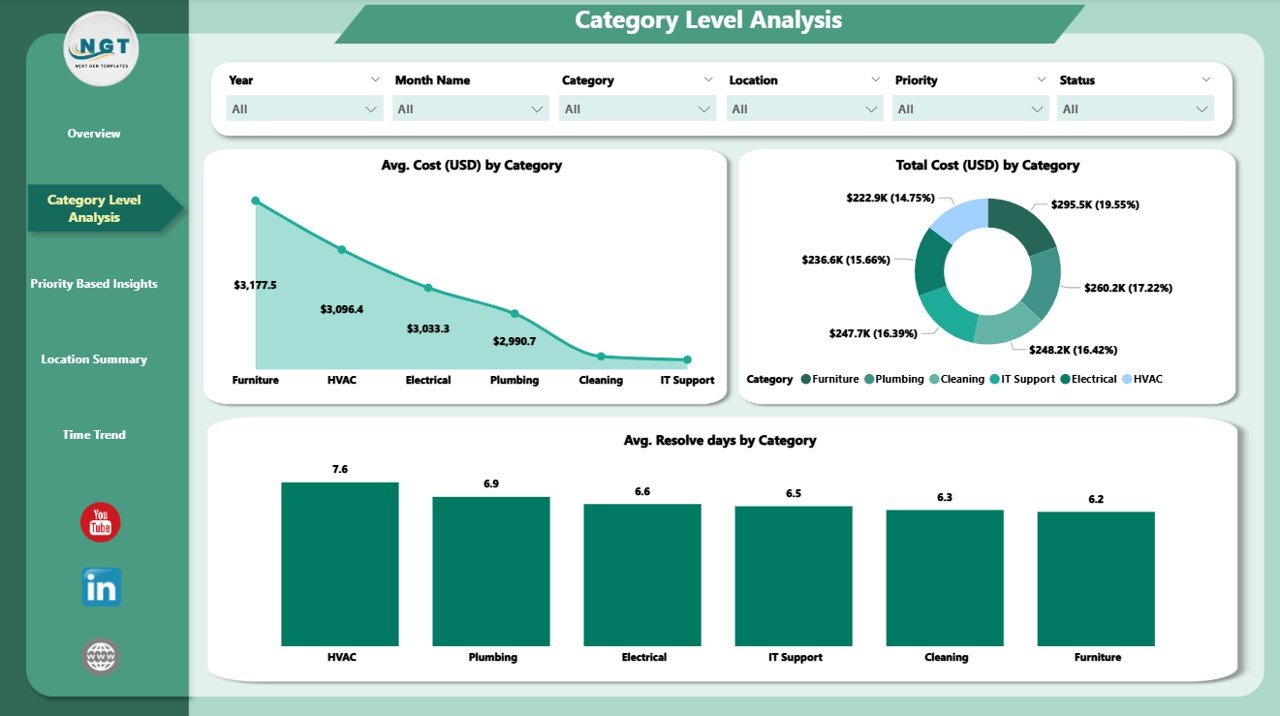
The Category Level Analysis page dives deeper into the categorization of maintenance requests. It features:
-
Avg. Cost (USD) by Category
-
Total Cost (USD) by Category
-
Avg. Resolve Days by Category
This page allows businesses to track how much money is being spent in each category and how long it takes to resolve issues. By understanding these insights, companies can optimize their maintenance operations and make informed budget decisions.
Priority Based Insights
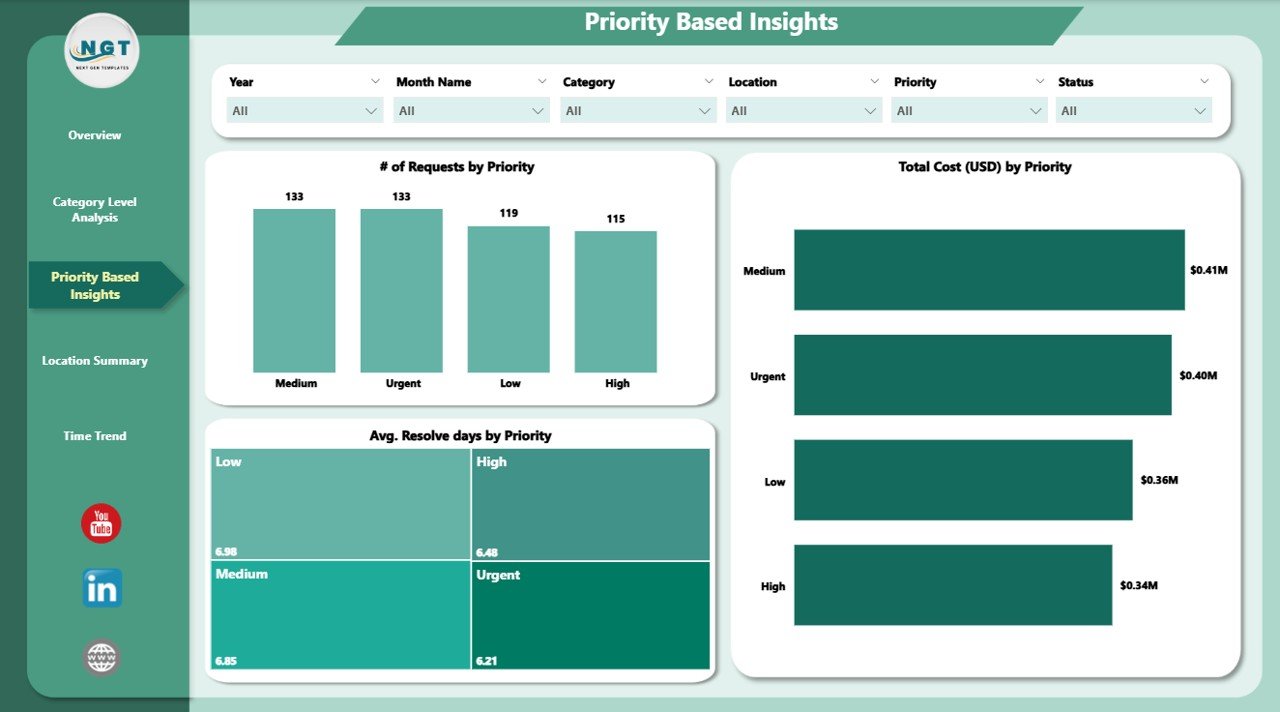
The Priority Based Insights page provides a closer look at how maintenance requests are prioritized. It features:
-
# of Requests by Priority
-
Total Cost (USD) by Priority
-
Avg. Resolve Days by Priority
This page helps identify if high-priority tasks are being resolved within the expected timeframe and whether resources are allocated effectively to urgent tasks. It aids in prioritizing maintenance issues that have a significant impact on the office environment.
Location Summary
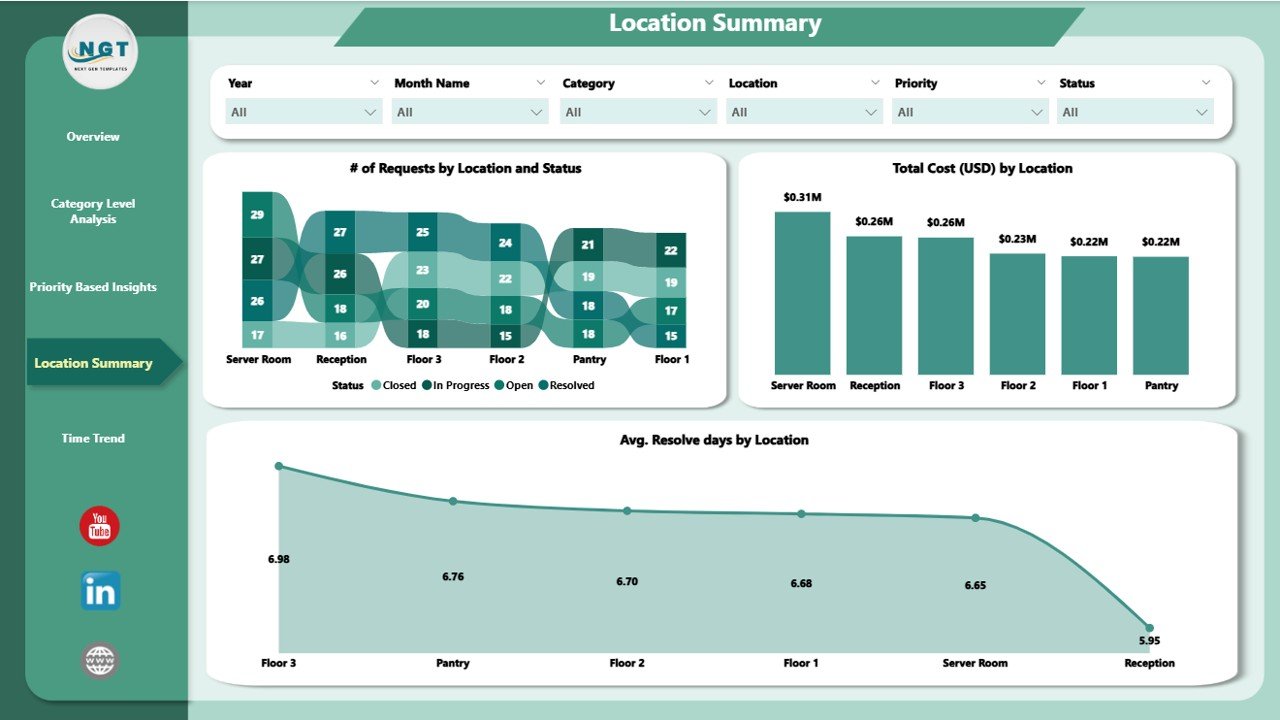
The Location Summary page is designed to track maintenance requests across different office locations. The features include:
-
# of Requests by Location and Status
-
Total Cost (USD) by Location
-
Avg. Resolve Days by Location
This page is especially helpful for companies with multiple office locations, as it enables managers to track how maintenance requests vary from one location to another. It helps determine whether certain locations require more resources or quicker response times.
Time Trend Tracking
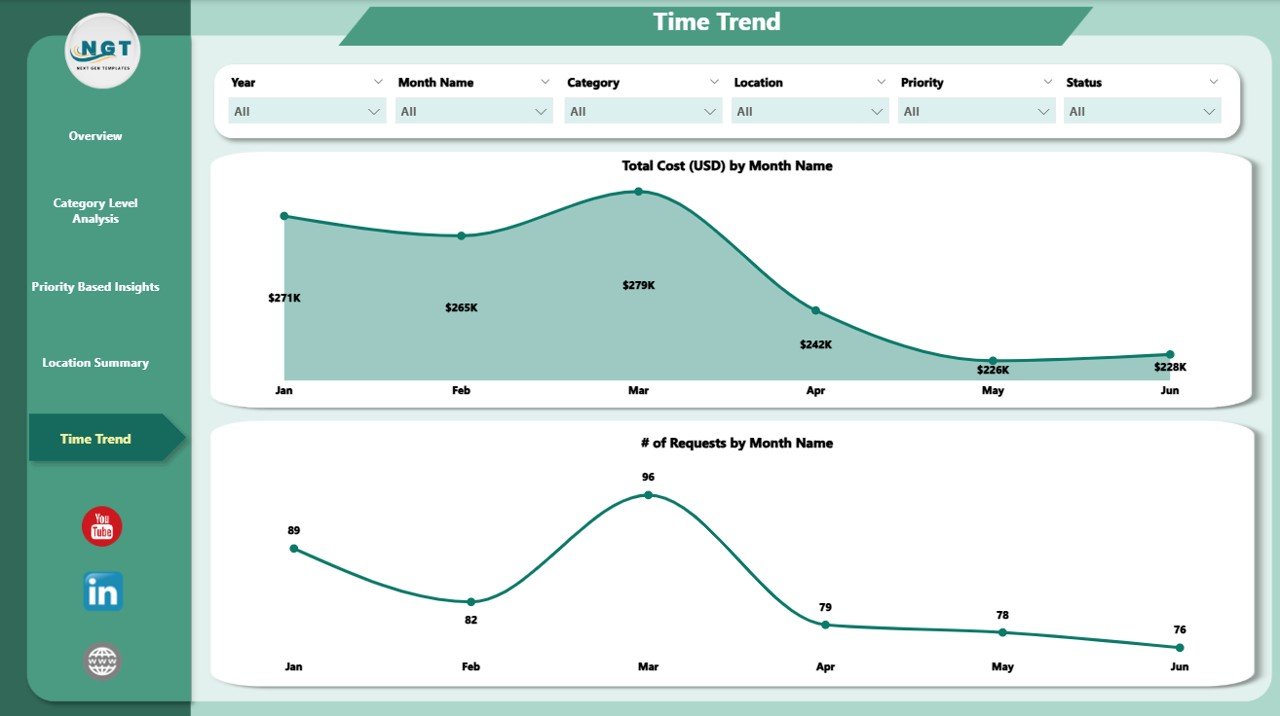
The Time Trend page tracks how office maintenance requests and costs evolve over time. It includes:
-
# of Requests by Month
-
Total Cost (USD) by Month
This page is vital for identifying trends in office maintenance over the course of a year, helping businesses prepare for busy maintenance periods and allocate resources accordingly.
Advantages of Using an Office Maintenance Dashboard in Power BI
Click to Purchases Office Maintenance Dashboard in Power BI
A Power BI-based Office Maintenance Dashboard offers numerous benefits that can help businesses streamline their operations. Here are some of the key advantages:
1. Real-Time Insights
Power BI allows for real-time data updates, meaning that office maintenance managers can get instant access to the latest information. This ensures that any maintenance issues are addressed promptly, preventing them from turning into bigger problems.
2. Enhanced Decision-Making
With Power BI’s powerful visualizations, businesses can make better decisions based on clear, actionable data. By analyzing trends, costs, and response times, companies can allocate resources efficiently and reduce overall maintenance costs.
3. Centralized Data
Power BI integrates data from multiple sources, consolidating it in one place. This reduces the need for manual data entry and ensures that maintenance data is consistent and up-to-date.
4. Improved Communication
Using a centralized dashboard improves communication between departments. Facilities management teams can access up-to-date maintenance request data, ensuring that all employees are on the same page.
5. Predictive Analytics
By analyzing historical data, Power BI can help forecast future maintenance needs. This allows businesses to prepare in advance for peak maintenance periods, ensuring that resources are allocated effectively.
Best Practices for Using the Office Maintenance Dashboard in Power BI
To get the most out of your Office Maintenance Dashboard in Power BI, it’s important to follow a few best practices. Here’s a guide to help you maximize its effectiveness:
1. Regularly Update Data Sources
Make sure that the data feeding into your Power BI dashboard is consistently updated. This ensures that your dashboard reflects the most current maintenance requests and actions.
2. Set Up Automated Alerts
Power BI allows you to set up alerts based on specific conditions. For example, you can set up an alert if the average resolve time exceeds a set threshold or if costs in a particular category exceed the budget. This will help you stay on top of issues in real-time.
3. Customize the Dashboard for Your Needs
Power BI is highly customizable. Tailor your dashboard to the specific needs of your business, whether it’s adjusting filters, adding custom visuals, or modifying KPIs.
4. Train Your Team
Ensure that your team knows how to navigate and interpret the Power BI dashboard. Conduct regular training sessions to help employees understand how to use the dashboard effectively and make data-driven decisions.
5. Monitor Performance Metrics
Keep an eye on key performance metrics like cost per category, average resolve days, and the number of requests by priority. By doing so, you’ll identify areas that need improvement and can adjust resources accordingly.
Frequently Asked Questions (FAQs)
What is an Office Maintenance Dashboard in Power BI?
An Office Maintenance Dashboard in Power BI is a tool used to track, analyze, and report on maintenance requests within an office environment. It provides visual insights into the status, cost, and resolution time of maintenance tasks, helping businesses optimize operations and resource allocation.
How can Power BI help in office maintenance?
Power BI helps office maintenance by offering real-time insights into the number of requests, costs, and resolution times. It enables businesses to identify trends, prioritize tasks, and allocate resources more effectively, reducing downtime and maintenance costs.
Can I customize the Office Maintenance Dashboard in Power BI?
Yes, Power BI is highly customizable. You can adjust filters, add new visualizations, and tailor the dashboard to fit your company’s specific needs. Customizing the dashboard ensures that you’re tracking the most relevant metrics for your business.
How often should I update my Office Maintenance Dashboard?
It’s best to update your dashboard regularly, ideally in real-time, to ensure that you have the most up-to-date information. You can automate data updates or manually refresh the data at regular intervals.
Is it difficult to use Power BI for Office Maintenance?
Power BI is user-friendly, and with some initial training, your team will be able to easily navigate and interpret the dashboard. You can also find many tutorials and resources online to help with setup and customization.
Conclusion
The Office Maintenance Dashboard in Power BI is an invaluable tool for businesses seeking to optimize their office maintenance operations. By offering real-time insights, centralizing data, and providing visual analytics, this dashboard enables companies to streamline their maintenance workflows, reduce costs, and improve decision-making. With its customizable features and user-friendly interface, Power BI ensures that businesses can manage their office maintenance requests effectively, helping them stay on top of critical tasks while improving overall efficiency.
Visit our YouTube channel to learn step-by-step video tutorials