In today’s world, cybersecurity and environmental sustainability are more connected than you might think. As organizations adopt green IT practices, they must also ensure that their cybersecurity measures align with sustainability goals. The Environmental and Sustainability Cybersecurity KPI Dashboard in Excel bridges this gap perfectly.
Whether you’re a compliance officer, sustainability manager, or IT leader, this dashboard provides a comprehensive solution to track cybersecurity performance through an environmental lens. And the best part? You can manage it all from a well-organized Excel file—no complex software required.
Click to Purchases Environmental and Sustainability Cybersecurity KPI Dashboard in Excel
What Is the Environmental and Sustainability Cybersecurity KPI Dashboard?
The Environmental and Sustainability Cybersecurity KPI Dashboard in Excel is a ready-to-use Excel-based tool designed to monitor and evaluate key cybersecurity performance indicators while supporting green IT initiatives.
This dashboard helps organizations:
-
Track both monthly (MTD) and year-to-date (YTD) cybersecurity KPIs
-
Analyze trends and performance gaps
-
Compare actual results with targets and previous year values
-
Align IT security goals with broader sustainability efforts
All of this is neatly packed in a user-friendly Excel workbook with automated visual insights and structured data input mechanisms.
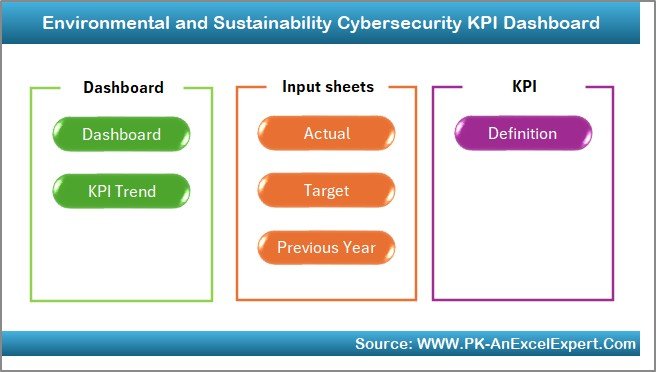
Key Features of the Dashboard
This KPI dashboard consists of seven interactive worksheets, each serving a unique purpose. Let’s walk through each one:
Home Sheet
This is the navigation hub of the dashboard. It contains six clickable buttons that let you jump to other sheets instantly. It makes exploring the dashboard smooth and organized.
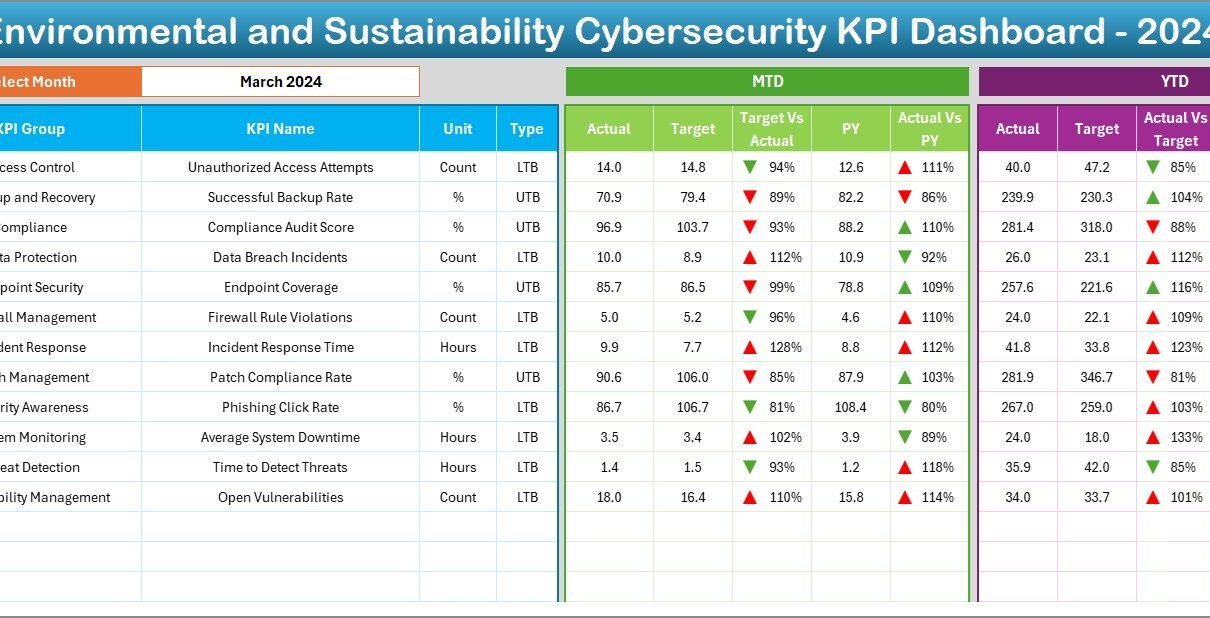
Dashboard Sheet
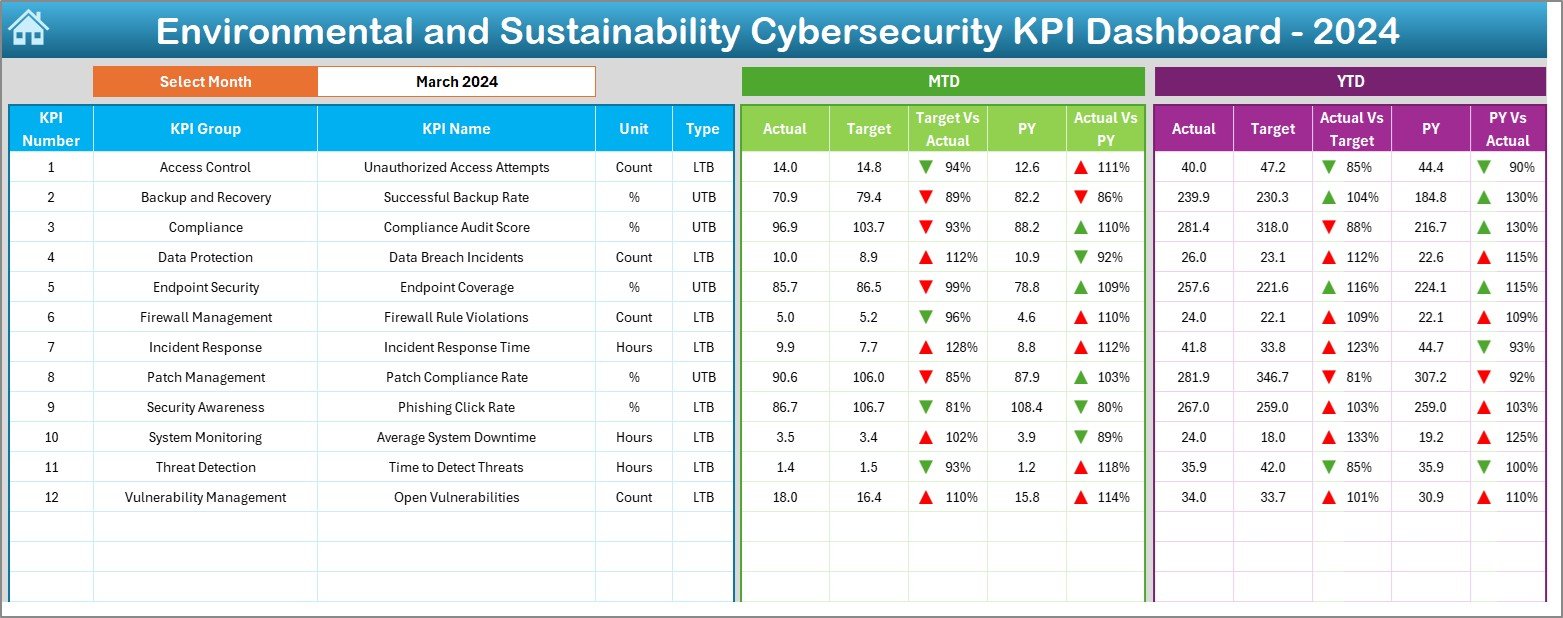
The main visualization area of the dashboard. Here’s what it offers:
-
Dropdown (Cell D3): Choose a month, and the dashboard updates dynamically.
KPI Metrics Displayed:
- MTD Actual, Target, and Previous Year
- Target vs. Actual and PY vs. Actual
- YTD Actual, Target, and Previous Year
- Trend indicators with up/down arrows using conditional formatting
This sheet gives a quick glance at cybersecurity performance while highlighting improvements or regressions.
KPI Trend Sheet
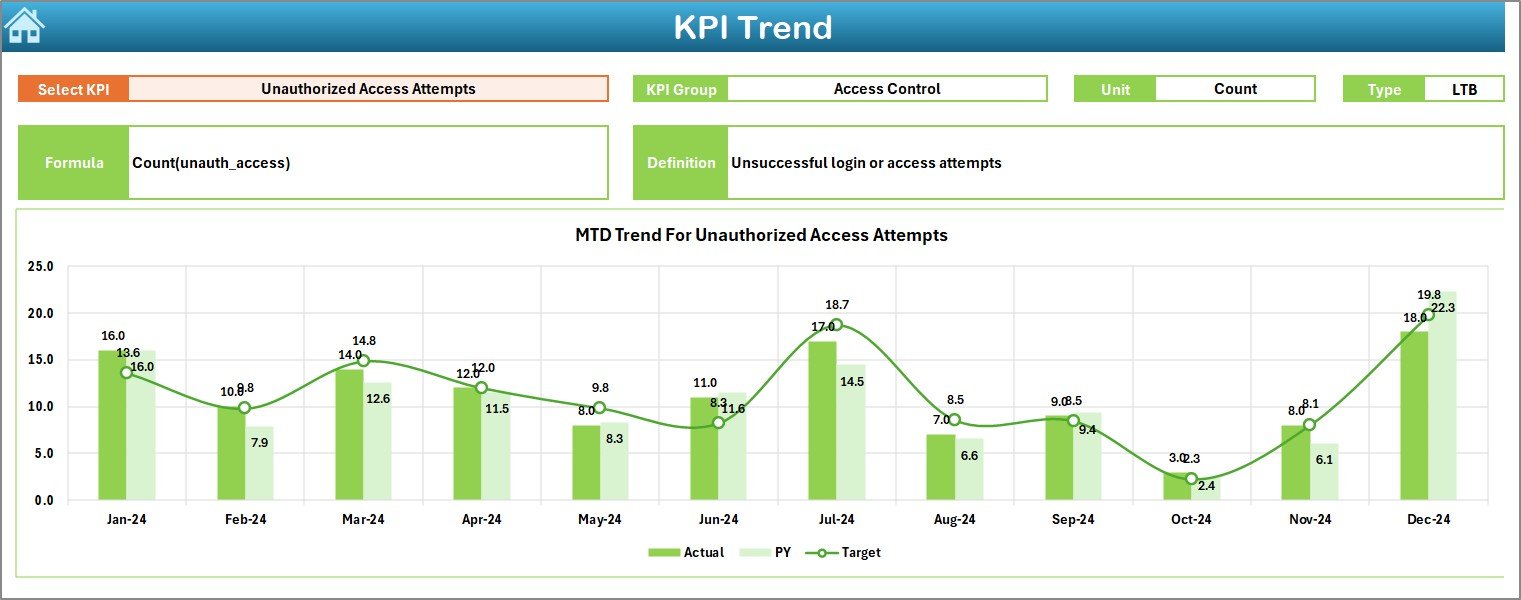
This sheet helps track trends over time.
Select KPI (Cell C3) to view:
- KPI Group
- Unit of Measurement
- Type (UTB or LTB)
- Formula
- Definition
-
MTD and YTD line charts show how Actuals, Targets, and PY values evolve
This is where data meets storytelling in a graphical way.
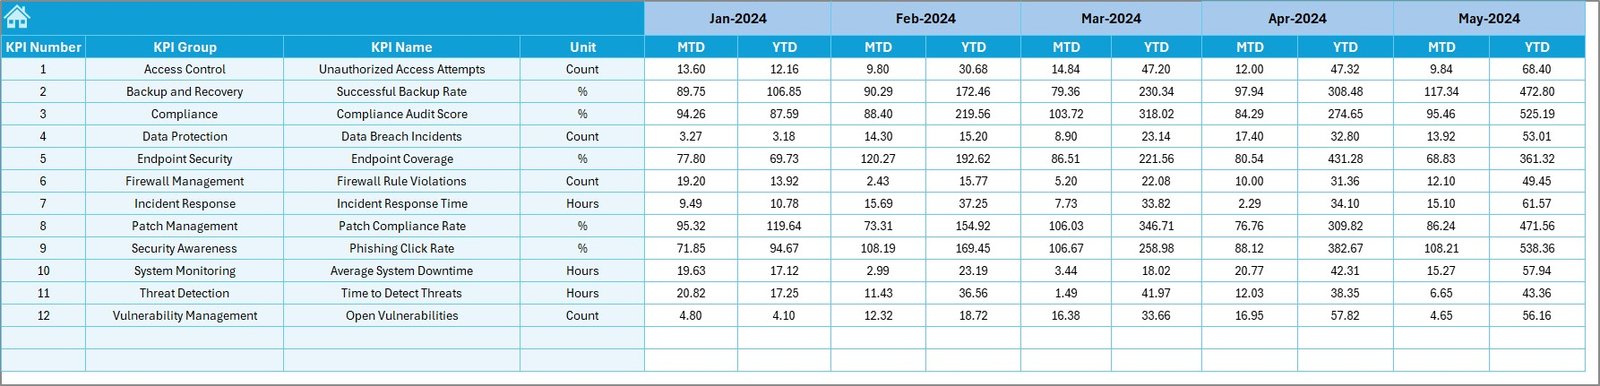
Actual Numbers Input Sheet
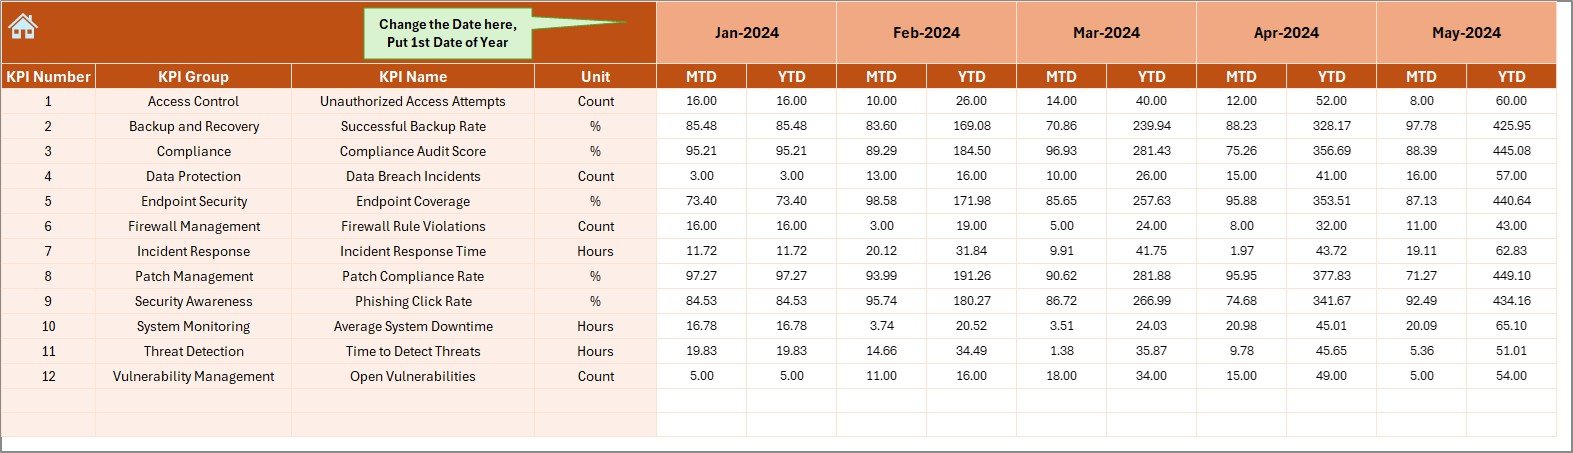
This is where users input actual KPI values for each month.
-
Define the starting month in cell E1
-
Input monthly MTD and YTD actuals
Target Sheet
Record the monthly goals for each KPI. It keeps both MTD and YTD targets aligned for easy comparison.
Previous Year Numbers Sheet
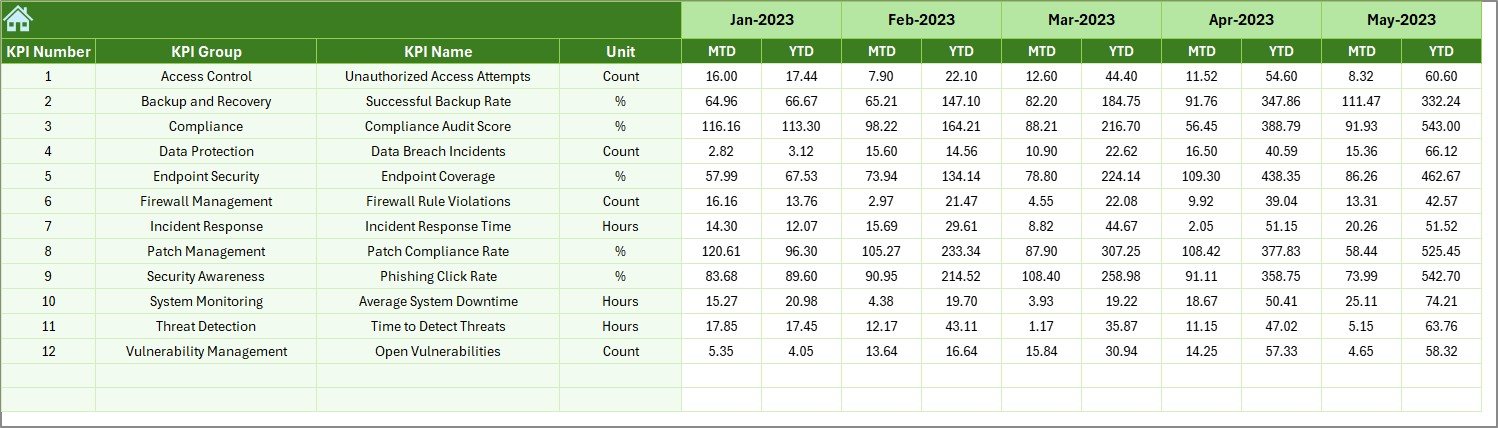
Enter historical data from the previous year for benchmarking purposes.
KPI Definition Sheet
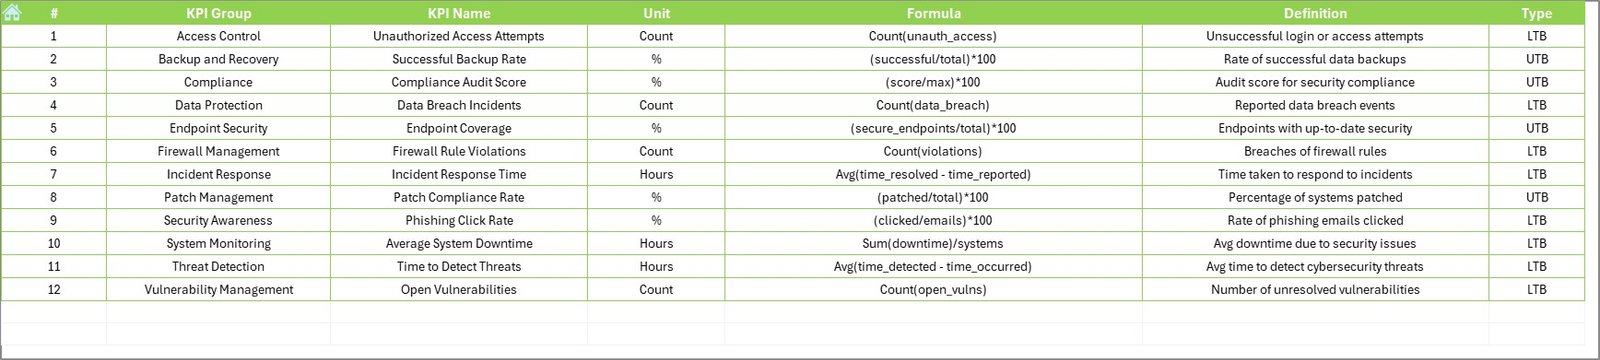
Provides a structured table to record:
-
KPI Name
-
KPI Group
-
Unit
-
Formula
-
Definition
-
Type (Upper/Lower the Better)
This becomes the reference backbone for all calculations and explanations.
Why Does Cybersecurity Need to Align with Environmental Goals?
As organizations shift to cloud computing, virtual infrastructure, and digital records, the environmental impact of IT systems becomes more significant. At the same time, cybersecurity threats grow in complexity.
Integrating environmental goals with cybersecurity practices helps organizations:
-
Reduce carbon footprint by adopting secure, energy-efficient systems
-
Minimize waste through paperless and secure documentation
-
Improve governance and risk management
-
Support ESG (Environmental, Social, Governance) compliance
The Excel dashboard provides a structured, measurable approach to achieving these goals.
Click to Purchases Environmental and Sustainability Cybersecurity KPI Dashboard in Excel
Advantages of Environmental and Sustainability Cybersecurity KPI Dashboard
Let’s explore why this tool is worth using:
✅ 1. User-Friendly Interface
-
Easy navigation with buttons
-
Excel-based—no coding or advanced software required
✅ 2. Real-Time Performance Monitoring
-
Choose a month, and all figures auto-update
-
See exactly how you’re tracking against targets
✅ 3. Visual Indicators
-
Conditional formatting arrows show trends
-
Makes data interpretation quick and intuitive
✅ 4. Customizable KPI Framework
-
Add or modify KPIs as per your organizational needs
-
Adjust formulas, units, or targets easily
✅ 5. Supports Data-Driven Decisions
-
Charts and comparisons help identify what’s working
-
Find issues before they become big problems
✅ 6. Enhances Compliance
-
Aligns cybersecurity metrics with environmental regulations
-
Useful for internal audits and ESG reporting
Best Practices for Using This Dashboard
To get the most out of this dashboard, follow these tips:
📌 1. Define Clear KPIs
Ensure that each KPI reflects a real objective. Examples include:
-
Energy-efficient firewall operations
-
Data center breach frequency
-
Green IT compliance audits
📌 2. Keep the Data Up to Date
Input actual values and targets regularly. This keeps your insights relevant.
📌 3. Set Realistic Targets
Base targets on industry benchmarks and your past performance.
📌 4. Use Visuals for Communication
Leverage the trend charts and arrows to tell a performance story during meetings.
📌 5. Review Monthly
Use the dropdown filter in the dashboard to analyze each month individually.
📌 6. Train Your Team
Make sure everyone knows how to use and update the dashboard.
How to Customize the Dashboard for Your Organization?
This dashboard is not rigid. You can tailor it as needed:
-
Add your logo to the Home sheet
-
Insert more KPI categories (e.g., “Green Server Utilization”)
-
Extend formulas to accommodate new data
-
Use Excel’s data validation and pivot tools for enhanced control
With a little Excel knowledge, you can turn this into a full-fledged performance tracking powerhouse.
How Can This Dashboard Help with ESG Reporting?
ESG (Environmental, Social, Governance) compliance is no longer optional. This dashboard supports ESG efforts by:
-
Documenting cybersecurity controls that reduce environmental risks
-
Providing transparent metrics for audit trails
-
Demonstrating accountability in digital infrastructure
-
Encouraging green IT behavior through performance tracking
You can easily export visuals and KPI tables from Excel into your ESG reports or sustainability presentations.
How to Get Started?
Getting started with the Environmental and Sustainability Cybersecurity KPI Dashboard in Excel is simple:
-
Download the template
-
Define your KPI list in the KPI Definition tab
-
Enter baseline targets and previous year data
-
Begin inputting actual monthly figures
-
Review dashboards and trends monthly
The more consistently you use it, the more actionable insights you’ll generate.
Conclusion
The Environmental and Sustainability Cybersecurity KPI Dashboard in Excel provides a smart and accessible solution for modern organizations. It empowers teams to track key cybersecurity metrics while staying aligned with eco-conscious goals.
No need for expensive tools—this Excel-based dashboard gives you everything you need in one place. From tracking monthly trends to optimizing your cyber-eco strategy, it’s a must-have for digital sustainability management.
Frequently Asked Questions (FAQs)
❓ What is a Cybersecurity KPI?
A cybersecurity KPI (Key Performance Indicator) is a measurable value that shows how well an organization performs in managing its information security risks.
❓ Why combine cybersecurity with sustainability?
Combining both helps organizations improve energy efficiency, reduce carbon footprint, and support ESG compliance while staying digitally secure.
❓ Do I need Excel skills to use this dashboard?
Basic Excel knowledge is enough. The dashboard uses formulas, drop-downs, and charts, all built-in and ready to go.
❓ Can I add more KPIs?
Yes! Go to the KPI Definition tab, add new KPIs, and include them in the Actual, Target, and PY sheets.
❓ How often should I update the dashboard?
Monthly updates are recommended to keep MTD and YTD comparisons accurate and useful.
❓ Is this dashboard suitable for large enterprises?
Yes. It is scalable and can be adjusted for SMEs or large-scale corporations with minimal changes.
Visit our YouTube channel to learn step-by-step video tutorials